 RSS Feed
 by Calculated Risk on 12/28/2022 01:41:00 PM
Wednesday, December 28, 2022
Ten Economic Questions for 2023
Here is a review of the Ten Economic Questions for 2022
Below are my ten questions for 2023 (I've been doing this every year for over a decade!). These are just questions; I'll follow up with some thoughts on each of these questions.
The purpose of these questions is to provide a framework to think about how the U.S. economy will perform in 2023, and if there are surprises - like in 2020 - to adjust my thinking.
1) Economic growth: Economic growth was probably under 1% in 2022 as the economy slowed following the economic rebound in 2021. The FOMC is expecting growth of just 0.4% to 1.0% Q4-over-Q4 in 2023. How much will the economy grow in 2023? Will there be a recession in 2023?
2) Employment: Through November 2022, the economy added 4.3 million jobs in 2022. This makes 2022 the second-best year for job growth in US history, only behind the 6.7 million jobs added in 2021. How much will job growth slow in 2023? Or will the economy lose jobs?
3) Unemployment Rate: The unemployment rate was at 3.7% in November, down 0.5 percentage points year-over-year. Currently the FOMC is forecasting the unemployment rate will increase to the 4.4% to 4.7% range in Q4 2023. What will the unemployment rate be in December 2023?
4) Participation Rate: In November 2022, the overall participation rate was at 62.1%, up year-over-year from 61.9% in November 2021, but still below the pre-pandemic level of 63.4%. Long term, the BLS is projecting the overall participation rate will decline to 60.1% by 2031 due to demographics. What will the participation rate be in December 2023?
5) Inflation: Core PCE was up 4.7% YoY through November. This was down from a peak of 5.4% in early 2022. The FOMC is forecasting the YoY change in core PCE will be in the 3.2% to 3.7% range in Q4 2023. Will the core inflation rate decrease in 2023, and what will the YoY core inflation rate be in December 2023?
6) Monetary Policy: In response to the increase in inflation, the FOMC raised the federal funds rate from "0 to 1/4 percent" in January 2022, to "4-1/4 to 4-1/2 percent" in December. A majority of FOMC participants expect three or even four 25 bp rate hikes in 2023. What will the Fed Funds rate be in December 2023?
7) Wage Growth: Wage growth was strong in 2022 (up 5.1% year-over-year as of November). How much will wages increase in 2023?
8) Residential Investment: Residential investment (RI) was a drag on growth in 2022 as the housing market slowed sharply. Through November, starts were down 1.2% year-to-date compared to the same period in 2021. New home sales were down 15.2% year-to-date through November. Note: RI is mostly investment in new single-family structures, multifamily structures, home improvement and commissions on existing home sales. How much will RI change in 2023? How about housing starts and new home sales in 2023?
9) House Prices: It appears house prices - as measured by the national repeat sales index (Case-Shiller, FHFA, and CoreLogic) - will be up around 7% in 2022. What will happen with house prices in 2023?
10) Housing Inventory: Housing inventory decreased sharply during the pandemic to record lows in early 2022. Since then, inventory has increased, but is still well below pre-pandemic levels. Will inventory increase further in 2023?
NAR: Pending Home Sales Decreased 4.0% in November, Year-over-year Down 37.8%
by Calculated Risk on 12/28/2022 10:12:00 AM
From the NAR: Pending Home Sales Slid 4.0% in November
Pending home sales slid for the sixth consecutive month in November, according to the National Association of REALTORS®. All four U.S. regions recorded month-over-month decreases, and all four regions saw year-over-year declines in transactions.This was much larger than the expected decline for this index. Note: Contract signings usually lead sales by about 45 to 60 days, so this would usually be for closed sales in December and January.
"Pending home sales recorded the second-lowest monthly reading in 20 years as interest rates, which climbed at one of the fastest paces on record this year, drastically cut into the number of contract signings to buy a home," said NAR Chief Economist Lawrence Yun. "Falling home sales and construction have hurt broader economic activity."
The Pending Home Sales Index (PHSI)* — a forward-looking indicator of home sales based on contract signings — fell 4.0% to 73.9 in November. Year-over-year, pending transactions dropped by 37.8%. An index of 100 is equal to the level of contract activity in 2001.
...
The Northeast PHSI slipped 7.9% from last month to 63.3, a drop of 34.9% from November 2021. The Midwest index decreased 6.6% to 77.8 in November, a fall of 31.6% from one year ago.
The South PHSI retracted 2.3% to 88.5 in November, fading 38.5% from the prior year. The West index dropped by 0.9% in November to 55.1, retreating 45.7% from November 2021.
emphasis added
Final Look at Local Housing Markets in November
by Calculated Risk on 12/28/2022 08:40:00 AM
Today, in the Calculated Risk Real Estate Newsletter: Final Look at Local Housing Markets in November
A brief excerpt:
The big story for November existing home sales was the sharp year-over-year (YoY) decline in sales. Another key story was that new listings were down further YoY in November as many potential sellers are locked into their current home (low mortgage rate). And active inventory increased sharply YoY.There is much more in the article. You can subscribe at https://calculatedrisk.substack.com/
This is the final look at local markets in November. I’m tracking about 35 local housing markets in the US. Some of the 35 markets are states, and some are metropolitan areas. I update these tables throughout each month as additional data is released.
NOTE: I’ll be adding several more markets next month!
First, here is a table comparing the year-over-year Not Seasonally Adjusted (NSA) declines in sales this year from the National Association of Realtors® (NAR) with the local markets I track. So far, these measures have tracked closely. The NAR reported sales were down 35.2% NSA YoY in November.
...
More local data coming in January for activity in December!
My early expectation is we will see a similar YoY sales decline in December as in November, due to the increase in mortgage rates in September and October.

Tuesday, December 27, 2022
Wednesday: Pending Home Sales
by Calculated Risk on 12/27/2022 08:26:00 PM
 Note: Mortgage rates are from MortgageNewsDaily.com and are for top tier scenarios.
Note on MBA Index: "Due to the holiday, the results for weeks ending December 23, 2022 and December 30, 2022 will both be released on January 4, 2023."
Wednesday:
• At 10:00 AM ET, Pending Home Sales Index for November. The consensus is for a 0.5% decrease in the index.
• At 10:00 AM, Richmond Fed Survey of Manufacturing Activity for December. This is the last of regional manufacturing surveys for December.
SF Fed: Recession Prediction on the Clock
by Calculated Risk on 12/27/2022 02:07:00 PM
Here is an interesting paper from San Francisco Fed economist Thomas Mertens Recession Prediction on the Clock
Based on current data, recession probabilities are elevated according to the slope of the yield curve where they are 25 percentage points above the threshold for recession prediction at a 12-month horizon. For the jobless unemployment rate, they currently stand 16 percentage points below the threshold at a 6-month horizon and are thus still relatively low. While the most recent reading of the recession clock has crossed 12 o’clock into the first quadrant, the three-month moving average still shows that it hasn’t done so on a sustained basis. This assessment could change quickly if the unemployment rate ticks up in coming months.This is similar to the Sahm Rule (using the change in the unemployment rate), but seems to be more of a leading indicator as opposed to coincident indicator.
Comments on October Case-Shiller and FHFA House Prices
by Calculated Risk on 12/27/2022 09:54:00 AM
Today, in the Calculated Risk Real Estate Newsletter: Case-Shiller: National House Price Index "Continued to Decline" to 9.2% year-over-year increase in October
Excerpt:
Both the Case-Shiller House Price Index (HPI) and the Federal Housing Finance Agency (FHFA) HPI for October were released today. Here is a graph of the month-over-month (MoM) change in the Case-Shiller National Index Seasonally Adjusted (SA).
The Case-Shiller Home Price Indices for “October” is a 3-month average of August, September and October closing prices. August closing prices include some contracts signed in June, so there is a significant lag to this data.
The MoM decrease in the Case-Shiller National Index was at -0.26% seasonally adjusted. This was the fourth consecutive MoM decrease, but smaller than the decrease over the previous three months.
On a seasonally adjusted basis, prices declined in all of the Case-Shiller cities on a month-to-month basis. The largest monthly declines seasonally adjusted were in Las Vegas (-1.3%), Phoenix (-1.2%) and Dallas, Miami and San Francisco (all at -0.9%). San Francisco has fallen 11.0% from the peak in May 2022.
...
The October Case-Shiller report is mostly for contracts signed in the June through September period when 30-year mortgage rates were mostly in low-to-mid 5% range except in September when rates moved up to the low 6% range. The November report will mostly be for contracts signed in the July through October period - and will be impacted partially by the surge in rates in October.
The impact from higher rates in October and November will not show up significantly in the Case-Shiller index for a couple more months.

There is much more in the article. You can subscribe at https://calculatedrisk.substack.com/
Case-Shiller: National House Price Index "Continued to Decline" to 9.2% year-over-year increase in October
by Calculated Risk on 12/27/2022 09:11:00 AM
S&P/Case-Shiller released the monthly Home Price Indices for October ("October" is a 3-month average of August, September, and October closing prices).
This release includes prices for 20 individual cities, two composite indices (for 10 cities and 20 cities) and the monthly National index.
From S&P: S&P Corelogic Case-Shiller Index Continued to Decline in October
The S&P CoreLogic Case-Shiller U.S. National Home Price NSA Index, covering all nine U.S. census divisions, reported a 9.2% annual gain in October, down from 10.7% in the previous month. The 10-City Composite annual increase came in at 8.0%, down from 9.6% in the previous month. The 20-City Composite posted a 8.6% year-over-year gain, down from 10.4% in the previous month.
Miami, Tampa, and Charlotte reported the highest year-over-year gains among the 20 cities in October. Miami led the way with a 21% year-over-year price increase, followed by Tampa in second with a 20.5% increase, and Charlotte in third with a 15% increase. All 20 cities reported lower price increases in the year ending October 2022 versus the year ending September 2022.
...
Before seasonal adjustment, the U.S. National Index posted a -0.5% month-over-month decrease in October, while the 10-City and 20-City Composites posted decreases of -0.7% and -0.8%, respectively.
After seasonal adjustment, the U.S. National Index posted a month-over-month decrease of -0.3%, and the 10-City and 20-City Composites both posted decreases of -0.5%.
In October, all 20 cities reported declines before and after seasonal adjustments.
“October 2022 marked the fourth consecutive month of declining home prices in the U.S.,” says Craig J. Lazzara, Managing Director at S&P DJI. “For example, the National Composite Index fell -0.5% for the month, reflecting a -3.0% decline since the market peaked in June 2022. We saw comparable patterns in our 10- and 20-City Composites, both of which stand -4.6% below their June peaks after October declines of -0.7% and -0.8%, respectively. These declines, of course, came after very strong price increases in late 2021 and the first half of 2022. Despite its recent weakness, on a year-over-year basis the National Composite gained 9.2%, which is in the top quintile of historical performance levels.
“Despite considerable regional differences, all 20 cities in our October report reflect these trends of short-term decline and medium-term deceleration. Prices declined in every city in October, with a median change of -0.9%. Year-over-year price gains in all 20 cities were lower in October than they had been in September; the median year-over-year increase across the 20 cities was 8.3%.
emphasis added
 Click on graph for larger image.
 The first graph shows the nominal seasonally adjusted Composite 10, Composite 20 and National indices (the Composite 20 was started in January 2000).
The Composite 10 index is down 0.5% in October (SA) and down 3.8% from the recent peak in June 2022.
The Composite 20 index is down 0.5% (SA) in October and down 3.8% from the recent peak in June 2022.
The National index is down 0.3% (SA) in October and is down 2.4% from the peak in June 2022.
 The second graph shows the year-over-year change in all three indices.
The Composite 10 SA is up 8.0% year-over-year. The Composite 20 SA is up 9.6% year-over-year.
The National index SA is up 9.2% year-over-year.
Annual price increases were close to expectations. I'll have more later.
Monday, December 26, 2022
Tuesday: Case-Shiller House Prices
by Calculated Risk on 12/26/2022 07:05:00 PM
Weekend:
• Schedule for Week of December 25, 2022
Monday:
• At 9:00 AM ET, FHFA House Price Index for October. This was originally a GSE only repeat sales, however there is also an expanded index.
• Also at 9:00 AM, S&P/Case-Shiller House Price Index for October. The consensus is for an 8.0% year-over-year increase in the Composite 20 index for October.
• At 10:30 AM, Dallas Fed Survey of Manufacturing Activity for December.
From CNBC: Pre-Market Data and Bloomberg futures S&P 500 are up 24, and DOW futures are up 160 (fair value).
Oil prices were up over the last week with WTI futures at $80.31 per barrel and Brent at $83.92 per barrel. A year ago, WTI was at $75, and Brent was at $75 - so WTI oil prices are up 4% year-over-year.
Here is a graph from Gasbuddy.com for nationwide gasoline prices. Nationally prices are at $3.05 per gallon. A year ago, prices were at $3.25 per gallon, so gasoline prices are down $0.20 per gallon year-over-year.
Review: Ten Economic Questions for 2022
by Calculated Risk on 12/26/2022 02:45:00 PM
At the end of each year, I post Ten Economic Questions for the following year (2022). I followed up with a brief post on each question. Here is review (we don't have all data yet, but enough). I've linked to my posts from the beginning of the year, with a brief excerpt and a few comments.
I don't have a crystal ball, but I think it helps to outline what I think will happen - and understand - and change my mind, when the outlook is wrong. As an example, when the pandemic hit, I switched from being mostly positive on the economy to calling a recession in early March 2020.
10) Question #10 for 2022: Will inventory increase as the pandemic subsides, or will inventory decrease further in 2022?
"The bottom line is inventory will probably set new record lows over the next couple of months, and then inventory will likely increase YoY later in the year. However, it seems unlikely that inventory will be back up to the 2017 - 2019 levels. Inventory is always something to watch!"

Here is a graph from Realtor.com showing active inventory through November 2022.
As expected, inventory hit new record lows early in 2022, and is finishing the year up significantly year-over-year - but not close to the 2017 - 2019 levels.
Note: The NAR reported inventory was up 2.7% year-over-year in November compared to November 2021. This appears to include some pending sales and doesn’t match some other measures of inventory (Altos and Realtor.com).
9) Question #9 for 2022: What will happen with house prices in 2022?
"[B]ased on my inventory forecast and further progress with the pandemic, my guess is that year-over-year price increases will probably be the strongest early in the year, and then soften towards the end of 2022. Price appreciation will decrease from the unsustainable 2021 pace but seems likely to still be in the mid-to-high single digit range in 2022."
 This was mostly correct. The year-over-year change in the Case-Shiller index peaked in March 2022, and then softened as the year progressed.
As of September, the National Case-Shiller index SA was up 10.6% year-over-year. (Case-Shiller for October will be released tomorrow).
House prices are now falling month-to-month, but it appears prices will still be up mid-single digits in December.
8) Question #8 for 2022: Housing Credit: Will we see easier mortgage lending in 2022?
"Mortgage equity withdrawal will probably decline in 2022, since fewer homeowners will refinance their mortgages. However, there is some concern about banks easing lending standards, and the rapid increase in non-QM loans. This will be something to watch in 2022, but overall lending is still solid (unlike during the housing bubble)."Mortgage equity withdrawal was surprising still solid in 2022 as homeowners switched from refinancing existing mortgages to using home equity loans (2nd loans) to extract equity from their homes.
Banks generally tightened standards on mortgage loans.
7) Question #7 for 2022: How much will Residential investment change in 2022? How about housing starts and new home sales in 2022?
6) Question #6 for 2022: Will the Fed raise rates in 2022? If so, how many times?
5) Question #5 for 2022: Will the core inflation rate increase or decrease by December 2022?
4) Question #4 for 2022: Will the overall participation rate increase to pre-pandemic levels (63.4% in February 2020)?
3) Question #3 for 2022: What will the unemployment rate be in December 2022?
2) Question #2 for 2022: Will the remaining jobs lost in 2020 return in 2022, or will job growth be sluggish?
 As of the November employed report, the year-over-year change was +4.9 million jobs - well above my guess.
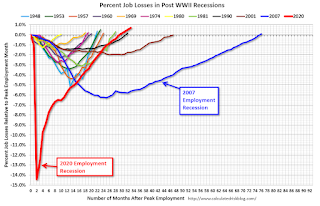
This graph shows the job losses from the start of the employment recession, in percentage terms.
The current employment recession was by far the worst recession since WWII in percentage terms.
7) Question #7 for 2022: How much will Residential investment change in 2022? How about housing starts and new home sales in 2022?
"My guess is starts will be down low-to-mid single digits year-over-year in 2022. New home sales could pick up solidly if existing home inventory stays low, supply issues are resolved, and mortgage rates stay low, but my guess is new home sales will be mostly unchanged year-over-year."Through November, total starts, year-to-date, were down 1.2% compared to the same period in 2021. New home sales were down 15.2% compared to the same period in 2021. Starts were as expected, but new home sales were down as mortgage rates increased quicker than expected.
6) Question #6 for 2022: Will the Fed raise rates in 2022? If so, how many times?
"Currently I expect asset purchases to end as planned in March, and the 1st rate hike to happen at the March meeting, and perhaps a 2nd hike in June. Subsequent rate hikes will depend on the course of the pandemic, inflation and employment, but 3 rate hikes in 2022 seem likely."Huge miss. Inflation was much higher than I expected, and the Fed raised rates far more the expected.
5) Question #5 for 2022: Will the core inflation rate increase or decrease by December 2022?
"The pandemic was the cause of the inflation spike, with supply constraints, a shifting of demand from services to goods, large fiscal transfers, and a smaller labor force pushing up wages. If the pandemic eases, I expect these pressures to ease. My guess is core PCE inflation (year-over-year) will decrease in 2022 (from the current 4.7%), and I think core PCE inflation will be at or below 3% by the end of 2022."According to the November Personal Income and Outlays report, the November PCE price index increased 5.5 percent year-over-year and the November PCE price index, excluding food and energy, increased 4.7 percent year-over-year. Inflation was higher than expected but has been slowing recently.
4) Question #4 for 2022: Will the overall participation rate increase to pre-pandemic levels (63.4% in February 2020)?
"My guess, based on the impact of the pandemic easing, is that most of these people will return to the labor force. I don't expect that participation rate to increase to pre-pandemic levels (63.4%), but it seems reasonable the participation rate will increase to the mid 62s by year end, before trending down again later in the decade."This was mostly correct. The Labor Force Participation Rate was at 62.1% in November.
3) Question #3 for 2022: What will the unemployment rate be in December 2022?
"Depending on the estimate for the participation rate and job growth (next question), my guess is the unemployment rate will decline into the mid 3% range by December 2022 from the current 4.2%."The unemployment rates was at 3.7% in November.
2) Question #2 for 2022: Will the remaining jobs lost in 2020 return in 2022, or will job growth be sluggish?
"My guess is something like 2.5 to 3.0 million jobs could be added in 2022, but it will depend on the pandemic (and policy). This fits with my view of sluggish labor force growth, an increase in the participation rate, and a decline in the unemployment rate. That would mean there are still fewer jobs at the end of 2022, than before the pandemic."
 As of the November employed report, the year-over-year change was +4.9 million jobs - well above my guess.
This graph shows the job losses from the start of the employment recession, in percentage terms.
The current employment recession was by far the worst recession since WWII in percentage terms.
As of August 2022, the total number of jobs had returned and are now 1.044 million above pre-pandemic levels.
1) Question #1 for 2022: How much will the economy grow in 2022?
My biggest misses were on inflation (and Fed policy), GDP (too optimistic) and employment (too pessimistic).
1) Question #1 for 2022: How much will the economy grow in 2022?
"My sense is growth will slow in 2022 noticeably. Some sectors, like vehicle sales, will pick up since vehicle sales were supply constrained in 2021. Other sectors will continue to recover (like travel related) and service sectors. However, some goods sectors will likely decline, and real estate will likely be mostly flat in 2022. Also, fiscal and monetary supply will give less of a boost in 2022. My guess is the real GDP growth will probably be in the 2.5% to 3.5% range in 2022."It now appears GDP growth will be under 1% in 2022.
My biggest misses were on inflation (and Fed policy), GDP (too optimistic) and employment (too pessimistic).
Housing December 26th Weekly Update: Inventory Decreased 2.7% Week-over-week
by Calculated Risk on 12/26/2022 10:50:00 AM
Active inventory decreased last week. Here are the same week inventory changes for the last four years (usually inventory declines seasonally through the Winter - until early March):
2022: -14.0K
2021: -15.5K
2020: -16.9K
2019: -20.7K
Altos reports inventory is down 2.7% week-over-week and down 12.0% from the peak on October 28, 2022.
 Click on graph for larger image.
This inventory graph is courtesy of Altos Research.
 Click on graph for larger image.
This inventory graph is courtesy of Altos Research.
As of December 23rd, inventory was at 508 thousand (7-day average), compared to 522 thousand the prior week.
Compared to the same week in 2021, inventory is up 63.7% from 310 thousand, and compared to the same week in 2020 inventory is up 16.2% from 437 thousand. However, compared to 3 years ago (2019), inventory is down 35.1% from 783 thousand.
Here are the inventory milestones I’ve been watching for with the Altos data:
1. The seasonal bottom (happened on March 4, 2022, for Altos) ✅
2. Inventory up year-over-year (happened on May 20, 2022, for Altos) ✅
3. Inventory up compared to 2020 (happened on October 7, 2022, for Altos) ✅
4. Inventory up compared to 2019 (currently down 35.1%).
Mike Simonsen discusses this data regularly on Youtube.
1. The seasonal bottom (happened on March 4, 2022, for Altos) ✅
2. Inventory up year-over-year (happened on May 20, 2022, for Altos) ✅
3. Inventory up compared to 2020 (happened on October 7, 2022, for Altos) ✅
4. Inventory up compared to 2019 (currently down 35.1%).

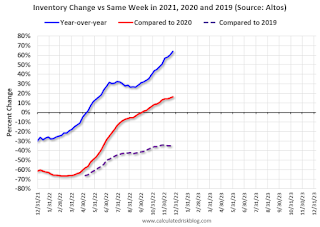
Here is a graph of the inventory change vs 2021 (milestone 2 above), 2020 (milestone 3) and 2019 (milestone 4). The blue line is the year-over-year data, the red line is compared to two years ago, and dashed purple is compared to 2019.
A key will be if inventory declines slower than usual during the winter months - or starts increasing earlier than usual (bottom is usually in early March of each year).
Mike Simonsen discusses this data regularly on Youtube.


