by Calculated Risk on 12/27/2022 09:11:00 AM
Tuesday, December 27, 2022
Case-Shiller: National House Price Index "Continued to Decline" to 9.2% year-over-year increase in October
S&P/Case-Shiller released the monthly Home Price Indices for October ("October" is a 3-month average of August, September, and October closing prices).
This release includes prices for 20 individual cities, two composite indices (for 10 cities and 20 cities) and the monthly National index.
From S&P: S&P Corelogic Case-Shiller Index Continued to Decline in October
The S&P CoreLogic Case-Shiller U.S. National Home Price NSA Index, covering all nine U.S. census divisions, reported a 9.2% annual gain in October, down from 10.7% in the previous month. The 10-City Composite annual increase came in at 8.0%, down from 9.6% in the previous month. The 20-City Composite posted a 8.6% year-over-year gain, down from 10.4% in the previous month.
Miami, Tampa, and Charlotte reported the highest year-over-year gains among the 20 cities in October. Miami led the way with a 21% year-over-year price increase, followed by Tampa in second with a 20.5% increase, and Charlotte in third with a 15% increase. All 20 cities reported lower price increases in the year ending October 2022 versus the year ending September 2022.
...
Before seasonal adjustment, the U.S. National Index posted a -0.5% month-over-month decrease in October, while the 10-City and 20-City Composites posted decreases of -0.7% and -0.8%, respectively.
After seasonal adjustment, the U.S. National Index posted a month-over-month decrease of -0.3%, and the 10-City and 20-City Composites both posted decreases of -0.5%.
In October, all 20 cities reported declines before and after seasonal adjustments.
“October 2022 marked the fourth consecutive month of declining home prices in the U.S.,” says Craig J. Lazzara, Managing Director at S&P DJI. “For example, the National Composite Index fell -0.5% for the month, reflecting a -3.0% decline since the market peaked in June 2022. We saw comparable patterns in our 10- and 20-City Composites, both of which stand -4.6% below their June peaks after October declines of -0.7% and -0.8%, respectively. These declines, of course, came after very strong price increases in late 2021 and the first half of 2022. Despite its recent weakness, on a year-over-year basis the National Composite gained 9.2%, which is in the top quintile of historical performance levels.
“Despite considerable regional differences, all 20 cities in our October report reflect these trends of short-term decline and medium-term deceleration. Prices declined in every city in October, with a median change of -0.9%. Year-over-year price gains in all 20 cities were lower in October than they had been in September; the median year-over-year increase across the 20 cities was 8.3%.
emphasis added
 Click on graph for larger image.
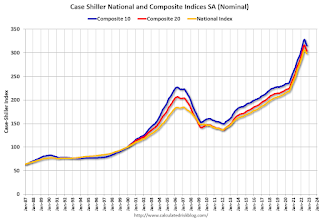
 The first graph shows the nominal seasonally adjusted Composite 10, Composite 20 and National indices (the Composite 20 was started in January 2000).
The Composite 10 index is down 0.5% in October (SA) and down 3.8% from the recent peak in June 2022.
The Composite 20 index is down 0.5% (SA) in October and down 3.8% from the recent peak in June 2022.
The National index is down 0.3% (SA) in October and is down 2.4% from the peak in June 2022.
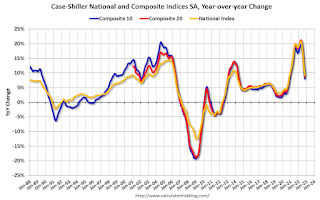
 The second graph shows the year-over-year change in all three indices.
The Composite 10 SA is up 8.0% year-over-year. The Composite 20 SA is up 9.6% year-over-year.
The National index SA is up 9.2% year-over-year.
Annual price increases were close to expectations. I'll have more later.


