 RSS Feed
 by Calculated Risk on 12/10/2022 02:11:00 PM
Saturday, December 10, 2022
Real Estate Newsletter Articles this Week: Mortgage Equity Withdrawal Still Solid in Q3
At the Calculated Risk Real Estate Newsletter this week:
• Mortgage Equity Withdrawal Still Solid in Q3
• 2023 Housing Forecasts
• 1st Look at Local Housing Markets in November
• Q3 Update: Delinquencies, Foreclosures and REO
• Black Knight Mortgage Monitor: Home Prices Declined in October; Down 3.2% since June
This is usually published 4 to 6 times a week and provides more in-depth analysis of the housing market.
You can subscribe at https://calculatedrisk.substack.com/
Most content is available for free (and no Ads), but please subscribe!
Schedule for Week of December 11, 2022
by Calculated Risk on 12/10/2022 08:11:00 AM
The key economic reports this week are November CPI and Retail Sales.
For manufacturing, November Industrial Production, and the December New York and Philly Fed surveys, will be released this week.
The FOMC meets this week, and the FOMC is expected to announce a 50 bp hike in the Fed Funds rate.
No major economic releases scheduled.
6:00 AM: NFIB Small Business Optimism Index for November.
8:30 AM: The Consumer Price Index for November from the BLS. The consensus is for a 0.3% increase in CPI, and a 0.3% increase in core CPI. The consensus is for CPI to be up 7.3% year-over-year and core CPI to be up 6.1% YoY.
7:00 AM ET: The Mortgage Bankers Association (MBA) will release the results for the mortgage purchase applications index.
During the day: The AIA's Architecture Billings Index for November (a leading indicator for commercial real estate).
2:00 PM: FOMC Meeting Announcement. The FOMC is expected to announce a 50 bp hike in the Fed Funds rate.
2:00 PM: FOMC Forecasts This will include the Federal Open Market Committee (FOMC) participants' projections of the appropriate target federal funds rate along with the quarterly economic projections.
2:30 PM: Fed Chair Jerome Powell holds a press briefing following the FOMC announcement.
 8:30 AM ET: Retail sales for November will be released. The consensus is for a 0.2% decrease in retail sales.
This graph shows retail sales since 1992. This is monthly retail sales and food service, seasonally adjusted (total and ex-gasoline).
8:30 AM: The initial weekly unemployment claims report will be released. The consensus is for 230 thousand initial claims, unchanged from 230 thousand last week.
8:30 AM: The New York Fed Empire State manufacturing survey for December. The consensus is for a reading of -1.0, down from 4.5.
8:30 AM: the Philly Fed manufacturing survey for December. The consensus is for a reading of -12.0, up from -19.4.
 9:15 AM: The Fed will release Industrial Production and Capacity Utilization for November.
This graph shows industrial production since 1967.
The consensus is for a 0.1% increase in Industrial Production, and for Capacity Utilization to decrease to 79.8%.
No major economic releases scheduled.
Friday, December 09, 2022
COVID Dec 9, 2022: Update on Cases, Hospitalizations and Deaths
by Calculated Risk on 12/09/2022 09:16:00 PM
On COVID (focus on hospitalizations and deaths). Data is now weekly.
| COVID Metrics | ||||
|---|---|---|---|---|
| Now | Week Ago | Goal | ||
| New Cases per Week2🚩 | 458,986 | 306,773 | ≤35,0001 | |
| Hospitalized2🚩 | 29,598 | 26,015 | ≤3,0001 | |
| Deaths per Week2🚩 | 2,981 | 1,844 | ≤3501 | |
| 1my goals to stop weekly posts, 2Weekly for Cases, Currently Hospitalized, and Deaths 🚩 Increasing number weekly for Cases, Hospitalized, and Deaths ✅ Goal met. | ||||
 Click on graph for larger image.
This graph shows the weekly (columns) number of deaths reported.
NOTE: The data is probably catching up from the low levels during the holiday week, but this is the most cases since September, and the most deaths since early October.
Q4 GDP Tracking
by Calculated Risk on 12/09/2022 05:13:00 PM
From BofA:
The components of PPI that we use to deflate structures investment and inventories imply modestly more non-residential investment and inventory accumulation in the quarter than we were assuming. After rounding, our 4Q US GDP tracking estimate moved up one-tenth to 1.6% q/q saar. [Dec 9th estimate]From Goldman:
emphasis added
We lowered our Q4 GDP tracking estimate by 0.1pp to +1.7% (qoq ar). [Dec 9th estimate]And from the Altanta Fed: GDPNow
The GDPNow model estimate for real GDP growth (seasonally adjusted annual rate) in the fourth quarter of 2022 is 3.2 percent on December 9, down from 3.4 percent on December 6. After this morning's releases from the US Census Bureau and the US Bureau of Labor Statistics, the nowcast of fourth-quarter gross private domestic investment growth decreased from 1.7 percent to 0.7 percent. [Dec 9th estimate]
Mortgage Equity Withdrawal Still Solid in Q3; Homeowners now relying on Home Equity lines to extract equity
by Calculated Risk on 12/09/2022 12:58:00 PM
Today, in the Real Estate Newsletter: Mortgage Equity Withdrawal Still Solid in Q3
Excerpt:
Here is the quarterly increase in mortgage debt from the Federal Reserve’s Financial Accounts of the United States - Z.1 (sometimes called the Flow of Funds report) released today. In the mid ‘00s, there was a large increase in mortgage debt associated with the housing bubble.There is much more in the article. You can subscribe at https://calculatedrisk.substack.com/ (All ad free, most content free).
In Q3 2022, mortgage debt increased $209 billion, down from $258 billion in Q2, but still fairly high. Note the almost 7 years of declining mortgage debt as distressed sales (foreclosures and short sales) wiped out a significant amount of debt.
However, some of this debt is being used to increase the housing stock (purchase new homes), so this isn’t all Mortgage Equity Withdrawal (MEW).

Fed's Flow of Funds: Household Net Worth Decreased $0.4 Trillion in Q3
by Calculated Risk on 12/09/2022 12:24:00 PM
The Federal Reserve released the Q3 2022 Flow of Funds report today: Financial Accounts of the United States.
The net worth of households and nonprofits fell to $143.3 trillion during the third quarter of 2022. The value of directly and indirectly held corporate equities decreased $1.9 trillion and the value of real estate increased $0.8 trillion.
...
Household debt increased 6.3 percent at an annual rate in the third quarter of 2022. Consumer credit grew at an annual rate of 7 percent, while mortgage debt (excluding charge-offs) grew at an annual rate of 6.6 percent.
 Click on graph for larger image.
The first graph shows Households and Nonprofit net worth as a percent of GDP.
Net worth as a percent of GDP is down $6.8 trillion from the all-time high in Q4 2021.
This includes real estate and financial assets (stocks, bonds, pension reserves, deposits, etc) net of liabilities (mostly mortgages). Note that this does NOT include public debt obligations.
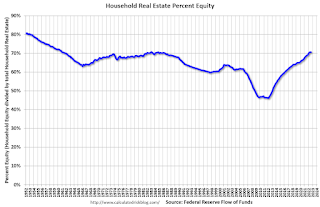 The second graph shows homeowner percent equity since 1952.
Household percent equity (as measured by the Fed) collapsed when house prices fell sharply in 2007 and 2008.
In Q3 2022, household percent equity (of household real estate) was at 70.5% - unchanged from 70.5% in Q2, 2022. This is the highest percent equity since the early 1980s.
Note: This includes households with no mortgage debt.
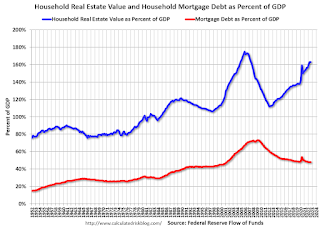 The third graph shows household real estate assets and mortgage debt as a percent of GDP. Note this graph was impacted by the sharp decline in Q2 2020 GDP.
Mortgage debt increased by $209 billion in Q3.
Mortgage debt is up $1.66 trillion from the peak during the housing bubble, but, as a percent of GDP is at 48.1% - unchanged from Q3 - and down from a peak of 73.3% of GDP during the housing bust.
The value of real estate, as a percent of GDP, decreased slightly in Q3, and is well above the average of the last 30 years.
 The second graph shows homeowner percent equity since 1952.
 Household percent equity (as measured by the Fed) collapsed when house prices fell sharply in 2007 and 2008.
In Q3 2022, household percent equity (of household real estate) was at 70.5% - unchanged from 70.5% in Q2, 2022. This is the highest percent equity since the early 1980s.
Note: This includes households with no mortgage debt.
 The third graph shows household real estate assets and mortgage debt as a percent of GDP. Note this graph was impacted by the sharp decline in Q2 2020 GDP.
Mortgage debt increased by $209 billion in Q3.
Mortgage debt is up $1.66 trillion from the peak during the housing bubble, but, as a percent of GDP is at 48.1% - unchanged from Q3 - and down from a peak of 73.3% of GDP during the housing bust.
The value of real estate, as a percent of GDP, decreased slightly in Q3, and is well above the average of the last 30 years.
Leading Index for Commercial Real Estate Increases in November
by Calculated Risk on 12/09/2022 09:21:00 AM
From Dodge Data Analytics: Dodge Momentum Index Advances In November
The Dodge Momentum Index (DMI), issued by Dodge Construction Network, increased 3.8% (2000=100) in November to 207.2 from the revised October reading of 199.6. During the month, the DMI continued its steady ascent, with the commercial component rising 4.3%, and the institutional component ticking up 2.7%.
Commercial planning experienced a healthy increase in hotel and data center projects and modest growth in stores and office projects. While education and healthcare projects slowed in November, the institutional component remained net-positive alongside a robust increase in planning projects for government administrative buildings and religious facilities. On a year-over-year basis, the DMI was 25% higher than in November 2021, the commercial component was up 28%, and institutional planning was 21% higher.
...
“The Momentum Index continued to rise in November, conveying hopefulness from owners and developers that the construction sector will endure the possible economic slowdown next year,” said Sarah Martin, senior economist for Dodge Construction Network. “The rate of increase in the DMI, however, has steadied over the month. Labor and supply shortages, high material costs and high interest rates could temper planning activity over the next 12 months to a more modest pace.”
The DMI is a monthly measure of the initial report for nonresidential building projects in planning, shown to lead construction spending for nonresidential buildings by a full year.
emphasis added
 Click on graph for larger image.
This graph shows the Dodge Momentum Index since 2002. The index was at 207.2 in November, up from 199.7 in October.
According to Dodge, this index leads "construction spending for nonresidential buildings by a full year". This index suggests a solid pickup in commercial real estate construction into 2023.
Thursday, December 08, 2022
Friday: PPI, Flow of Funds
by Calculated Risk on 12/08/2022 09:01:00 PM
 Note: Mortgage rates are from MortgageNewsDaily.com and are for top tier scenarios.
Friday:
• At 8:30 AM ET, The Producer Price Index for November from the BLS. The consensus is for a 0.3% increase in PPI, and a 0.2% increase in core PPI.
• At 10:00 AM, University of Michigan's Consumer sentiment index (Preliminary for December).
• At 12:00 PM, Q3 Flow of Funds Accounts of the United States from the Federal Reserve.
Realtor.com Reports Weekly Active Inventory Up 53% Year-over-year; New Listings Down 8%
by Calculated Risk on 12/08/2022 03:50:00 PM
Realtor.com has monthly and weekly data on the existing home market. Here is their weekly report released today from Chief Economist Danielle Hale: Weekly Housing Trends View — Data Week Ending Dec 3, 2022. Note: They have data on list prices, new listings and more, but this focus is on inventory.
• Active inventory growth held steady with for-sale homes up 53% above one year ago. Inventory growth steadied this week, the first time in eight weeks that we didn’t see a larger yearly growth rate compared to the prior week. This move is even more impressive as it comes against a backdrop of smaller listing declines and growing time on market.
...
• New listings–a measure of sellers putting homes up for sale–were again down, but dropped only 8% from one year ago. This marks the twenty-second consecutive week of year-over-year declines in homeowners listing their home for sale, but was the smallest decline since July.
 Here is a graph of the year-over-year change in inventory according to realtor.com.
 Note the rapid increase in the YoY change earlier this year, from down 30% at the beginning of the year, to up 29% YoY at the beginning of July.
Then the Realtor.com data was stuck at up around 26% to 30% YoY for 14 weeks in a row. This was due to the slowdown in new listings, even as sales had fallen sharply.
Then the YoY change started increasing sharply again as mortgage rates increased.
This week was a change from the previous 3 months - no increase in the year-over-year change in inventory - even with a smaller decline in new listings (inventory is falling week-to-week, but the comparison is YoY).
Hotels: Occupancy Rate Down 7.7% Compared to Same Week in 2019
by Calculated Risk on 12/08/2022 03:14:00 PM
U.S. hotel performance came in higher than the previous week but showed weakened comparisons to 2019, according to STR‘s latest data through Dec. 3.The following graph shows the seasonal pattern for the hotel occupancy rate using the four-week average.
Nov. 27 through Dec. 3, 2022 (percentage change from comparable week in 2019*):
• Occupancy: 55.4% (-7.7%)
• Average daily rate (ADR): $141.71 (+10.2%)
• Revenue per available room (RevPAR): $78.50 (+1.7%)
*Due to the pandemic impact, STR is measuring recovery against comparable time periods from 2019.
emphasis added
 Click on graph for larger image.
The red line is for 2022, black is 2020, blue is the median, and dashed light blue is for 2021. Dashed purple is 2019 (STR is comparing to a strong year for hotels).
The 4-week average of the occupancy rate is above the median rate for the previous 20 years (Blue) and close to 2019 levels.
Note: Y-axis doesn't start at zero to better show the seasonal change.
The 4-week average of the occupancy rate continue to decline into the Winter.


