 RSS Feed
 by Calculated Risk on 7/09/2022 08:11:00 AM
Saturday, July 09, 2022
AAR: June Rail Carloads and Intermodal Down Year-over-year
From the Association of American Railroads (AAR) Rail Time Indicators. Graphs and excerpts reprinted with permission.
In June, total U.S. carloads fell 1.5% from last year, their third consecutive monthly decline. ...
U.S intermodal originations in June were down 4.6% from last year, their fifth decline in 2022’s first six months.
emphasis added
 Click on graph for larger image.
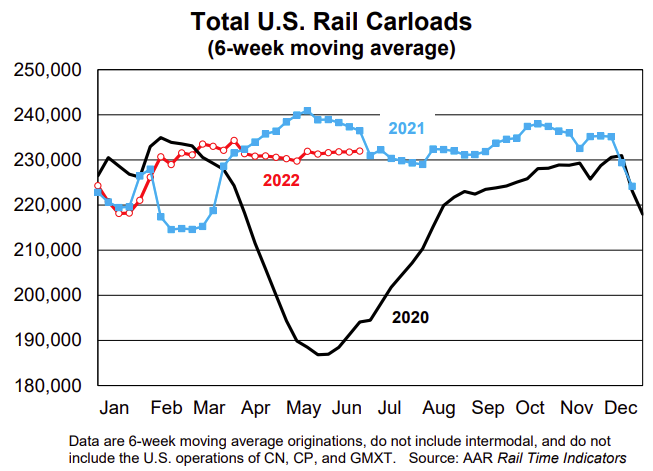
This graph from the Rail Time Indicators report shows the six-week average of U.S. Carloads in 2020, 2021 and 2022:
U.S. railroads originated 1.16 million total carloads in June 2022, down 1.5% from June 2021. It’s the third consecutive year-over-year decline and the fourth in the first six months of 2022. In 2022’s second quarter, total carloads were down 2.7% from last year; in the first half, they were down 0.1%. Since 1988, when our data begin, only 2020 had fewer first-half carloads than 2022.
 The second graph shows the six-week average (not monthly) of U.S. intermodal in 2020, 2021 and 2022: (using intermodal or shipping containers):
U.S railroads also originated 1.32 million intermodal units in June, down 4.6% from last year. It’s the fifth decline in 2022’s first six months and the 10th in the past 11 months. Intermodal originations averaged 264,624 per week in June 2022, the fewest in four months.
Schedule for Week of July 10, 2022
by Calculated Risk on 7/09/2022 08:11:00 AM
The key reports this week are June CPI and retail sales.
For manufacturing, the June Industrial Production report and the July New York Fed manufacturing survey will be released.
No major economic releases scheduled.
6:00 AM ET: NFIB Small Business Optimism Index for June.
7:00 AM ET: The Mortgage Bankers Association (MBA) will release the results for the mortgage purchase applications index.
8:30 AM: The Consumer Price Index for June from the BLS. The consensus is for a 1.1% increase in CPI, and a 0.6% increase in core CPI. The consensus is for CPI to be up 8.8% year-over-year and core CPI to be up 5.8% YoY.
2:00 PM: the Federal Reserve Beige Book, an informal review by the Federal Reserve Banks of current economic conditions in their Districts.
8:30 AM: The initial weekly unemployment claims report will be released. The consensus is for 230 thousand down from 235 thousand last week.
8:30 AM: The Producer Price Index for June from the BLS. The consensus is for a 0.8% increase in PPI, and a 0.5% increase in core PPI.
 8:30 AM: Retail sales for June is scheduled to be released. The consensus is for 0.8% increase in retail sales.
This graph shows retail sales since 1992. This is monthly retail sales and food service, seasonally adjusted (total and ex-gasoline).
Retail sales ex-gasoline were down 0.3% in May.
8:30 AM: The New York Fed Empire State manufacturing survey for July. The consensus is for a reading of -2.6, down from -1.2.
 9:15 AM: The Fed will release Industrial Production and Capacity Utilization for June.
This graph shows industrial production since 1967.
The consensus is for a no change in Industrial Production, and for Capacity Utilization to decrease to 80.4%.
10:00 AM: University of Michigan's Consumer sentiment index (Preliminary for July).
Friday, July 08, 2022
COVID July 8, 2022, Update on Cases, Hospitalizations and Deaths
by Calculated Risk on 7/08/2022 09:27:00 PM
On COVID (focus on hospitalizations and deaths):
| COVID Metrics | ||||
|---|---|---|---|---|
| Now | Week Ago | Goal | ||
| Percent fully Vaccinated | 67.0% | --- | ≥70.0%1 | |
| Fully Vaccinated (millions) | 222.5 | --- | ≥2321 | |
| New Cases per Day3 | 106,021 | 112,330 | ≤5,0002 | |
| Hospitalized3🚩 | 29,327 | 27,322 | ≤3,0002 | |
| Deaths per Day3 | 277 | 341 | ≤502 | |
| 1 Minimum to achieve "herd immunity" (estimated between 70% and 85%). 2my goals to stop daily posts, 37-day average for Cases, Currently Hospitalized, and Deaths 🚩 Increasing 7-day average week-over-week for Cases, Hospitalized, and Deaths ✅ Goal met. | ||||
 Click on graph for larger image.
This graph shows the daily (columns) and 7-day average (line) of deaths reported.
Average daily deaths bottomed in July 2021 at 214 per day.
Used Vehicle Wholesale Prices Decreased 1.3% in June
by Calculated Risk on 7/08/2022 03:23:00 PM
From Manheim Consulting today: Wholesale Used-Vehicle Prices Decrease in June from Seasonal Adjustment
Wholesale used-vehicle prices (on a mix-, mileage-, and seasonally adjusted basis) decreased 1.3% in June from May. The Manheim Used Vehicle Value Index declined to 219.9, up 9.7% from a year ago. The non-adjusted price change in June decreased 1.8% compared to May, leaving the unadjusted average price up 10.7% year over year.
In June, Manheim Market Report (MMR) values saw larger declines over the last two weeks than the prior two weeks.
emphasis added
 Click on graph for larger image.
This index from Manheim Consulting is based on all completed sales transactions at Manheim’s U.S. auctions.
The Manheim index suggests used car prices decreased in June and are up 9.7% year-over-year (YoY).
The YoY change is mostly getting smaller. This index was up 45% YoY in January, and now up less than 10% YoY.
Apartment Vacancy Rate Declined in Q2
by Calculated Risk on 7/08/2022 01:25:00 PM
Today, in the Calculated Risk Real Estate Newsletter: Apartment Vacancy Rate Declined in Q2
A brief excerpt:
Moody’s Analytics Reis reported that the apartment vacancy rate was at 4.5% in Q2 2022, down from 4.7% in Q1, and down from a pandemic peak of 5.4% in both Q1 and Q2 2021.There is more in the article. You can subscribe at https://calculatedrisk.substack.com/
...
This graph shows the apartment vacancy rate starting in 1980. (Annual rate before 1999, quarterly starting in 1999). Note: Moody’s Analytics is just for large cities. ...
Click on graph for larger image.
Moody’s Analytics also reported the effective rents were up 2.8% in Q2 from Q1, and up 17.5% year-over-year. Last week, I posted a graph of the year-over-year change for various measures of rent. The Zillow measure is up 15.9% YoY in May, down from 16.6% YoY in April. This is down from a peak of 17.2% YoY in February. The ApartmentList measure is up 14.1% YoY as of June, down from 15.4% in May. This is down from the peak of 17.8% YoY last December.

Q2 GDP Forecasts: Slightly Negative
by Calculated Risk on 7/08/2022 12:22:00 PM
Note: We've seen two consecutive quarters of negative GDP before without a recession (that isn't the definition). If Q2 is negative, it will mostly be due to inventory and trade issues. No worries. My view is the US economy is not currently in a recession, see: Predicting the Next Recession
From BofA:
We are now tracking -1.2% qoq saar growth for 2Q, down from 0.0% qoq saar previously.From Goldman:
It is reasonable to dismiss some of the signal from the GDP declines that may have taken place in the first two quarters of the year on account of the large negative contributions from net trade and inventories. In addition, there is a larger-than-normal gap between GDP and GDI which, historically, has been resolved by GDP getting revised toward GDI, suggesting that some of the as-reported weakness in activity may get revised away over time. [July 8 estimate]
emphasis added
We left our Q2 GDP tracking estimate unchanged at +0.7% (qoq ar). [July 8 estimate]And from the Altanta Fed: GDPNow
The GDPNow model estimate for real GDP growth (seasonally adjusted annual rate) in the second quarter of 2022 is -1.2 percent on July 8, up from -1.9 percent on July 7. [July 8 estimate]
Comments on June Employment Report
by Calculated Risk on 7/08/2022 09:27:00 AM
The headline jobs number in the June employment report was above expectations, however employment for the previous two months was revised down by 74,000. The participation rate and the employment-population ratio both decreased slightly, and the unemployment rate was unchanged at 3.6%.
Excluding leisure and hospitality, the economy has 800 thousand more jobs then prior to the pandemic.
Leisure and hospitality gained 67 thousand jobs in June. At the beginning of the pandemic, in March and April of 2020, leisure and hospitality lost 8.20 million jobs, and are now down 1.32 million jobs since February 2020. So, leisure and hospitality has now added back about 84% all of the jobs lost in March and April 2020.
Construction employment increased 13 thousand and is now 46 thousand above the pre-pandemic level.
Manufacturing added 29 thousand jobs and is now 12 thousand above the pre-pandemic level.
Earlier: June Employment Report: 372 thousand Jobs, 3.6% Unemployment Rate
In June, the year-over-year employment change was 6.3 million jobs.
Permanent Job Losers
 Click on graph for larger image.
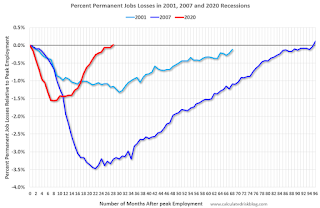
This graph shows permanent job losers as a percent of the pre-recession peak in employment through the report today.
In June, the year-over-year employment change was 6.3 million jobs.
Permanent Job Losers
 Click on graph for larger image.
This graph shows permanent job losers as a percent of the pre-recession peak in employment through the report today.
This data is only available back to 1994, so there is only data for three recessions.
In June, the number of permanent job losers declined to 1.273 million from 1.386 million in the previous month.
In June, the number of permanent job losers declined to 1.273 million from 1.386 million in the previous month.
These jobs were likely the hardest to recover, so it is a positive that there are fewer permanent job losers now than prior to the recession.
Prime (25 to 54 Years Old) Participation
 Since the overall participation rate has declined due to cyclical (recession) and demographic (aging population, younger people staying in school) reasons, here is the employment-population ratio for the key working age group: 25 to 54 years old.
The 25 to 54 participation rate decreased in June to 82.3% from 82.6% in May, and the 25 to 54 employment population ratio decreased to 79.8% from 80.0% the previous month.
Both are slightly below the pre-pandemic levels and indicate almost all of the prime age workers have returned to the labor force.
Part Time for Economic Reasons
 From the BLS report:
These workers are included in the alternate measure of labor underutilization (U-6) that decreased to 6.7% from 7.1% in the previous month. This is down from the record high in April 22.9% for this measure since 1994. This measure is lower than the 7.0% in February 2020 (pre-pandemic).
Unemployed over 26 Weeks
 This graph shows the number of workers unemployed for 27 weeks or more.
According to the BLS, there are 1.336 million workers who have been unemployed for more than 26 weeks and still want a job, down from 1.356 million the previous month.
This does not include all the people that left the labor force.
Summary:
The headline monthly jobs number was above expectations; however, the previous two months were revised down by 74,000 combined.
Part Time for Economic Reasons
 From the BLS report:
"The number of persons employed part time for economic reasons declined by 707,000 to 3.6 million in June and is below its February 2020 level of 4.4 million. These individuals, who would have preferred full-time employment, were working part time because their hours had been reduced or they were unable to find full-time jobs."The number of persons working part time for economic reasons decreased in June to 3.621 million from 4.328 million in May. This is below pre-recession levels.
These workers are included in the alternate measure of labor underutilization (U-6) that decreased to 6.7% from 7.1% in the previous month. This is down from the record high in April 22.9% for this measure since 1994. This measure is lower than the 7.0% in February 2020 (pre-pandemic).
Unemployed over 26 Weeks
 This graph shows the number of workers unemployed for 27 weeks or more.
 According to the BLS, there are 1.336 million workers who have been unemployed for more than 26 weeks and still want a job, down from 1.356 million the previous month.
This does not include all the people that left the labor force.
Summary:
The headline monthly jobs number was above expectations; however, the previous two months were revised down by 74,000 combined.
The headline unemployment rate was unchanged at 3.6%.
Look at these highlights:
• U-6 is below pre-recession levels, and the lowest level on record (started in 1994).
• There are now fewer permanent job losers than prior to the recession.
• There are fewer part time workers, for economic reasons, than prior to the recession.
However, there are still 524 thousand fewer jobs than prior to the recession.
Overall, this was another strong report.
June Employment Report: 372 thousand Jobs, 3.6% Unemployment Rate
by Calculated Risk on 7/08/2022 08:40:00 AM
From the BLS:
Total nonfarm payroll employment rose by 372,000 in June, and the unemployment rate remained at 3.6 percent, the U.S. Bureau of Labor Statistics reported today. Notable job gains occurred in professional and business services, leisure and hospitality, and health care.
...
The change in total nonfarm payroll employment for April was revised down by 68,000, from +436,000 to +368,000, and the change for May was revised down by 6,000, from +390,000 to +384,000. With these revisions, employment in April and May combined is 74,000 lower than previously reported.
emphasis added
 Click on graph for larger image.
The first graph shows the job losses from the start of the employment recession, in percentage terms.
The current employment recession was by far the worst recession since WWII in percentage terms.
However, 28 months after the onset of the current employment recession, almost all of the jobs have returned.
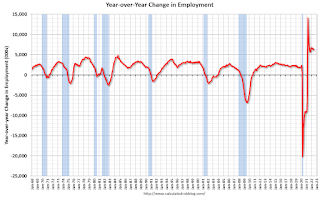 The second graph shows the year-over-year change in total non-farm employment since 1968.
In June, the year-over-year change was 6.3 million jobs. This was up significantly year-over-year.
Total payrolls increased by 372 thousand in June. Private payrolls increased by 381 thousand, and public payrolls decreased 9 thousand.
Payrolls for April and May were revised down 74 thousand, combined.
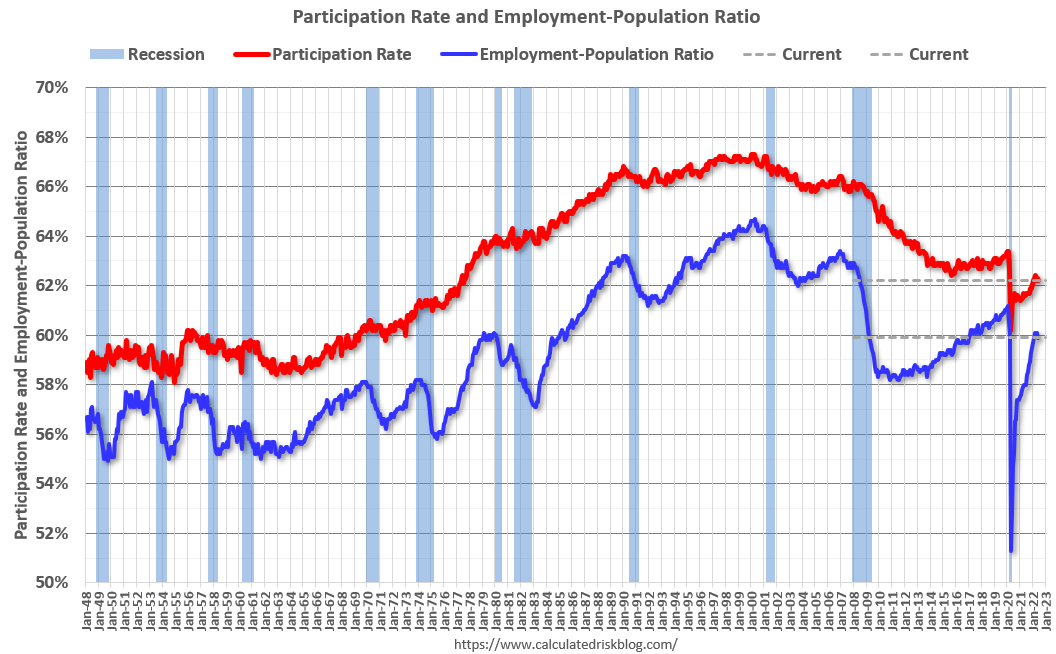
The third graph shows the employment population ratio and the participation rate.
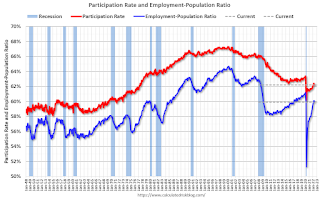 The Labor Force Participation Rate decreased to 62.2% in June, from 62.3% in May. This is the percentage of the working age population in the labor force.
The Employment-Population ratio decreased to 59.9% from 60.1% (blue line).
I'll post the 25 to 54 age group employment-population ratio graph later.
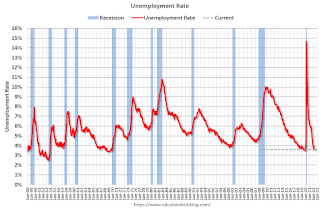 The fourth graph shows the unemployment rate.
The unemployment rate was unchanged in June at 3.6% from 3.6% in May.
This was above consensus expectations; however, April and May payrolls were revised down by 74,000 combined.
 The second graph shows the year-over-year change in total non-farm employment since 1968.
In June, the year-over-year change was 6.3 million jobs. This was up significantly year-over-year.
Total payrolls increased by 372 thousand in June. Private payrolls increased by 381 thousand, and public payrolls decreased 9 thousand.
Payrolls for April and May were revised down 74 thousand, combined.
The third graph shows the employment population ratio and the participation rate.
 The Labor Force Participation Rate decreased to 62.2% in June, from 62.3% in May. This is the percentage of the working age population in the labor force.
 The Employment-Population ratio decreased to 59.9% from 60.1% (blue line).
I'll post the 25 to 54 age group employment-population ratio graph later.
 The fourth graph shows the unemployment rate.
 The unemployment rate was unchanged in June at 3.6% from 3.6% in May.
This was above consensus expectations; however, April and May payrolls were revised down by 74,000 combined.
I'll have more later ...
Thursday, July 07, 2022
Friday: Employment Report
by Calculated Risk on 7/07/2022 09:11:00 PM
My June Employment Preview
Goldman June Payrolls Preview
Friday:
• At 8:30 AM ET, Employment Report for June. The consensus is for 270,000 jobs added, and for the unemployment rate to be unchanged at 3.6%
On COVID (focus on hospitalizations and deaths):
| COVID Metrics | ||||
|---|---|---|---|---|
| Now | Week Ago | Goal | ||
| Percent fully Vaccinated | 66.9% | --- | ≥70.0%1 | |
| Fully Vaccinated (millions) | 222.3 | --- | ≥2321 | |
| New Cases per Day3 | 106,549 | 110,875 | ≤5,0002 | |
| Hospitalized3🚩 | 28,891 | 26,959 | ≤3,0002 | |
| Deaths per Day3 | 273 | 345 | ≤502 | |
| 1 Minimum to achieve "herd immunity" (estimated between 70% and 85%). 2my goals to stop daily posts, 37-day average for Cases, Currently Hospitalized, and Deaths 🚩 Increasing 7-day average week-over-week for Cases, Hospitalized, and Deaths ✅ Goal met. | ||||
 Click on graph for larger image.
This graph shows the daily (columns) and 7-day average (line) of deaths reported.
Average daily deaths bottomed in July 2021 at 214 per day.
Goldman June Payrolls Preview
by Calculated Risk on 7/07/2022 03:48:00 PM
A few brief excerpts from a note by Goldman Sachs economist Spencer Hill:
We estimate nonfarm payrolls rose 250k in June ... employment surveys and Big Data employment indicators generally weakened in the month, and the Challenger report showed an increase in job cuts—particularly in real estate, autos, and media. ... We estimate an unchanged unemployment rate at 3.6%—in line with consensus—reflecting a solid rise in household employment offset by a 0.1pp rise in labor force participation to 62.4%.CR Note: The consensus is for 270 thousand jobs added, and for the unemployment rate to be unchanged at 3.6%.
emphasis added


