 RSS Feed
 by Calculated Risk on 12/30/2020 12:51:00 PM
Wednesday, December 30, 2020
Question #6 for 2021: Will the Fed raise rates in 2021? What about the asset purchase program?
Earlier I posted some questions for next year: Ten Economic Questions for 2021. I'm adding some thoughts, and maybe some predictions for each question.
6) Monetary Policy: The Fed cut rates to zero in 2020 in response to the pandemic, and has signaled they will be on hold for some time. Will the Fed raise rates in 2021? Will the Fed end - or taper - the asset purchase program?
In March, in response to the pandemic, the Fed cut rates to essentially zero:
"Effective March 23, 2020, the Federal Open Market Committee directs the Desk to undertake open market operations as necessary to maintain the federal funds rate in a target range of 0 to 1/4 percent."In addition, the Fed has been buying assets, from the December statement:
"the Federal Reserve will continue to increase its holdings of Treasury securities by at least $80 billion per month and of agency mortgage-backed securities by at least $40 billion per month until substantial further progress has been made toward the Committee's maximum employment and price stability goals."An important point: The Fed will look through any blip in inflation in 2021 (there will be some weird distortions in the numbers).
emphasis added
As of December, looking at the "dot plot", the FOMC participants see the following number of rate hikes in 2021 and 2022:
Clearly the main view of the FOMC is no change in policy in 2021.
Here are the Ten Economic Questions for 2021 and a few predictions:
• Question #1 for 2021: How much will the economy grow in 2021?
• Question #2 for 2021: Will all the jobs lost in 2020 return in 2021, or will job growth be sluggish?
• Question #3 for 2021: What will the unemployment rate be in December 2021?
• Question #4 for 2021: Will the overall participation rate increase to pre-pandemic levels (63.4% in February 2020) , or will it will only partially recover in 2021?
• Question #5 for 2021: Will the core inflation rate increase in 2021? Will too much inflation be a concern in 2021?
• Question #6 for 2021: Will the Fed raise rates in 2021? What about the asset purchase program?
• Question #7 for 2021: How much will RI increase in 2021? How about housing starts and new home sales in 2021?
• Question #8 for 2021: What will happen with house prices in 2021?
• Question #9 for 2021: Will inventory increase as the pandemic subsides, or will inventory decrease further in 2021?
• Question #10 for 2021: How much damage did the pandemic do to certain sectors?
| FOMC Members 2021 | FOMC Members 2022 | |
|---|---|---|
| No Change | 17 | 16 |
| One Rate Hike | 0 | 1 |
Clearly the main view of the FOMC is no change in policy in 2021.
As far as asset purchases, from Professor Tim Duy: Four Points to Know About the FOMC Meeting
the Fed explicitly intends to hold the size of purchase at or above the current pace until the Fed achieves clear further progress toward its economic objective. Note though that “further progress” is not complete progress. The Fed will pull back on the asset purchase program before raising interest rates. When and under what conditions? Powell declined to answer that question but did promise there would be advance notice. Look for that notice to begin next year if the economy looks to rebound strongly as expected by mid-2021.There will be no rate hike in 2021, and since I'm assuming the pandemic will subside by mid-year 2021, it seems likely the Fed will taper asset purchases sometime in the second half of 2021.
Here are the Ten Economic Questions for 2021 and a few predictions:
• Question #1 for 2021: How much will the economy grow in 2021?
• Question #2 for 2021: Will all the jobs lost in 2020 return in 2021, or will job growth be sluggish?
• Question #3 for 2021: What will the unemployment rate be in December 2021?
• Question #4 for 2021: Will the overall participation rate increase to pre-pandemic levels (63.4% in February 2020) , or will it will only partially recover in 2021?
• Question #5 for 2021: Will the core inflation rate increase in 2021? Will too much inflation be a concern in 2021?
• Question #6 for 2021: Will the Fed raise rates in 2021? What about the asset purchase program?
• Question #7 for 2021: How much will RI increase in 2021? How about housing starts and new home sales in 2021?
• Question #8 for 2021: What will happen with house prices in 2021?
• Question #9 for 2021: Will inventory increase as the pandemic subsides, or will inventory decrease further in 2021?
• Question #10 for 2021: How much damage did the pandemic do to certain sectors?
Question #7 for 2021: How much will RI increase in 2021? How about housing starts and new home sales in 2021?
by Calculated Risk on 12/30/2020 11:41:00 AM
Earlier I posted some questions for next year: Ten Economic Questions for 2021. I'm adding some thoughts, and maybe some predictions for each question.
7) Residential Investment: Residential investment (RI) was solid in 2020, and housing was a strong sector during the pandemic. Through November, starts were up 7.0% year-over-year compared to the same period in 2019. New home sales were up 19.1% year--to-date through November. Note: RI is mostly investment in new single family structures, multifamily structures, home improvement and commissions on existing home sales. How much will RI increase in 2021? How about housing starts and new home sales in 2021?
First a graph of RI as a percent of Gross Domestic Product (GDP) through Q3 2020:
 Click on graph for larger image.
Residential investment (RI) increased at a 59.3% annual rate in Q3. And RI, as percent of GDP, increased sharply in Q3.
We don't have the data yet for Q4 2020 yet, but it appears RI will make a strong contribution to GDP in 2020.
Note that RI as a percent of GDP is still fairly low and not far above the lows of previous recessions.
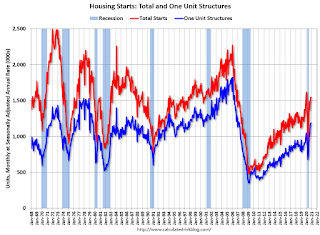 The second graph shows total and single family housing starts through November 2020.
Starts, year-to-date, are up 7.0% compared to the same period in 2019. Note that starts were up solidly prior to the pandemic, and then bounced back strong.
Even after the significant increase over the last several years, and the solid increase in 2020, the approximately 1.38 million housing starts in 2020 will still be the 34th highest on an annual basis since the Census Bureau started tracking starts in 1959 (34 out of 62 total years - middle of the pack).
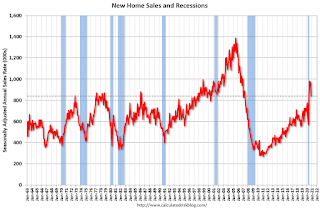 The third graph shows New Home Sales since 1963 through November 2020. The dashed line is the November sales rate.
New home sales in 2020, through November, were up 19.1% compared to the same period in 2019. This will be the strongest year for new home sales since 2006.
Clearly low mortgages rates, low existing home supply, and low sales in March and April (due to the pandemic) have led to a strong increase in sales. Favorable demographics and a surging stock market have probably helped new home sales too.
Here is a table showing housing starts and new home sales since 2005. No one should expect an increase to 2005 levels, however demographics and household formation suggest starts will increase further this cycle.
Most analysts are looking for starts and new home sales to increase further in 2021. For example, Fannie Mae expects new home sales to increase to 872 thousand, and the MBA is forecasting 960 thousand in 2021.
Here is a table showing housing starts and new home sales since 2005. No one should expect an increase to 2005 levels, however demographics and household formation suggest starts will increase further this cycle.
| Housing Starts and New Home Sales (000s) | ||||
|---|---|---|---|---|
| Housing Starts | Change | New Home Sales | Change | |
| 2005 | 2,068 | --- | 1,283 | --- |
| 2006 | 1,801 | -12.9% | 1,051 | -18.1% |
| 2007 | 1,355 | -24.8% | 776 | -26.2% |
| 2008 | 906 | -33.2% | 485 | -37.5% |
| 2009 | 554 | -38.8% | 375 | -22.7% |
| 2010 | 587 | 5.9% | 323 | -13.9% |
| 2011 | 609 | 3.7% | 306 | -5.3% |
| 2012 | 781 | 28.2% | 368 | 20.3% |
| 2013 | 925 | 18.5% | 429 | 16.6% |
| 2014 | 1,003 | 8.5% | 437 | 1.9% |
| 2015 | 1,112 | 10.8% | 501 | 14.6% |
| 2016 | 1,174 | 5.6% | 561 | 12.0% |
| 2017 | 1,203 | 2.5% | 613 | 9.3% |
| 2018 | 1,249 | 3.9% | 617 | 0.7% |
| 2019 | 1,290 | 3.2% | 683 | 10.7% |
| 20201 | 1,380 | 7.0% | 810 | 18.6% |
| 12020 estimated | ||||
Most analysts are looking for starts and new home sales to increase further in 2021. For example, Fannie Mae expects new home sales to increase to 872 thousand, and the MBA is forecasting 960 thousand in 2021.
And for housing starts, Fannie Mae is forecasting 1.44 million, and Merrill Lynch is forecasting 1.50 million.
Note that New Home sales have averaged 941 thousand over the last five months on seasonally adjust annual rate (SAAR) basis. So most forecasts are for sales to be relatively flat relative to the last five months.
Note that New Home sales have averaged 941 thousand over the last five months on seasonally adjust annual rate (SAAR) basis. So most forecasts are for sales to be relatively flat relative to the last five months.
And housing starts have averaged 1.47 million over the same period. So once again, analysts are expecting starts to be at about the same level in 2021 as the last 5 months.
My guess is starts will be up year-over-year in 2021 by high single digits. However, my guess is new home sales will soften in the second half of 2021 (based on my expectation of more existing home inventory), and will be up mid single digits (a decline from the sales rate over the last 5 months). It is even possible that sales will be flat to slightly down in 2021, but that will depend on inventory and the course of the pandemic.
Here are the Ten Economic Questions for 2021 and a few predictions:
• Question #1 for 2021: How much will the economy grow in 2021?
• Question #2 for 2021: Will all the jobs lost in 2020 return in 2021, or will job growth be sluggish?
• Question #3 for 2021: What will the unemployment rate be in December 2021?
• Question #4 for 2021: Will the overall participation rate increase to pre-pandemic levels (63.4% in February 2020) , or will it will only partially recover in 2021?
• Question #5 for 2021: Will the core inflation rate increase in 2021? Will too much inflation be a concern in 2021?
• Question #6 for 2021: Will the Fed raise rates in 2021? What about the asset purchase program?
• Question #7 for 2021: How much will RI increase in 2021? How about housing starts and new home sales in 2021?
• Question #8 for 2021: What will happen with house prices in 2021?
• Question #9 for 2021: Will inventory increase as the pandemic subsides, or will inventory decrease further in 2021?
• Question #10 for 2021: How much damage did the pandemic do to certain sectors?
NAR: Pending Home Sales Decrease 2.6% in November
by Calculated Risk on 12/30/2020 10:03:00 AM
From the NAR: Pending Home Sales Slide 2.6% in November
Pending home sales declined in November, according to the National Association of Realtors®. Month-over-month contract activity fell in each of the four major U.S. regions. However, compared to a year ago, all four areas achieved gains in pending home sales transactions.This was below expectations for this index. Note: Contract signings usually lead sales by about 45 to 60 days, so this would usually be for closed sales in December and January.
The Pending Home Sales Index (PHSI), a forward-looking indicator of home sales based on contract signings, fell 2.6% to 125.7 in November, the third straight month of decline. Year-over-year, contract signings climbed 16.4%. An index of 100 is equal to the level of contract activity in 2001.
...
The Northeast PHSI slid 3.3% to 108.6 in November, a 15.3% increase from a year ago. In the Midwest, the index fell 3.1% to 115.9 last month, up 14.1% from November 2019.
Pending home sales in the South decreased 1.1% to an index of 150.0 in November, up 21.3% from November 2019. The index in the West fell 4.7% in November to 111.3, which is up 10.4% from a year ago.
emphasis added
Tuesday, December 29, 2020
Wednesday: Pending Home Sales
by Calculated Risk on 12/29/2020 09:15:00 PM
Wednesday:
• At 9:45 AM ET, Chicago Purchasing Managers Index for December.
• At 10:00 AM, Pending Home Sales Index for November. The consensus is for a 0.2% increase in the index.
December 29 COVID-19 Test Results; Record Hospitalizations
by Calculated Risk on 12/29/2020 07:12:00 PM
Note: Expect a dip in the data over the holidays. The week-over-week growth in positive cases has slowed. Hopefully that continues after the holidays.
The US is now averaging close to 2 million tests per day. Based on the experience of other countries, for adequate test-and-trace (and isolation) to reduce infections, the percent positive needs to be under 5% (probably close to 1%), so the US has far too many daily cases - and percent positive - to do effective test-and-trace.
There were 1,236,471 test results reported over the last 24 hours.
There were 194,512 positive tests.
Almost 70,000 US deaths have been reported so far in December, far surpassing April as the deadliest month. See the graph on US Daily Deaths here.
 Click on graph for larger image.
This data is from the COVID Tracking Project.
The percent positive over the last 24 hours was 15.7% (red line is 7 day average). The percent positive is calculated by dividing positive results by total tests (including pending).
And check out COVID Act Now to see how each state is doing. (updated link to new site)
 The second graph shows the 7 day average of positive tests reported and daily hospitalizations.
• Record Hospitalizations
Zillow Case-Shiller House Price Forecast: "Nothing Short of Remarkable", 9.5% YoY in November
by Calculated Risk on 12/29/2020 02:55:00 PM
The Case-Shiller house price indexes for October were released today. Zillow forecasts Case-Shiller a month early, and I like to check the Zillow forecasts since they have been pretty close.
From Matthew Speakman at Zillow: October Case-Shiller Results & November Forecast: Nothing Short of Remarkable
The path of home prices in recent months has been nothing short of remarkable. In many places across the country, and in the nation overall, home prices are growing by some measures at their fastest pace in decades. Record low mortgage rates, a wave of households aging into homeownership and a limited number of homes for sale all combined to stoke competition for houses and placed consistent upward pressure on prices for the better part of the last calendar year. These factors appear likely to remain in place in the near term, and an incrementally improving economy should encourage more buyers to enter the market. Taken together, this torrid pace of home price appreciation appears primed to continue well into 2021.
...
Monthly growth in November as reported by Case-Shiller is expected to slow slightly from October in all three main indices, while annual growth is expected to accelerate across the board. S&P Dow Jones Indices is expected to release data for the November S&P CoreLogic Case-Shiller Indices on Tuesday, January 26.
emphasis added
 The Zillow forecast is for the year-over-year change for the Case-Shiller National index to be at 9.5% in November, up from 8.4% in October.
 The Zillow forecast is for the 20-City index to be up 8.9% YoY in November from 7.9% in October, and for the 10-City index to increase to be up 8.4% YoY compared to 7.5% YoY in October.
Real House Prices and Price-to-Rent Ratio in October
by Calculated Risk on 12/29/2020 12:05:00 PM
Here is the post earlier on Case-Shiller: Case-Shiller: National House Price Index increased 8.4% year-over-year in October
It has been over fourteen years since the bubble peak. In the Case-Shiller release today, the seasonally adjusted National Index (SA), was reported as being 24.3% above the previous bubble peak. However, in real terms, the National index (SA) is still about at the bubble peak (and historically there has been an upward slope to real house prices). The composite 20, in real terms, is still 8% below the bubble peak.
The year-over-year growth in prices increased to 8.4% nationally.
Usually people graph nominal house prices, but it is also important to look at prices in real terms (inflation adjusted). Case-Shiller and others report nominal house prices. As an example, if a house price was $200,000 in January 2000, the price would be close to $291,000 today adjusted for inflation (45%). That is why the second graph below is important - this shows "real" prices (adjusted for inflation).
Nominal House Prices
 The first graph shows the monthly Case-Shiller National Index SA, and the monthly Case-Shiller Composite 20 SA (through September) in nominal terms as reported.
In nominal terms, the Case-Shiller National index (SA) and the Case-Shiller Composite 20 Index (SA) are both at new all times highs (above the bubble peak).
Real House Prices
 The second graph shows the same two indexes in real terms (adjusted for inflation using CPI less Shelter). Note: some people use other inflation measures to adjust for real prices.
In real terms, the National index is back to the bubble peak, and the Composite 20 index is back to early 2005.
In real terms, house prices are at 2005 levels.
Note that inflation was negative for a few months earlier this year, and that boosted real prices.
Price-to-Rent
In October 2004, Fed economist John Krainer and researcher Chishen Wei wrote a Fed letter on price to rent ratios: House Prices and Fundamental Value. Kainer and Wei presented a price-to-rent ratio using the OFHEO house price index and the Owners' Equivalent Rent (OER) from the BLS.
 Here is a similar graph using the Case-Shiller National and Composite 20 House Price Indexes.
This graph shows the price to rent ratio (January 2000 = 1.0). The price-to-rent ratio had been moving mostly sideways, but picked up recently.
On a price-to-rent basis, the Case-Shiller National index is back to September 2004 levels, and the Composite 20 index is back to March 2004 levels.
In real terms, prices are back to 2005 levels, and the price-to-rent ratio is back to 2004.
Question #8 for 2021: What will happen with house prices in 2021?
by Calculated Risk on 12/29/2020 11:13:00 AM
Earlier I posted some questions for next year: Ten Economic Questions for 2021. I'm adding some thoughts, and maybe some predictions for each question.
8) House Prices: It appears house prices - as measured by the national repeat sales index (Case-Shiller, CoreLogic) - will be up around 8% to 9% in 2020. What will happen with house prices in 2021?
The following graph shows the year-over-year change through October 2020, in the seasonally adjusted Case-Shiller Composite 10, Composite 20 and National indices (the Composite 20 was started in January 2000).
 Click on graph for larger image.
The Composite 10 SA is up 7.5% compared to October 2019. The Composite 20 SA is up 7.9% year-over-year.
The National index SA is up 8.4% year-over-year. Other house price indexes have indicated similar gains (see table below).
The YoY price increases in 2020 were the strongest since 2013.
Although I mostly use Case-Shiller, I also follow several other price indexes. The following table shows the year-over-year change for several house prices indexes.
| Year-over-year Change for Various House Price Indexes | ||
|---|---|---|
| Index | Through | Increase |
| Case-Shiller Comp 20 | October | 7.9% |
| Case-Shiller National | October | 8.4% |
| CoreLogic | October | 7.3% |
| FHFA House Price Index | October | 10.2% |
There are a wide range of price forecasts for 2021, from around 2% YoY growth to as much as 10%.
Here was Zillow's comment today on Case-Shiller:
"Record low mortgage rates, a wave of households aging into homeownership and a limited number of homes for sale all combined to stoke competition for houses and placed consistent upward pressure on prices for the better part of the last calendar year. These factors appear likely to remain in place in the near term, and an incrementally improving economy should encourage more buyers to enter the market. Taken together, this torrid pace of home price appreciation appears primed to continue well into 2021."Inventories will probably increase, especially in the 2nd half of 2021, but will most likely still be somewhat low historically. Also, prices tend to have momentum, so unless mortgage rates increase sharply (unlikely) or inventories rise quicker than expected, we should expect further price increases in 2021. Watching inventory will be important to adjust this forecast!
My guess (based on my inventory forecast and a recovering economy) is that year-over-year price increases will probably be the strongest early in the year, and then soften somewhat towards the end of 2021. It seems likely that price appreciation will decrease from the 2020 pace, but still be in the mid-single digit range in 2021.
Here are the Ten Economic Questions for 2021 and a few predictions:
• Question #1 for 2021: How much will the economy grow in 2021?
• Question #2 for 2021: Will all the jobs lost in 2020 return in 2021, or will job growth be sluggish?
• Question #3 for 2021: What will the unemployment rate be in December 2021?
• Question #4 for 2021: Will the overall participation rate increase to pre-pandemic levels (63.4% in February 2020) , or will it will only partially recover in 2021?
• Question #5 for 2021: Will the core inflation rate increase in 2021? Will too much inflation be a concern in 2021?
• Question #6 for 2021: Will the Fed raise rates in 2021? What about the asset purchase program?
• Question #7 for 2021: How much will RI increase in 2021? How about housing starts and new home sales in 2021?
• Question #8 for 2021: What will happen with house prices in 2021?
• Question #9 for 2021: Will inventory increase as the pandemic subsides, or will inventory decrease further in 2021?
• Question #10 for 2021: How much damage did the pandemic do to certain sectors?
Case-Shiller: National House Price Index increased 8.4% year-over-year in October
by Calculated Risk on 12/29/2020 09:12:00 AM
S&P/Case-Shiller released the monthly Home Price Indices for October ("October" is a 3 month average of August, September and October prices).
This release includes prices for 20 individual cities, two composite indices (for 10 cities and 20 cities) and the monthly National index.
From S&P: S&P CoreLogic Case-Shiller Index Shows Annual Home Price Gains Soared to 7% in September
The S&P CoreLogic Case-Shiller U.S. National Home Price NSA Index, covering all nine U.S. census divisions, reported an 8.4% annual gain in October, up from 7.0% in the previous month. The 10-City Composite annual increase came in at 7.5%, up from 6.2% in the previous month. The 20-City Composite posted a 7.9% year-over-year gain, up from 6.6% in the previous month.
Phoenix, Seattle and San Diego continued to report the highest year-over-year gains among the 19 cities (excluding Detroit) in October. Phoenix led the way with a 12.7% year-over-year price increase, followed by Seattle with an 11.7% increase and San Diego with an 11.6% increase. All 19 cities reported higher price increases in the year ending October 2020 versus the year ending September 2020.
...
The National Index posted a 1.4% month-over-month increase, while the 10-City and 20-City Composites both posted increases of 1.4% and 1.3% respectively, before seasonal adjustment in October. After seasonal adjustment, the National Index posted a month-over-month increase of 1.7%, while the 10-City and 20-City Composites both posted increases of 1.6%. In October, all 19 cities (excluding Detroit) reported increases before and after seasonal adjustment.
“The surprising strength we noted in last month’s report continued into October’s home price data,” says Craig J. Lazzara, Managing Director and Global Head of Index Investment Strategy at S&P Dow Jones Indices. “The National Composite Index gained 8.4% relative to its level a year ago, accelerating from September’s 7.0% increase. The 10- and 20-City Composites (up 7.5% and 7.9%, respectively) also rose more rapidly in October than they had done in September. The housing market’s strength was once again broadly-based: all 19 cities for which we have October data rose, and all 19 gained more in the 12 months ended in October than they had gained in the 12 months ended in September.
“We’ve noted before that a trend of accelerating increases in the National Composite Index began in August 2019 but was interrupted in May and June, as COVID-related restrictions produced modestlydecelerating price gains. Since June, our monthly readings have shown accelerating growth in home prices, and October’s results emphatically emphasize that trend. The last time that the National Composite matched this month’s 8.4% growth rate was more than six and a half years ago, in March 2014. Although the full history of the pandemic’s impact on housing prices is yet to be written, the data from the last several months are consistent with the view that COVID has encouraged potential buyers to move from urban apartments to suburban homes. We’ll continue to monitor what the data can tell us about this question
emphasis added
 Click on graph for larger image.
 The first graph shows the nominal seasonally adjusted Composite 10, Composite 20 and National indices (the Composite 20 was started in January 2000).
The Composite 10 index is up 1.6% in October (SA) from September.
The Composite 20 index is up 1.6% (SA) in October.
The National index is 24.3% above the bubble peak (SA), and up 1.7% (SA) in October. The National index is up 68% from the post-bubble low set in December 2011 (SA).
The second graph shows the Year over year change in all three indices.The Composite 10 SA is up 7.5% compared to October 2019. The Composite 20 SA is up 7.9% year-over-year.
The National index SA is up 8.4% year-over-year.
Note: According to the data, prices increased in 19 cities month-over-month seasonally adjusted.
Price increases were above expectations. I'll have more later.
Monday, December 28, 2020
Tuesday: Case-Shiller House Prices
by Calculated Risk on 12/28/2020 09:11:00 PM
From Matthew Graham at Mortgage News Daily: MBS RECAP: Uneventful Day Despite Covid Relief Bill
The big news at the end of last week was Trump's decision to veto the covid relief/spending bill. After he signed it last night, overnight markets began pointing toward higher rates. 10yr yields were roughly 3bps higher to start the day, but it was all downhill from there (in a good way). MBS led the charge early. Treasuries ultimately broke even ... [30 Year Mortgage Rate for Top Tier Scenarios: 2.79%].Tuesday:
emphasis added
• At 9:00 AM ET, S&P/Case-Shiller House Price Index for October. The consensus is for a 7.2% year-over-year increase in the National index for October. Note that Zillow is forecasting Case-Shiller will report a 7.7% YoY increase in the National index.

In Memoriam: Doris "Tanta" Dungey


| Privacy Policy |
| Copyright © 2007 - 2025 CR4RE LLC |
| Excerpts NOT allowed on x.com |