 RSS Feed
 by Calculated Risk on 12/26/2019 09:02:00 AM
Thursday, December 26, 2019
Weekly Initial Unemployment Claims decreased to 222,000
The DOL reported:
In the week ending December 21, the advance figure for seasonally adjusted initial claims was 222,000, a decrease of 13,000 from the previous week's revised level. The previous week's level was revised up by 1,000 from 234,000 to 235,000. The 4-week moving average was 228,000, an increase of 2,250 from the previous week's revised average. The previous week's average was revised up by 250 from 225,500 to 225,750.The previous week was revised up.
emphasis added
The following graph shows the 4-week moving average of weekly claims since 1971.
 Click on graph for larger image.
The dashed line on the graph is the current 4-week average. The four-week average of weekly unemployment claims increased to 228,000.
This was close to the consensus forecast.
MBA: Mortgage Applications Decreased in Latest Weekly Survey
by Calculated Risk on 12/26/2019 07:00:00 AM
From the MBA: Mortgage Applications Decrease in Latest MBA Weekly Survey
Mortgage applications decreased 5.3 percent from one week earlier, according to data from the Mortgage Bankers Association’s (MBA) Weekly Mortgage Applications Survey for the week ending December 20, 2019.
... The Refinance Index decreased 5 percent from the previous week and was 128 percent higher than the same week one year ago. The seasonally adjusted Purchase Index decreased 5 percent from one week earlier. The unadjusted Purchase Index decreased 7 percent compared with the previous week and was 5 percent higher than the same week one year ago.
...
“The 10-Year Treasury yield increased last week amid signs of stronger homebuilding activity and solid consumer spending, leading to a rise in conventional conforming and jumbo 30-year mortgage rates to just under 4 percent. With this increase, conventional refinance application volume fell 11 percent,” said Mike Fratantoni, MBA Senior Vice President and Chief Economist. “Refinance applications for government loans did increase, even though rates on FHA loans picked up. The change in the mix of business has kept the average refinance loan size smaller than we had seen earlier this year.”
Added Fratantoni, “We are in the slowest time of the year for the purchase market. Purchase application activity declined after the seasonal adjustment, but still remains about 5 percent ahead of last year’s pace. The increase in construction activity will bolster housing inventories, which should be a positive for purchase volumes going into 2020.”
...
The average contract interest rate for 30-year fixed-rate mortgages with conforming loan balances ($484,350 or less) increased to 3.99 percent from 3.98 percent, with points remaining unchanged at 0.33 (including the origination fee) for 80 percent loan-to-value ratio (LTV) loans.
emphasis added
 Click on graph for larger image.
The first graph shows the refinance index since 1990.
With lower rates, we saw a sharp increase in refinance activity, but mortgage rates would have to decline further to see a huge refinance boom.
 The second graph shows the MBA mortgage purchase index
According to the MBA, purchase activity is up 5% year-over-year.
Wednesday, December 25, 2019
Merry Christmas and Happy Holidays!
by Calculated Risk on 12/25/2019 06:26:00 PM
Merry Christmas and Happy Holidays!
Thursday:
• At 7:00 AM ET, The Mortgage Bankers Association (MBA) will release the results for the mortgage purchase applications index.
• 8:30 AM, The initial weekly unemployment claims report will be released. The consensus is for 220,000 initial claims, down from 234,000 last week.
Tuesday, December 24, 2019
Question #10 for 2020: Will housing inventory increase or decrease in 2020?
by Calculated Risk on 12/24/2019 12:41:00 PM
Earlier I posted some questions for next year: Ten Economic Questions for 2020. I'm adding some thoughts, and maybe some predictions for each question.
10) Housing Inventory: Housing inventory decreased in 2019 after increasing in 2018. Will inventory increase or decrease in 2020?
Tracking housing inventory is very helpful in understanding the housing market. The plunge in inventory in 2011 helped me call the bottom for house prices in early 2012 (The Housing Bottom is Here). And the increase in inventory in late 2005 (see red arrow on first graph below) helped me call the top for house prices in 2006.
Earlier in 2019, when several commentators were bearish on housing, I pointed out there was no sharp increase in housing inventory (like in 2005), and that was one of the reasons I remained optimistic on housing and the economy (correctly!).
This graph shows nationwide inventory for existing homes through November 2019.
 Click on graph for larger image.
According to the NAR, inventory decreased to 1.64 million in November from 1.77 million in October. And inventory in November was down from 1.74 million in November 2018.
Inventory is not seasonally adjusted, and usually inventory decreases from the seasonal high in mid-summer to the seasonal lows in December and January as sellers take their homes off the market for the holidays.
Note that inventory is at about the same level as in November 2017, and still 20% below the levels for November 2014 and 2015.
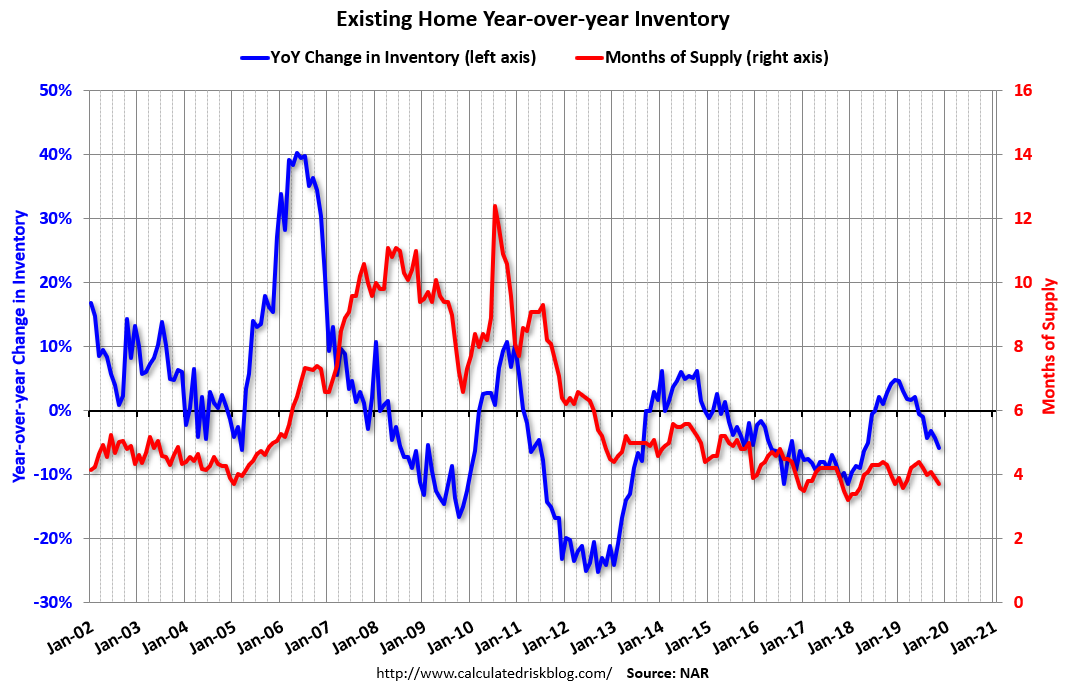 The second graph shows the year-over-year (YoY) change in reported existing home inventory and months-of-supply. Note: Months-of-supply is based on the seasonally adjusted sales and not seasonally adjusted inventory.
Inventory was down 5.7% year-over-year in November compared to November 2018. Months of supply decreased to 3.7 months in November.
Housing inventory increased YoY in 2018 due to a combination of higher mortgage rates and the new tax law. With lower mortgage rates, inventory decreased YoY at the end of 2019.
Inventory is always something to watch. If inventory increases sharply, house price growth will slow, and if inventory drops sharply, house price growth will pickup.
Since I don't expect any change in fiscal policy during an election year, and monetary policy appears to be on hold - and I don't expect either a strong pickup in the economy (and higher rates) or an economic slump - it seems likely inventory will remain at about the same level through 2020.
Here are the Ten Economic Questions for 2020 and a few predictions:
• Question #1 for 2020: How much will the economy grow in 2020?
• Question #2 for 2020: Will job creation in 2020 be as strong as in 2019?
• Question #3 for 2020: What will the unemployment rate be in December 2020?
• Question #4 for 2020: Will the overall participation rate start declining in 2020, or will it move more sideways (or slightly up) in 2020?
• Question #5 for 2020: How much will wages increase in 2020?
• Question #6 for 2020: Will the core inflation rate rise in 2020? Will too much inflation be a concern in 2020?
• Question #7 for 2020: Will the Fed cut or raise rates in 2020, and if so, by how much?
• Question #8 for 2020: How much will RI increase in 2020? How about housing starts and new home sales in 2020?
• Question #9 for 2020: What will happen with house prices in 2020?
• Question #10 for 2020: Will housing inventory increase or decrease in 2020?
"Chemical Activity Barometer Is Stable In December"
by Calculated Risk on 12/24/2019 10:50:00 AM
Note: This appears to be a leading indicator for industrial production.
From the American Chemistry Council: CChemical Activity Barometer Is Stable In December
The Chemical Activity Barometer (CAB), a leading economic indicator created by the American Chemistry Council (ACC), was stable (0.0 percent change) in December on a three-month moving average (3MMA) basis following a 0.1 percent gain in November. On a year-over-year (Y/Y) basis, the barometer rose 0.4 percent (3MMA) and follows two months of negative year-earlier comparisons.
...
“The CAB signals slow gains in U.S. commerce into the third quarter of 2020,” said Kevin Swift, chief economist at ACC.
...
Applying the CAB back to 1912, it has been shown to provide a lead of two to fourteen months, with an average lead of eight months at cycle peaks as determined by the National Bureau of Economic Research. The median lead was also eight months. At business cycle troughs, the CAB leads by one to seven months, with an average lead of four months. The median lead was three months. The CAB is rebased to the average lead (in months) of an average 100 in the base year (the year 2012 was used) of a reference time series. The latter is the Federal Reserve’s Industrial Production Index.
emphasis added
 Click on graph for larger image.
This graph shows the year-over-year change in the 3-month moving average for the Chemical Activity Barometer compared to Industrial Production. It does appear that CAB (red) generally leads Industrial Production (blue).
The year-over-year change in the CAB suggests that the YoY change in industrial production might be near a short term bottom, but suggests "slow gains into the third quarter of 2020".
Richmond Fed: Manufacturing Activity Slowed in December
by Calculated Risk on 12/24/2019 10:02:00 AM
From the Richmond Fed: Manufacturing Activity Slowed in December
Fifth District manufacturing activity slowed in December, according to the most recent survey from the Federal Reserve Bank of Richmond. The composite index fell from −1 in November to −5 in December, weighed down by decreases in the already negative indexes for shipments and new orders, while the third component — employment — increased slightly. Manufacturers also reported weakness in local business conditions and capacity utilization, but they were optimistic that conditions would improve in the coming months.Another weak regional report. The Dallas Fed will report next week.
Many firms saw growth in employment and wages in December. However, respondents reported declines in the average workweek, as this index decreased to −15, its lowest reading since April 2009. Manufacturers continued to report difficulty finding workers with the necessary skills and expected that struggle to continue in the next six months.
emphasis added
Monday, December 23, 2019
Freddie Mac: Mortgage Serious Delinquency Rate increased slightly in November
by Calculated Risk on 12/23/2019 06:39:00 PM
Freddie Mac reported that the Single-Family serious delinquency rate in November was 0.62%, up from 0.61% in October. Freddie's rate is down from 0.70% in November 2018.
Freddie's serious delinquency rate peaked in February 2010 at 4.20%.
These are mortgage loans that are "three monthly payments or more past due or in foreclosure".
 Click on graph for larger image
I expect the delinquency rate to decline to a cycle bottom in the 0.4% to 0.6% range - so this is close to a bottom.
Note: Fannie Mae will report for November soon.
Ten Economic Questions for 2020
by Calculated Risk on 12/23/2019 02:10:00 PM
Here is a review of the Ten Economic Questions for 2019
Below are my ten questions for 2020 I'll follow up with some thoughts on each of these questions.
The purpose of these questions is to provide a framework to think about how the U.S. economy will perform in 2020 and - when there are surprises - to adjust my thinking.
1) Economic growth: Economic growth was probably just over 2% in 2019, down from 2.9% in 2018. The FOMC is expecting more of the same with growth around 1.9% next year. Some analysts are expecting growth to pick up a little in the coming year as the trade war eases and global growth increases. How much will the economy grow in 2020?
2) Employment: Through November 2019, the economy added 1,969,000 jobs, or 179,000 per month. This was down from 2018. Will job creation in 2020 be as strong as in 2019? Will job creation pick up in 2020? Or will job creation slow further in 2020?
3) Unemployment Rate: The unemployment rate was at 3.5% in November, down 0.2 percentage points year-over-year. Currently the FOMC is forecasting the unemployment rate will be in the 3.5% to 3.7% range in Q4 2020. What will the unemployment rate be in December 2020?
4) Participation Rate: In November 2020, the overall participation rate was at 63.2%, up slightly year-over-year from 62.9% in November 2019. The BLS is projecting the overall participation rate will decline to 61.2% by 2028. Will the overall participation rate start declining in 2020, or will it move more sideways (or slightly up) in 2020?
5) Real Wage Growth: Wage growth was disappointing in 2019 (up 3.1% year-over-year as of November). How much will wages increase in 2020?
6) Inflation: By some measures, inflation rate has increased and is now slightly above the Fed's 2% target. However core PCE was only up 1.6% YoY through November. Will the core inflation rate rise in 2020? Will too much inflation be a concern in 2020?
7) Monetary Policy: The Fed cut rates three times in 2019. Currently the Fed is forecasting a long pause in 2020 (no change to policy). Will the Fed cut or raise rates in 2020, and if so, by how much?
8) Residential Investment: Residential investment (RI) picked up in the second half of 2019, and new home sales were up about 10% in 2019 compared to 2018. Note: RI is mostly investment in new single family structures, multifamily structures, home improvement and commissions on existing home sales. How much will RI increase in 2020? How about housing starts and new home sales in 2020?
9) House Prices: It appears house prices - as measured by the national repeat sales index (Case-Shiller, CoreLogic) - will be up around 3.5% in 2019, down from close to 5% YoY in November 2018. What will happen with house prices in 2020?
10) Housing Inventory: Housing inventory decreased in 2019 after increasing in 2018. Will inventory increase or decrease in 2020?
There are other important questions, such as oil prices, but these are the ones I'm focused on right now. I'll write on each of these questions over the next couple of weeks.
• Question #1 for 2020: How much will the economy grow in 2020?
• Question #2 for 2020: Will job creation in 2020 be as strong as in 2019?
• Question #3 for 2020: What will the unemployment rate be in December 2020?
• Question #4 for 2020: Will the overall participation rate start declining in 2020, or will it move more sideways (or slightly up) in 2020?
• Question #5 for 2020: How much will wages increase in 2020?
• Question #6 for 2020: Will the core inflation rate rise in 2020? Will too much inflation be a concern in 2020?
• Question #7 for 2020: Will the Fed cut or raise rates in 2020, and if so, by how much?
• Question #8 for 2020: How much will RI increase in 2020? How about housing starts and new home sales in 2020?
• Question #9 for 2020: What will happen with house prices in 2020?
• Question #10 for 2020: Will housing inventory increase or decrease in 2020?
A few Comments on November New Home Sales
by Calculated Risk on 12/23/2019 11:34:00 AM
New home sales for November were reported at 719,000 on a seasonally adjusted annual rate basis (SAAR). Sales for the previous three months were revised down, combined.
Sales were above 700 thousand SAAR for four consecutive months, and in five of the last six months - the best six month stretch since 2007.
Annual sales in 2019 will be the best year for new home sales since 2007.
Earlier: New Home Sales at 719,000 Annual Rate in November.
 Click on graph for larger image.
This graph shows new home sales for 2018 and 2019 by month (Seasonally Adjusted Annual Rate).
Sales in November were up 16.9% year-over-year compared to November 2018.
Year-to-date (through November), sales are up 9.8% compared to the same period in 2018.
The comparison for December is easy, so sales will likely be up double digits in 2019 compared to 2018 - a solid year for new home sales.
And here is another update to the "distressing gap" graph that I first started posting a number of years ago to show the emerging gap caused by distressed sales.
 The "distressing gap" graph shows existing home sales (left axis) and new home sales (right axis) through November 2019. This graph starts in 1994, but the relationship had been fairly steady back to the '60s.
Following the housing bubble and bust, the "distressing gap" appeared mostly because of distressed sales.
Even though distressed sales are down significantly, following the bust, new home builders focused on more expensive homes - so the gap closed slowly.
Now the gap is mostly closed, and I expect it to close a little more. However, this assumes that the builders will offer some smaller, less expensive homes.
 Another way to look at this is a ratio of existing to new home sales.
This ratio was fairly stable from 1994 through 2006, and then the flood of distressed sales kept the number of existing home sales elevated and depressed new home sales. (Note: This ratio was fairly stable back to the early '70s, but I only have annual data for the earlier years).
In general the ratio has been trending down since the housing bust - and is getting close to the historical ratio - and I expect this ratio will trend down a little more.
Note: Existing home sales are counted when transactions are closed, and new home sales are counted when contracts are signed. So the timing of sales is different.
New Home Sales at 719,000 Annual Rate in November
by Calculated Risk on 12/23/2019 10:15:00 AM
The Census Bureau reports New Home Sales in November were at a seasonally adjusted annual rate (SAAR) of 719 thousand.
The previous three months were revised down, combined.
"Sales of new single‐family houses in November 2019 were at a seasonally adjusted annual rate of 719,000, according to estimates released jointly today by the U.S. Census Bureau and the Department of Housing and Urban Development. This is 1.3 percent above the revised October rate of 710,000 and is 16.9 percent above the November 2018 estimate of 615,000."
emphasis added
 Click on graph for larger image.
The first graph shows New Home Sales vs. recessions since 1963. The dashed line is the current sales rate.
Even with the increase in sales over the last several years, new home sales are still somewhat low historically.
The second graph shows New Home Months of Supply.
 The months of supply decreased in November to 5.4 months from 5.5 months in October.
 The all time record was 12.1 months of supply in January 2009.
This is in the normal range (less than 6 months supply is normal).
"The seasonally‐adjusted estimate of new houses for sale at the end of November was 323,000. This represents a supply of 5.4 months at the current sales rate. "
 On inventory, according to the Census Bureau:
 "A house is considered for sale when a permit to build has been issued in permit-issuing places or work has begun on the footings or foundation in nonpermit areas and a sales contract has not been signed nor a deposit accepted."Starting in 1973 the Census Bureau broke this down into three categories: Not Started, Under Construction, and Completed.
The third graph shows the three categories of inventory starting in 1973.
The inventory of completed homes for sale is still somewhat low, and the combined total of completed and under construction is close to normal.
 The last graph shows sales NSA (monthly sales, not seasonally adjusted annual rate).
In November 2019 (red column), 52 thousand new homes were sold (NSA). Last year, 44 thousand homes were sold in November.
The all time high for November was 86 thousand in 2005, and the all time low for November was 20 thousand in 2010.
This was below expectations of 735 thousand sales SAAR, and sales in the three previous months were revised down, combined. However this was still solid with sales up 16.9% year-over-year. I'll have more later today.


