 RSS Feed
 by Calculated Risk on 2/09/2019 08:11:00 AM
Saturday, February 09, 2019
Schedule for Week of February 10, 2019
The key reports this week are January CPI and December retail sales.
For manufacturing, the January Industrial Production report and the February NY Fed manufacturing survey will be released.
No major economic releases scheduled.
6:00 AM ET: NFIB Small Business Optimism Index for January.
 10:00 AM ET: Job Openings and Labor Turnover Survey for December from the BLS.
 This graph shows job openings (yellow line), hires (purple), Layoff, Discharges and other (red column), and Quits (light blue column) from the JOLTS.
Jobs openings decreased in November to 6.888 million from 7.131 million in October.
The number of job openings (yellow) were up 16% year-over-year, and Quits were up 7% year-over-year.
11:00 AM: NY Fed: Q4 Quarterly Report on Household Debt and Credit
12:45 PM: Speech by Fed Chair Jerome Powell, Economic Development in High Poverty Rural Communities, At the Hope Enterprise Corporation Rural Policy Forum, Itta Bena, Miss.
7:00 AM ET: The Mortgage Bankers Association (MBA) will release the results for the mortgage purchase applications index.
8:30 AM: The Consumer Price Index for January from the BLS. The consensus is for 0.1% increase in CPI, and a 0.2% increase in core CPI.
8:30 AM: The initial weekly unemployment claims report will be released. The consensus is for 225 thousand initial claims, down from 234 thousand the previous week.
8:30 AM: The Producer Price Index for January from the BLS. The consensus is for a 0.2% increase in PPI, and a 0.2% increase in core PPI.
 8:30 AM: Retail sales for December is scheduled to be released. The consensus is for a 0.1% increase in retail sales.
This graph shows the year-over-year change in retail sales and food service (ex-gasoline) since 1993. Retail and Food service sales, ex-gasoline, increased by 3.6% on a YoY basis.
8:30 AM: The New York Fed Empire State manufacturing survey for February. The consensus is for a reading of 7.0, up from 3.9.
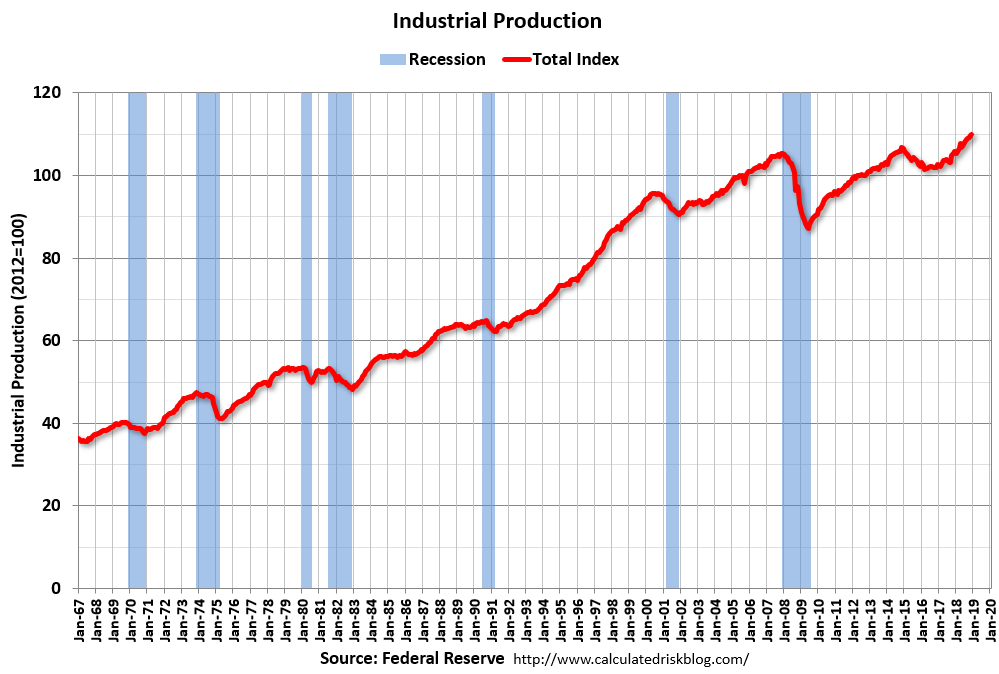 9:15 AM: The Fed will release Industrial Production and Capacity Utilization for January.
This graph shows industrial production since 1967.
The consensus is for a 0.2% increase in Industrial Production, and for Capacity Utilization to increase to 78.8%.
10:00 AM: University of Michigan's Consumer sentiment index (Preliminary for February). The consensus is for a reading of 92.5.
Friday, February 08, 2019
Q4 GDP Forecasts: Mid-2s
by Calculated Risk on 2/08/2019 04:09:00 PM
The BEA has announced that the Q4 advanced GDP report will be combined with the 2nd estimate of GDP, and will be released on Feb 28th.
From Merrill Lynch:
Better than expected trade data were offset by soft manufacturing inventories data, leaving our 4Q tracking estimate unchanged at 2.3%. [Feb 8 estimate]From the NY Fed Nowcasting Report
emphasis added
The New York Fed Staff Nowcast stands at 2.4% for 2018:Q4 and 2.2% for 2019:Q1. [Feb 8 estimate]And from the Altanta Fed: GDPNow
The GDPNow model estimate for real GDP growth (seasonally adjusted annual rate) in the fourth quarter of 2018 is 2.7 percent on February 6, up from 2.5 percent on February 1. [Feb 6 estimate]CR Note: These estimates suggest GDP in the mid 2s for Q4.
AAR: January Rail Carloads up 1.7% YoY, Intermodal Up 0.5% YoY
by Calculated Risk on 2/08/2019 10:32:00 AM
From the Association of American Railroads (AAR) Rail Time Indicators. Graphs and excerpts reprinted with permission.
Total U.S. rail carloads were up 1.7%, or 21,054 carloads, in January 2019 over January 2018, while U.S. intermodal volume was up 0.5%, or 6,008 containers and trailers. You can split the five weeks of January 2019 into two parts. In weeks 1-3, total carloads were up 8.1% over last year and intermodal was up 5.7%. In weeks 4-5, though, carloads were down 6.6% (including an 8.4% decline in week 5) and intermodal was down 6.5% (including a 9.6% decline in week 5). Clearly, harsh weather at the end of January hurt rail traffic.
emphasis added
 Click on graph for larger image.
This graph from the Rail Time Indicators report shows U.S. average weekly rail carloads (NSA). Red is 2019.
Rail carloads have been weak over the last decade due to the decline in coal shipments.
U.S. railroads (excluding the U.S. operations of Canadian railroads) originated 1.238 million carloads in January 2019, up 1.7%, or 21,054 carloads, over January 2018. Weekly average total carloads in January 2019 were 247,697, the fewest for any month since January 2018.
In terms of rail carloads, January (which consists of weeks 1-5) had two parts. For weeks 1-3, total carloads were up 8.1% this year over last year. For weeks 4-5, though, they were down 6.6%. The extreme cold this year at the end of January in many parts of the country limited rail operations substantially, though it’s impossible to precisely calculate what carloads would have been if weather had been more normal.
 The second graph is for intermodal traffic (using intermodal or shipping containers):
In addition to carloads, U.S. railroads originated 1.316 million containers and trailers in January 2019, up 0.5% over January 2018. Weekly average intermodal volume in January 2019 was 263,234 units, the most ever for January.Traffic in 2019 was off to a strong start, but then declined sharply due to the weather. AAR expects some "make-up volume" in February.
Like carloads, intermodal suffered from the weather. In the first three weeks of 2019, intermodal volume was up 5.7% over last year; weeks 2 and 3 this year were the highest-volume intermodal weeks in January in history for U.S. railroads. In weeks 4-5, though, intermodal was down 6.5% this year over last year, including a 9.6% decline in week 5, when weather was especially cold in much of the country. Again, it’s not possibly to precisely quantify the impact, but it’s reasonable to expect some make-up volume in February.
Seattle Real Estate in January: Sales Unchanged YoY, Inventory up 168% YoY from Low Levels
by Calculated Risk on 2/08/2019 10:16:00 AM
The Northwest Multiple Listing Service reported Homebuyers resuming search amid improving inventory, attractive terms
KIRKLAND, Washington (February 7, 2019) - Home buyers around Washington state are making their way back to the market, hoping to take advantage of improving inventory, attractive interest rates, and more approachable sellers, according to officials with Northwest Multiple Listing Service.The press release is for the Northwest. In King County, sales were down 3.7% year-over-year, and active inventory was up 144% year-over-year.
Northwest MLS statistics for January show year-over-year improvement in the volume of new listings and total inventory, along with moderating selling prices. Although fewer pending sales (mutually accepted offers) were reported than a year ago (down about 3.3 percent), January was the smallest year-over-year decline since May 2018 when the drop was about 2.7 percent.
Commenting on the MLS statistics summarizing last month's activity, broker Gary O'Leyar said January's post-holiday real estate activity doesn't normally pick up until later in the month, but this year the uptick began early. "January started as a bit of a surprise. Open house activity was very robust, and we saw multiple offers in numerous instances again," reported O'Leyar, the owner of Berkshire Hathaway HomeServices Signature Properties in Seattle.
MLS members added 7,090 new listings of single family homes and condos during January, up from the year-ago figure of 6,805 and nearly doubling December's total of 3,631. At month end there were 11,687 active listings in the database, up more than 45 percent from the year-ago total of 8,037. Listing inventory more than doubled in both King and Snohomish counties.
emphasis added
In Seattle, sales were unchanged year-over-year, and inventory was up 168% year-over-year from very low levels. This is another market with inventory increasing sharply year-over-year, but months-of-supply in Seattle is still on the low side at 2.4 months.
Thursday, February 07, 2019
Employment: January Diffusion Indexes
by Calculated Risk on 2/07/2019 01:32:00 PM
I haven't posted this in a few months.
The BLS diffusion index for total private employment was at 61.0 in January, down from 66.3 in December.
For manufacturing, the diffusion index was at 59.9, down from 63.2 in December.
Note: Any reading above 60 is very good.
Think of this as a measure of how widespread job gains are across industries. The further from 50 (above or below), the more widespread the job losses or gains reported by the BLS. From the BLS:
Figures are the percent of industries with employment increasing plus one-half of the industries with unchanged employment, where 50 percent indicates an equal balance between industries with increasing and decreasing employment.
 Overall both total private and manufacturing job growth was widespread again in January.
A few Tips on Business Cycle Forecasting
by Calculated Risk on 2/07/2019 09:46:00 AM
Because of my track record, I'm frequently asked about forecasting methods, my current views and what models I use. So here are a few tips.
First, why should someone care about the business cycle? If you are in a cyclical industry, forecasting is helpful with planning. Of course, if you forecast wrong - as people frequently do - then a company might hold back on investments and miss out on some opportunities. Another possible reason to forecast the business cycle is to improve investing performance. If someone could predict recessions and recoveries with reasonable accuracy, they could significantly improve their returns - but, once again, the track record for forecasters is pretty poor. Also forecasting is important for policymakers too (but most of us aren't policymakers).
I've successfully used forecasting as part of a cyclical business planning and also for my own investing. But it only helps if you are correct - so I don't recommend it for most investors - in general, for investing, it is better to just ride out the downturns then to try to time the business cycle. As an example, imagine if you had used ECRI forecasts for investing. You would have been late selling prior to the 2007 recession, and you would have missed a large percentage of the 2009 - 2019 bull market. Not a good result.
Second, many forecasters have an agenda, so be careful. For example, many newsletter writers and bloggers make frequent bearish forecasts. Perhaps they really believe their forecasts, or perhaps they are blinded by the incentives since being bearish garners publicity (and generates clicks and newsletter subscriptions).
Tip #1: Don't bother forecasting the business cycle (for most people). And don't rely on me - I could miss the next down turn (although I'll try to forecast the next recession).
If you are still reading, rely on history. Any reasonably intelligent person can almost always make a cogent argument that a recession is imminent. And yet, most of the time the economy is in expansion and stocks are in a bull market. This means forecasters have to fight through the tendency to be bearish. The economy and market don't care that you have a strong argument for a recession. Expansion is the norm.
Tip #2: Have a bias towards expansion.
Many forecasters start with the results of a model, and then based on the model, start warning that the sky is falling. A recent example was the focus on the yield curve inverting late last year.
This is backwards. My view is a forecaster should start with a story. For example, the Fed is overtightening, or the stock bubble burst will lead to less business investment, or the housing bust will lead to a collapse in the residential investment and a financial crisis. Those were some key stories prior to previous recessions.
Examples of possible stories now: If the Fed kept raising 25 bps a quarter (like last year), maybe rates would be too tight later this year or next year - and a recession might follow. But that doesn't seem to be the current course. Another possible story is the trade war might lead the economy into recession (but the negative impact doesn't seem large enough). Or perhaps the huge fiscal deficit - due to the new tax policy - will lead to much higher rates. Or there is too much corporate debt … and on and on.
This is why I track so many pieces of economic data - it helps me think about possible stories. And when data surprises, I try to take a closer look.
As I noted above, it is always possible to make an argument that a recession is coming, but it is usually wrong.
Tip #3: Start with a story (and try to see if the story makes sense - and the impact large enough to derail the expansion).
When a story makes sense, then it is time to start looking at some leading models. My favorite model uses residential investment as a leading indicator (not perfect, but pretty good). I also follow the yield curve (but it isn't currently as useful in a low interest rate environment).
When I'm on recession watch (due to a strong story and some modeling), then I start looking at some coincident indicators and models that are useful in timing a recession. For example, I start looking at unemployment claims, and some models based on the work of Hamilton, Chauvet, Piger and others.
Tip #4: Use models, but don't be a slave to the models.
Currently I'm not on recession watch. But I could be wrong!
Weekly Initial Unemployment Claims decreased to 234,000
by Calculated Risk on 2/07/2019 08:34:00 AM
The DOL reported:
In the week ending February 2, the advance figure for seasonally adjusted initial claims was 234,000, a decrease of 19,000 from the previous week's unrevised level of 253,000. The 4-week moving average was 224,750, an increase of 4,500 from the previous week's unrevised average of 220,250.The previous week was unrevised.
emphasis added
The following graph shows the 4-week moving average of weekly claims since 1971.
 Click on graph for larger image.
The dashed line on the graph is the current 4-week average. The four-week average of weekly unemployment claims increased to 224,750.
This was higher than the consensus forecast.
Wednesday, February 06, 2019
Thursday: Unemployment Claims
by Calculated Risk on 2/06/2019 08:58:00 PM
Thursday:
• At 8:30 AM ET, The initial weekly unemployment claims report will be released. The consensus is for 225 thousand initial claims, down from 253 thousand the previous week.
• At 3:00 PM, Consumer Credit from the Federal Reserve.
BEA: Q4 GDP to be Released Feb 28th, And Census Update
by Calculated Risk on 2/06/2019 02:58:00 PM
From the BEA: New Dates Set for GDP, Personal Income, and International Trade
Bureau of Economic Analysis data on U.S. gross domestic product, personal income and outlays, and international trade in goods and services that were delayed by the recent lapse in federal funding will be released in late February and early March.CR Note: It appears Q4 GDP will be in the mid-2s. Unfortunately it takes some time to catch up on the data releases.
A report called Initial Gross Domestic Product for the 4th Quarter and Annual 2018 will be released on Feb. 28 at 8:30 a.m. This “initial” report will take the place of two previously scheduled estimates of 4th quarter GDP – the advance estimate originally set for Jan. 30 and the second estimate that would normally be released Feb. 28.
The combined Feb. 28 report will contain one set of GDP numbers based on the data available from BEA’s data suppliers, including the U.S. Census Bureau, which also was affected by the funding lapse. This will include source data that would have gone into producing BEA’s advance estimate of 4th quarter and annual GDP for 2018, and some – but not all – of the source data that typically feed the second estimate.
A few updated release dates from Census:
Advance Monthly Retail Sales, December [originally scheduled for 01/16/19] 02/14/19
Advance Report on Durable Goods, December [originally scheduled for 01/25/19] 02/21/19
New Residential Construction, December [originally scheduled for 01/17/19] 02/26/19
Housing Vacancies and Home Ownership, 4th Quarter 2018 [originally scheduled for 01/29/19] 02/28/19
Construction Put in Place, December [originally scheduled for 02/01/19] 03/04/19
New Residential Sales, December [originally scheduled for 01/25/19] 03/05/19
Las Vegas Real Estate in January: Sales Down 18% YoY, Inventory up 106% YoY
by Calculated Risk on 2/06/2019 10:57:00 AM
This is a key former distressed market to follow since Las Vegas saw the largest price decline, following the housing bubble, of any of the Case-Shiller composite 20 cities.
The Greater Las Vegas Association of Realtors reported Southern Nevada home prices bounce back to $300,000; GLVAR housing statistics for January 2019
Local home prices bounced back to the $300,000 mark for the first time since September while fewer properties changed hands and more homes were on the market than one year ago. So says a report released Wednesday by the Greater Las Vegas Association of REALTORS® (GLVAR) covering activity in the local housing market through January.1) Overall sales were down 18% year-over-year from 2,812 in January 2018 to 2,305 in January 2019.
...
The total number of existing local homes, condos and townhomes sold during January was 2,305. Compared to one year ago, January sales were down 19.4 percent for homes and down 12.5 percent for condos and townhomes. GLVAR reported a total of 42,876 property sales in 2018, down from 45,388 in all of 2017, so Carpenter expects sales numbers may continue to slip this year.
...
With nearly a four-month supply of homes now available for sale, she said the number of local homes listed for sale without offers on them has been increasing for several months. However, she said that is still below what would normally be considered a balanced market. By the end of January, GLVAR reported 7,254 single-family homes listed for sale without any sort of offer. That’s up 95.1 percent from one year ago. For condos and townhomes, the 1,703 properties listed without offers in January represented a 168.6 percent jump from one year ago.
...
The number of so-called distressed sales also continues to drop each year. GLVAR reported that short sales and foreclosures combined accounted for just 2.8 percent of all existing local property sales in January. That’s down from 4.3 percent of all sales one year ago and 11 percent two years ago.
emphasis added
2) Active inventory (single-family and condos) is up sharply from a year ago, from a total of 4,352 in January 2018 to 8,957 in January 2019. Note: Total inventory was up 106% year-over-year. This is a significant increase in inventory, although months-of-supply is still somewhat low.
3) Fewer distressed sales.


