by Calculated Risk on 2/08/2019 10:32:00 AM
Friday, February 08, 2019
AAR: January Rail Carloads up 1.7% YoY, Intermodal Up 0.5% YoY
From the Association of American Railroads (AAR) Rail Time Indicators. Graphs and excerpts reprinted with permission.
Total U.S. rail carloads were up 1.7%, or 21,054 carloads, in January 2019 over January 2018, while U.S. intermodal volume was up 0.5%, or 6,008 containers and trailers. You can split the five weeks of January 2019 into two parts. In weeks 1-3, total carloads were up 8.1% over last year and intermodal was up 5.7%. In weeks 4-5, though, carloads were down 6.6% (including an 8.4% decline in week 5) and intermodal was down 6.5% (including a 9.6% decline in week 5). Clearly, harsh weather at the end of January hurt rail traffic.
emphasis added
 Click on graph for larger image.
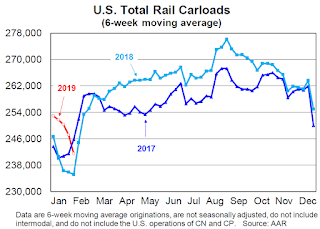
This graph from the Rail Time Indicators report shows U.S. average weekly rail carloads (NSA). Red is 2019.
Rail carloads have been weak over the last decade due to the decline in coal shipments.
U.S. railroads (excluding the U.S. operations of Canadian railroads) originated 1.238 million carloads in January 2019, up 1.7%, or 21,054 carloads, over January 2018. Weekly average total carloads in January 2019 were 247,697, the fewest for any month since January 2018.
In terms of rail carloads, January (which consists of weeks 1-5) had two parts. For weeks 1-3, total carloads were up 8.1% this year over last year. For weeks 4-5, though, they were down 6.6%. The extreme cold this year at the end of January in many parts of the country limited rail operations substantially, though it’s impossible to precisely calculate what carloads would have been if weather had been more normal.
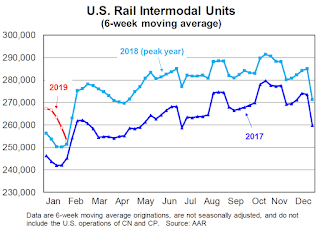
 The second graph is for intermodal traffic (using intermodal or shipping containers):
In addition to carloads, U.S. railroads originated 1.316 million containers and trailers in January 2019, up 0.5% over January 2018. Weekly average intermodal volume in January 2019 was 263,234 units, the most ever for January.Traffic in 2019 was off to a strong start, but then declined sharply due to the weather. AAR expects some "make-up volume" in February.
Like carloads, intermodal suffered from the weather. In the first three weeks of 2019, intermodal volume was up 5.7% over last year; weeks 2 and 3 this year were the highest-volume intermodal weeks in January in history for U.S. railroads. In weeks 4-5, though, intermodal was down 6.5% this year over last year, including a 9.6% decline in week 5, when weather was especially cold in much of the country. Again, it’s not possibly to precisely quantify the impact, but it’s reasonable to expect some make-up volume in February.


