 RSS Feed
 by Calculated Risk on 1/18/2019 09:25:00 AM
Friday, January 18, 2019
Industrial Production Increased 0.3% in December
From the Fed: Industrial Production and Capacity Utilization
Industrial production increased 0.3 percent in December after rising 0.4 percent in November. For the fourth quarter as a whole, total industrial production moved up at an annual rate of 3.8 percent. In December, manufacturing output increased 1.1 percent, its largest gain since February 2018. The output of mines rose 1.5 percent, but the index for utilities fell 6.3 percent, as warmer-than-usual temperatures lowered the demand for heating. At 109.9 percent of its 2012 average, total industrial production was 4.0 percent higher in December than it was a year earlier. Capacity utilization for the industrial sector rose 0.1 percentage point in December to 78.7 percent, a rate that is 1.1 percentage points below its long-run (1972–2017) average.
emphasis added
 Click on graph for larger image.
This graph shows Capacity Utilization. This series is up 12.0 percentage points from the record low set in June 2009 (the series starts in 1967).
Capacity utilization at 78.7% is 1.1% below the average from 1972 to 2017 and below the pre-recession level of 80.8% in December 2007.
Note: y-axis doesn't start at zero to better show the change.
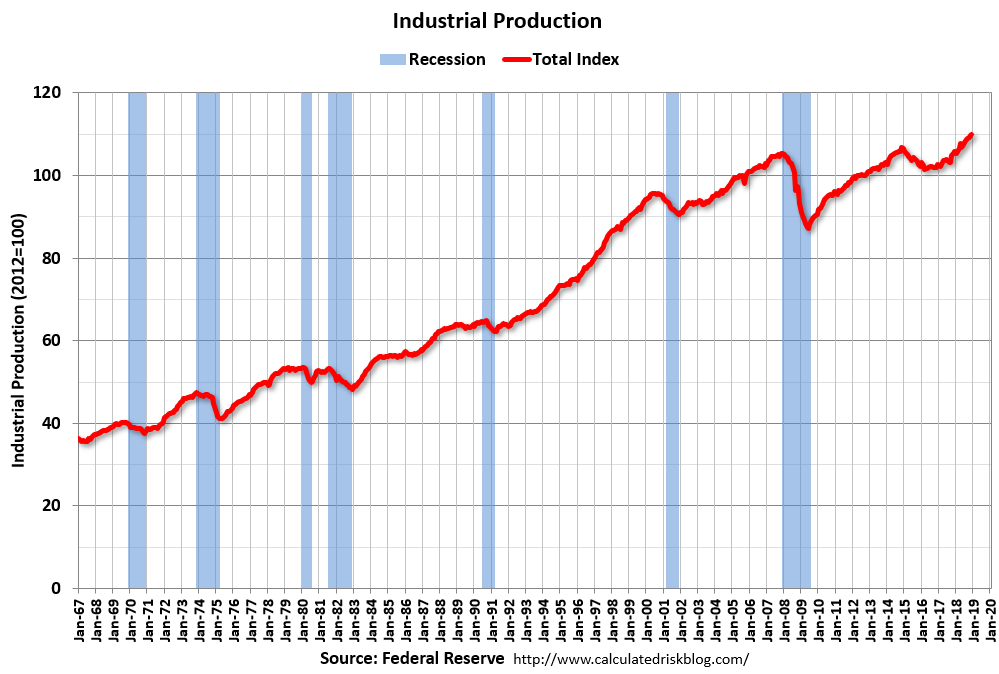 The second graph shows industrial production since 1967.
Industrial production increased in December to 109.9. This is 26% above the recession low, and 4% above the pre-recession peak.
The increase in industrial production was above the consensus forecast. Capacity utilization was also above consensus.
Thursday, January 17, 2019
Friday: Industrial Production
by Calculated Risk on 1/17/2019 07:47:00 PM
Friday:
• At 9:15 AM ET, The Fed will release Industrial Production and Capacity Utilization for December. The consensus is for a 0.3% increase in Industrial Production, and for Capacity Utilization to be unchanged at 78.5%.
• At 10:00 AM, University of Michigan's Consumer sentiment index (Final for January). The consensus is for a reading of 97.0.
• At 10:00 AM, State Employment and Unemployment (Monthly) for December 2018
California Existing Homes in December: Sales Down 12% YoY, Inventory Up 31%
by Calculated Risk on 1/17/2019 03:08:00 PM
The CAR reported: California home sales close year on downward trend as home prices post mild gains, C.A.R. reports
California home sales declined for the eighth straight month in December, and a stagnating market for much of the year pushed sales lower in 2018 for the first time in four years, the CALIFORNIA ASSOCIATION OF REALTORS® (C.A.R.) said today.Here is some inventory data from the NAR and CAR (ht Tom Lawler).
Closed escrow sales of existing, single-family detached homes in California totaled a seasonally adjusted annualized rate of 372,260 units in December, according to information collected by C.A.R. from more than 90 local REALTOR® associations and MLSs statewide. The statewide annualized sales figure represents what would be the total number of homes sold during 2018 if sales maintained the December pace throughout the year. It is adjusted to account for seasonal factors that typically influence home sales.
December’s sales figure was down 2.4 percent from the revised 381,400 level in November and down 11.6 percent from home sales in December 2017 of 420,960. December marked the fifth month in a row that sales were below 400,000 and the lowest level of sales sold since January 2015.
“The housing market continued to shift in December and drift downward as sales have fallen double digits for the past three out of four months,” said C.A.R. President Jared Martin. “This trend is expected to continue, as buyers remain cautious about the murky housing market outlook due primarily to the volatility in the financial markets and uncertainty in the economic and political arenas.
“Additionally, housing markets in and around the wildfire areas have been exhibiting unusual patterns that could remain unsettled for the next few months. The impact, however, is confined mostly within the region and should not have a noticeable effect in the housing market at the state level.”
...
Statewide active listings rose for the ninth consecutive month after nearly three straight years of declines, increasing 30.6 percent from the previous year. All major regions recorded an increase in active listings, with the Bay Area posting the highest increase at 65 percent, followed by Southern California (34 percent), Central Valley (24 percent) and the Central Coast (12 percent).
The Unsold Inventory Index, which is a ratio of inventory over sales, increased year-to-year from 2.5 months in December 2017 to 3.5 months in December 2018. The index measures the number of months it would take to sell the supply of homes on the market at the current sales rate.
emphasis added
| YOY % Change, Existing SF Homes for Sale | ||
|---|---|---|
| NAR (National) | CAR (California) | |
| Sep-17 | -8.4% | -11.2% |
| Oct-17 | -10.4% | -11.5% |
| Nov-17 | -9.7% | -11.5% |
| Dec-17 | -11.5% | -12.0% |
| Jan-18 | -9.5% | -6.6% |
| Feb-18 | -8.6% | -1.3% |
| Mar-18 | -7.2% | -1.0% |
| Apr-18 | -6.3% | 1.9% |
| May-18 | -5.1 | 8.3% |
| Jun-18 | -0.5% | 8.1% |
| Jul-18 | 0.0% | 11.9% |
| Aug-18 | 2.1% | 17.2% |
| Sep-18 | 1.1% | 20.4% |
| Oct-18 | 2.8% | 28% |
| Nov-18 | 4.2% | 31% |
| Dec-18 | 5.5%1 | 30.6% |
| 1Estimate from Tom Lawler | ||
Economic Comic Relief
by Calculated Risk on 1/17/2019 11:39:00 AM
This is from the Humor Session of the 2019 American Economic Association annual meeting.
Philly Fed Mfg "Continued to Grow" in January
by Calculated Risk on 1/17/2019 09:30:00 AM
From the Philly Fed: January 2019 Manufacturing Business Outlook Survey
Manufacturing activity in the region continued to grow, according to results from the January Manufacturing Business Outlook Survey. The survey’s broad indicators remained positive, although their movements were mixed again this month: The general activity and new orders indicators increased from their readings last month, while the indicators for shipments and employment decreased. The firms reported growth in the underlying demand for their products and are generally optimistic about future growth and employment.Here is a graph comparing the regional Fed surveys and the ISM manufacturing index:
The index for current manufacturing activity in the region increased from a revised reading of 9.1 in December to 17.0 this month. Over 30 percent of the manufacturers reported increases in overall activity, while 13 percent reported decreases. The new orders index increased 8 points to 21.3, its highest reading in six months. … The firms continued to report overall higher employment, but the current employment index fell nearly 10 points to 9.6, its lowest reading in 16 months.
emphasis added
 Click on graph for larger image.
The New York and Philly Fed surveys are averaged together (yellow, through January), and five Fed surveys are averaged (blue, through December) including New York, Philly, Richmond, Dallas and Kansas City. The Institute for Supply Management (ISM) PMI (red) is through December (right axis).
This suggests the ISM manufacturing index will show expansion again in January, at about the same level as in December.
Weekly Initial Unemployment Claims decreased to 213,000
by Calculated Risk on 1/17/2019 08:33:00 AM
The DOL reported:
In the week ending January 12, the advance figure for seasonally adjusted initial claims was 213,000, a decrease of 3,000 from the previous week's unrevised level of 216,000. The 4-week moving average was 220,750, a decrease of 1,000 from the previous week's unrevised average of 221,750.The previous week was unrevised.
emphasis added
The following graph shows the 4-week moving average of weekly claims since 1971.
 Click on graph for larger image.
The dashed line on the graph is the current 4-week average. The four-week average of weekly unemployment claims decreased to 220,750.
This was lower than the consensus forecast.
Wednesday, January 16, 2019
Thursday: Housing Starts (Postponed), Unemployment Claims, Philly Fed Mfg Survey
by Calculated Risk on 1/16/2019 08:54:00 PM
Thursday:
• At 8:30 AM, POSTPONED Housing Starts for December. The consensus is for 1.256 million SAAR, unchanged from 1.256 million SAAR.
• At 8:30 AM, The initial weekly unemployment claims report will be released. The consensus is for 220 thousand initial claims, up from 216 thousand the previous week.
• At 8:30 AM, the Philly Fed manufacturing survey for January. The consensus is for a reading of 10.0, up from 9.4.
Lawler; Early Read on Existing Home Sales in December: Big Drop
by Calculated Risk on 1/16/2019 02:43:00 PM
From housing economist Tom Lawler: Early Read on Existing Home Sales in December: Big Drop
Based on publicly-available local realtor/MLS reports released across the country through today, I project that existing home sales as estimated by the National Association of Realtors ran at a seasonally adjusted annual rate of 4.97 million in December, down 6.6% from November’s preliminary estimate and down 10.6% from last December’s seasonally adjusted pace.
On the inventory front, local realtor/MLS data, as well as data from other inventory trackers, suggest that the inventory of existing homes for sale in December was up by about 5.5% from last December.
Finally, local realtor/MLS data suggest that the median US existing single-family home sales price last month was up by about 2.7% from last December.
CR Note: Existing home sales for December are scheduled to be released on Tuesday, Jan 22nd. Based on this estimate, December sales, on a seasonally adjusted annual rate basis, will be at the lowest level of sales since November 2015 (and that month was impacted by a regulation change).
Fed's Beige Book: Economic Growth "modest to moderate", Labor Market "Tight"
by Calculated Risk on 1/16/2019 02:03:00 PM
Fed's Beige Book "This report was prepared at the Federal Reserve Bank of Chicago based on information collected on or before January 7, 2019. "
Economic activity increased in most of the U.S., with eight of twelve Federal Reserve Districts reporting modest to moderate growth. Nonauto retail sales grew modestly, as several Districts reported more holiday traffic compared with last year. Auto sales were flat on balance. The majority of Districts indicated that manufacturing expanded, but that growth had slowed, particularly in the auto and energy sectors. New home construction and existing home sales were little changed, with several Districts reporting that sales were limited by rising prices and low inventory. Commercial real estate activity was also little changed on balance. Most Districts reported modest to moderate growth in activity in the nonfinancial services sector, though a few Districts noted that growth there had slowed. The energy sector expanded at a slower pace, and lower energy prices contributed to a pullback in the industry's capital spending expectations. The agriculture sector struggled as prices generally remained low despite recent increases. Overall, lending volumes grew modestly, though a few Districts noted that growth had slowed. Outlooks generally remained positive, but many Districts reported that contacts had become less optimistic in response to increased financial market volatility, rising short-term interest rates, falling energy prices, and elevated trade and political uncertainty.
...
Employment increased in most of the country, with a plurality of Districts reporting modest growth. All Districts noted that labor markets were tight and that firms were struggling to find workers at any skill level.
emphasis added
Sacramento Housing in December: Sales Down 22% YoY, Active Inventory up 36% YoY
by Calculated Risk on 1/16/2019 12:39:00 PM
From SacRealtor.org: December 2018 Statistics – Sacramento Housing Market – Single Family Homes; Real estate market slows for holiday season
December closed with 1,104 total sales, a 15.3% decrease from the 1,304 sales of November. Compared to the same month last year (1,408), the current figure is down 21.6%.CR Note: Inventory is still low - months of inventory is at 1.9 months, probably closer to 4 months would be normal - however inventory is up significantly year-over-year in Sacramento.
...
The Active Listing Inventory decreased, falling 20.8% from 2,714 to 2,149 units. [Note: Compared to December 2017, inventory is up 36.4%] The Months of Inventory dropped slightly to 1.9 Months. This figure represents the amount of time (in months) it would take for the current rate of sales to deplete the total active listing inventory.
...
The Average DOM (days on market) continued its increase, rising from 36 to 38 from November to December. The Median DOM also increased, rising from 24 to 25. “Days on market” represents the days between the initial listing of the home as “active” and the day it goes “pending.” Of the 1,104 sales this month, 56.3% (621) were on the market for 30 days or less and 78.8% (869) were on the market for 60 days or less.
emphasis added


