 RSS Feed
 by Calculated Risk on 10/30/2018 09:12:00 AM
Tuesday, October 30, 2018
Case-Shiller: National House Price Index increased 5.8% year-over-year in August
S&P/Case-Shiller released the monthly Home Price Indices for August ("August" is a 3 month average of June, July and August prices).
This release includes prices for 20 individual cities, two composite indices (for 10 cities and 20 cities) and the monthly National index.
Note: Case-Shiller reports Not Seasonally Adjusted (NSA), I use the SA data for the graphs.
From S&P: Annual Gains Fall Below 6% for the First Time in 12 Months According to the S&P CoreLogic Case-Shiller Index
The S&P CoreLogic Case-Shiller U.S. National Home Price NSA Index, covering all nine U.S. census divisions, reported a 5.8% annual gain in August, down from 6.0% in the previous month. The 10-City Composite annual increase came in at 5.1%, down from 5.5% in the previous month. The 20-City Composite posted a 5.5% year-over-year gain, down from 5.9% in the previous month.
Las Vegas, San Francisco and Seattle reported the highest year-over-year gains among the 20 cities. In August, Las Vegas led the way with a 13.9% year-over-year price increase, followed by San Francisco with a 10.6% increase and Seattle with a 9.6% increase. Four of the 20 cities reported greater price increases in the year ending August 2018 versus the year ending July 2018.
...
Before seasonal adjustment, the National Index posted a month-over-month gain of 0.2% in August. The 10-City and 20-City Composites did not report any gains for the month. After seasonal adjustment, the National Index recorded a 0.6% month-over-month increase in August. The 10-City Composite and the 20-City Composite both posted 0.1% month-over-month increases. In August, 12 of 20 cities reported increases before seasonal adjustment, while 17 of 20 cities reported increases after seasonal adjustment.
“Following reports that home sales are flat to down, price gains are beginning to moderate,” says David M. Blitzer, Managing Director and Chairman of the Index Committee at S&P Dow Jones Indices. “Comparing prices to their levels a year earlier, 14 of the 20 cities, the National Index plus the 10-city and 20-city Composite Indices all show slower price growth. The seasonally adjusted monthly data show that 10 cities experienced declining prices. Other housing data tell a similar story: prices and sales of new single family homes are weakening, housing starts are mixed and residential fixed investment is down in the last three quarters. Rising prices may be pricing some potential home buyers out of the market, especially when combined with mortgage rates approaching 5% for 30-year fixed rate loans.
“There are no signs that the current weakness will become a repeat of the crisis, however. In 2006, when home prices peaked and then tumbled, mortgage default rates bottomed out and started a three year surge. Today, the mortgage default rates reported by the S&P/Experian Consumer Credit Default Indices are stable. Without a collapse in housing finance like the one seen 12 years ago, a crash in home prices is unlikely.”
emphasis added
 Click on graph for larger image.
 The first graph shows the nominal seasonally adjusted Composite 10, Composite 20 and National indices (the Composite 20 was started in January 2000).
The Composite 10 index is off 0.8% from the bubble peak, and up 0.1% in August (SA).
The Composite 20 index is 2.4% above the bubble peak, and up 0.1% (SA) in August.
The National index is 10.4% above the bubble peak (SA), and up 0.6% (SA) in August. The National index is up 49.3% from the post-bubble low set in December 2011 (SA).
 The second graph shows the Year over year change in all three indices.
The Composite 10 SA is up 5.1% compared to August 2017. The Composite 20 SA is up 5.5% year-over-year.
The National index SA is up 5.8% year-over-year.
Note: According to the data, prices increased in 17 of 20 cities month-over-month seasonally adjusted.
I'll have more later.
Monday, October 29, 2018
Tuesday: Case-Shiller House Prices, Q3 Housing Vacancies and Homeownership
by Calculated Risk on 10/29/2018 07:05:00 PM
From Matthew Graham at Mortgage News Daily: Mortgage Rates Stay Near Recent Lows as Busy Week Begins
Mortgage rates didn't move today, despite a fair amount of underlying market volatility. … Holding steady today means that rates remain at their lowest levels in just over 2 weeks. That sounds like a good thing, but the catch is that we really haven't moved too far from recent highs during that time, and those are the highest highs in more than 7 years. [30YR FIXED - 4.875-5.0%]Tuesday:
emphasis added
• At 9:00 AM ET, S&P/Case-Shiller House Price Index for August. The consensus is for a 6.0% year-over-year increase in the Comp 20 index for August.
• At 10:00 AM, the Q3 2018 Housing Vacancies and Homeownership from the Census Bureau.
Year-over-year Change in Real Personal Consumption Expenditures (PCE)
by Calculated Risk on 10/29/2018 04:03:00 PM
Earlier I posted a graph showing real monthly personal consumption expenditures (PCE) based on the monthly BEA report.
Here is a graph showing the year-over-year change in real PCE since 2003.
In September, the YoY change was 3.0%, about the same level as for the last few years.
 Click on graph for larger image.
There was a significant decline in real PCE during the great recession, and real PCE was fairly weak during the first few years of the recovery - partially due to the ongoing weakness in housing following the housing bubble and bust.
More recently real PCE has been increasing at a fairly steady rate around 3.0% per year.
Q3 2018 GDP Details on Residential and Commercial Real Estate
by Calculated Risk on 10/29/2018 01:00:00 PM
The BEA has released the underlying details for the Q3 advance GDP report.
The BEA reported that investment in non-residential structures decreased at a 7.9% annual pace in Q3. Investment in petroleum and natural gas exploration decreased slightly in Q3 compared to Q2, but has increased substantially recently.
Without the increase in petroleum and natural gas exploration, non-residential investment would only be up about 4% year-over-year.
 Click on graph for larger image.
The first graph shows investment in offices, malls and lodging as a percent of GDP.
Investment in offices increased in Q3, and is up 10% year-over-year.
Investment in multimerchandise shopping structures (malls) peaked in 2007 and was down about 7% year-over-year in Q3. The vacancy rate for malls is still very high, so investment will probably stay low for some time.
Lodging investment increased in Q3, and lodging investment is up 7% year-over-year.
 The second graph is for Residential investment components as a percent of GDP. According to the Bureau of Economic Analysis, RI includes new single family structures, multifamily structures, home improvement, Brokers’ commissions and other ownership transfer costs, and a few minor categories (dormitories, manufactured homes).
Home improvement was the top category for five consecutive years following the housing bust ... but now investment in single family structures has been back on top for the last six years and will probably stay there for a long time - although single family investment has been down a little recently.
However - even though investment in single family structures has increased from the bottom - single family investment is still very low, and still below the bottom for previous recessions as a percent of GDP. I expect some further increase.
Investment in single family structures was $286 billion (SAAR) (about 1.4% of GDP), and was down slightly in Q3 compared to Q2.
Investment in multi-family structures decreased in Q3.
Investment in home improvement was at a $264 billion Seasonally Adjusted Annual Rate (SAAR) in Q3 (about 1.3% of GDP). Home improvement spending has been solid.
Dallas Fed: "Texas Manufacturing Continues to Expand, but Pace Slows"
by Calculated Risk on 10/29/2018 10:36:00 AM
From the Dallas Fed: Texas Manufacturing Continues to Expand, but Pace Slows
Texas factory activity continued to expand in October, albeit at a slower pace, according to business executives responding to the Texas Manufacturing Outlook Survey. The production index, a key measure of state manufacturing conditions, was positive but declined another six points to 17.6, indicating output growth continued to abate.This was the last of the regional Fed surveys for October.
Some other indexes of manufacturing activity also suggested slower expansion in October. The capacity utilization index retreated six points to 15.4, while the shipments index fell four points to 16.6. Meanwhile, the new orders index rose—pushing up four points to 18.9—and the growth rate of orders index held steady at 11.0.
Perceptions of broader business conditions improved this month. The general business activity index inched up to 29.4, and the company outlook index climbed seven points to 25.0. Fewer than 3 percent of firms noted that their outlook worsened, the lowest share since 2004. The index measuring uncertainty regarding companies’ outlooks retreated 13 points to 6.9.
Labor market measures suggested rising employment levels and longer workweeks in October. The employment index rose six points to 23.9, a level well above average. Twenty-eight percent of firms noted net hiring, compared with 4 percent noting net layoffs. The hours worked index remained positive but moved down to 6.5.
Price increases accelerated further in October, and wage pressures remained elevated.
emphasis added
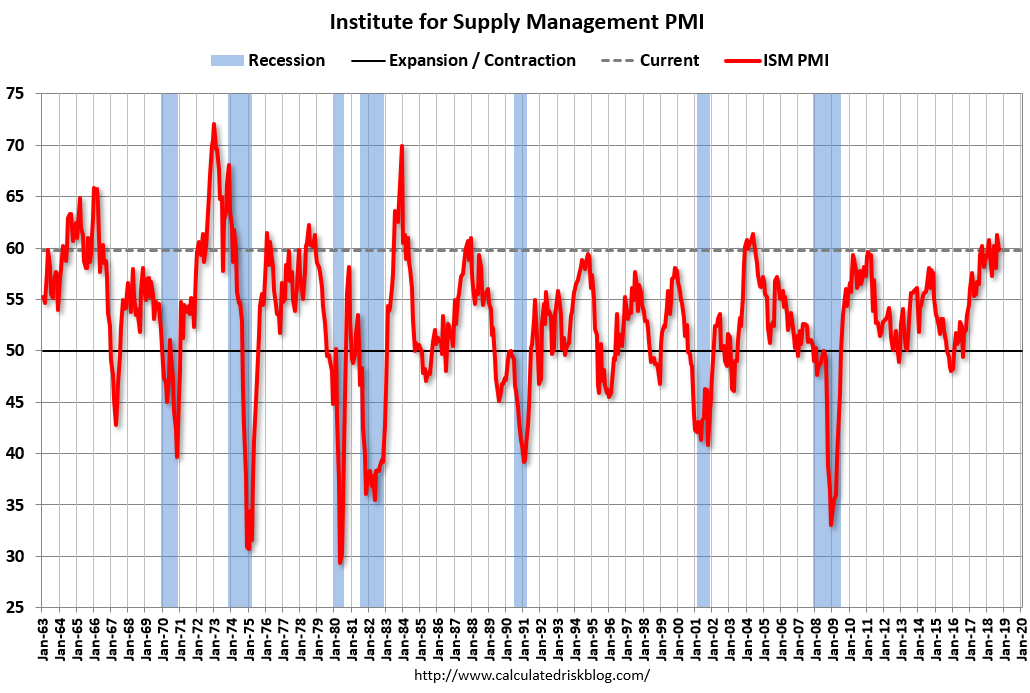
Here is a graph comparing the regional Fed surveys and the ISM manufacturing index:
 Click on graph for larger image.
The New York and Philly Fed surveys are averaged together (yellow, through October), and five Fed surveys are averaged (blue, through October) including New York, Philly, Richmond, Dallas and Kansas City. The Institute for Supply Management (ISM) PMI (red) is through September (right axis).
Based on these regional surveys, it seems likely the ISM manufacturing index will be solid in October, but below 60 again (to be released on Thursday, November 1st).
Personal Income increased 0.2% in September, Spending increased 0.4%
by Calculated Risk on 10/29/2018 08:37:00 AM
The BEA released the Personal Income and Outlays report for September:
Personal income increased $35.7 billion (0.2 percent) in September according to estimates released today by the Bureau of Economic Analysis. Disposable personal income (DPI) increased $29.1 billion (0.2 percent) and personal consumption expenditures (PCE) increased $53.0 billion (0.4 percent).The September PCE price index increased 2.0 percent year-over-year and the September PCE price index, excluding food and energy, also increased 2.0 percent year-over-year.
Real DPI increased 0.1 percent in September and Real PCE increased 0.3 percent. The PCE price index increased 0.1 percent. Excluding food and energy, the PCE price index increased 0.2 percent.
The following graph shows real Personal Consumption Expenditures (PCE) through September 2018 (2012 dollars). Note that the y-axis doesn't start at zero to better show the change.
 Click on graph for larger image.
The dashed red lines are the quarterly levels for real PCE.
The increase in personal income was below expectations, and the increase in PCE was at expectations.
PCE growth was strong in Q3, and inflation is close to the Fed's target.
Sunday, October 28, 2018
Monday: Personal Income and Outlays, Dallas Fed Mfg
by Calculated Risk on 10/28/2018 07:58:00 PM
Weekend:
• Schedule for Week of October 28, 2018
Monday:
• At 8:30 AM ET, Personal Income and Outlays for September. The consensus is for a 0.4% increase in personal income, and for a 0.4% increase in personal spending. And for the Core PCE price index to increase 0.1%.
• At 10:30 AM, Dallas Fed Survey of Manufacturing Activity for October. This is the last of the regional Fed manufacturing surveys for October.
From CNBC: Pre-Market Data and Bloomberg futures: S&P 500 are up 18 and DOW futures are up 144 (fair value).
Oil prices were down over the last week with WTI futures at $67.69 per barrel and Brent at $77.79 per barrel. A year ago, WTI was at $54, and Brent was at $61 - so oil prices are up about 25% year-over-year.
Here is a graph from Gasbuddy.com for nationwide gasoline prices. Nationally prices are at $2.81 per gallon. A year ago prices were at $2.45 per gallon, so gasoline prices are up 36 cents per gallon year-over-year.
Hotels: Occupancy Rate Increased Slightly Year-over-year
by Calculated Risk on 10/28/2018 09:32:00 AM
From HotelNewsNow.com: US hotel results for week ending 20 October
The U.S. hotel industry reported positive year-over-year results in the three key performance metrics during the week of 14-20 October 2018, according to data from STR.The following graph shows the seasonal pattern for the hotel occupancy rate using the four week average.
In comparison with the week of 15-21 October 2017, the industry recorded the following:
• Occupancy: +0.4% to 73.2%
• Average daily rate (ADR): +3.2% to US$135.67
• Revenue per available room (RevPAR): +3.6% to US$99.32
…
Houston, Texas, registered the steepest declines in each of the three key performance metrics: occupancy (-23.8% to 66.0%), ADR (-8.8% to US$107.41) and RevPAR (-30.6% to US$70.85). Houston’s hotel performance was lifted in the weeks and months that followed Hurricane Harvey in 2017 as properties filled with displaced residents, relief workers, insurance adjustors, media members, etc.
emphasis added
 Click on graph for larger image.
The red line is for 2018, dash light blue is 2017, blue is the median, and black is for 2009 (the worst year probably since the Great Depression for hotels).
This is the fourth strong year in a row for hotel occupancy. The occupancy rate, to date, is just ahead of the record year in 2017.
Seasonally, the occupancy rate will now decline through the end of the year.
Data Source: STR, Courtesy of HotelNewsNow.com
Saturday, October 27, 2018
Schedule for Week of October 28, 2018
by Calculated Risk on 10/27/2018 08:11:00 AM
The key report this week is the October employment report on Friday.
Other key indicators include the October ISM manufacturing index, October auto sales, Personal Income and Outlays for September, Case-Shiller house prices for August, and the September trade deficit.
For manufacturing, the Dallas Fed manufacturing survey will be released this week.
8:30 AM ET: Personal Income and Outlays for September. The consensus is for a 0.4% increase in personal income, and for a 0.4% increase in personal spending. And for the Core PCE price index to increase 0.1%.
10:30 AM: Dallas Fed Survey of Manufacturing Activity for October. This is the last of the regional Fed manufacturing surveys for October.
 9:00 AM ET: S&P/Case-Shiller House Price Index for August.
This graph shows the nominal seasonally adjusted National Index, Composite 10 and Composite 20 indexes through the most recent report (the Composite 20 was started in January 2000).
The consensus is for a 6.0% year-over-year increase in the Comp 20 index for August.
10:00 AM: the Q3 2018 Housing Vacancies and Homeownership from the Census Bureau.
7:00 AM ET: The Mortgage Bankers Association (MBA) will release the results for the mortgage purchase applications index.
8:15 AM: The ADP Employment Report for October. This report is for private payrolls only (no government). The consensus is for 180,000 jobs added, down from 230,000 in September.
9:45 AM: Chicago Purchasing Managers Index for October. The consensus is for a reading of 60.0, down from 60.4 in September.
 All day: Light vehicle sales for October.
The consensus is for 17.0 million SAAR in October, down from the BEA estimate of 17.36 million SAAR in September 2018 (Seasonally Adjusted Annual Rate).
This graph shows light vehicle sales since the BEA started keeping data in 1967. The dashed line is the current sales rate.
8:30 AM: The initial weekly unemployment claims report will be released. The consensus is for 212 thousand initial claims, down from 215 thousand the previous week.
 10:00 AM: ISM Manufacturing Index for October. The consensus is for 59.1%, down from 59.8%.
Here is a long term graph of the ISM manufacturing index.
The PMI was at 59.8% in September, the employment index was at 58.8%, and the new orders index was at 61.8%.
10:00 AM: Construction Spending for September. The consensus is for 0.3% increase in spending.
 8:30 AM: Employment Report for October. The consensus is for 190,000 jobs added, and for the unemployment rate to be unchanged at 3.7%.
There were 134,000 jobs added in September, and the unemployment rate was at 3.7%.
This graph shows the year-over-year change in total non-farm employment since 1968.
In September the year-over-year change was 2.537 million jobs.
A key will be the change in wages.
 8:30 AM: Trade Balance report for September from the Census Bureau.
 This graph shows the U.S. trade deficit, with and without petroleum, through the most recent report. The blue line is the total deficit, and the black line is the petroleum deficit, and the red line is the trade deficit ex-petroleum products.
The consensus is the trade deficit to be $53.4 billion. The U.S. trade deficit was at $53.2 billion in August.
Friday, October 26, 2018
October 2018: Unofficial Problem Bank list declines to 75 Institutions
by Calculated Risk on 10/26/2018 04:57:00 PM
Note: Surferdude808 compiles an unofficial list of Problem Banks compiled only from public sources.
Here is the unofficial problem bank list for October 2018.
Here are the monthly changes and a few comments from surferdude808:
Update on the Unofficial Problem Bank List for October 2018. The list had a net decline of four insured institutions to 75 banks after six removals and two additions. Aggregate assets declined during the month by $772 million to $56.2 billion. A year ago, the list held 111 institutions with assets of $26.6 billion.
Actions were terminated against First Chatham Bank, Savannah, GA ($369 million); Bank of Eastman, Eastman, GA ($170 million); Pinnacle Bank, Orange City, FL ($89 million); and American Investors Bank and Mortgage, Eden Prairie, MN ($69 million). Removals through other ways include Sage Bank, Lowell, MA ($143 million) finding a merger partner and Merchants Bank of California, National Association, Carson, CA ($3 million) exiting through a voluntary liquidation.
Additions this month were AllNations Bank, Calumet, OK ($51 million) and Sainte Marie State Bank, Sainte Marie, IL ($20 million).
Lastly, we updated the name of Illinois-Service Federal Savings and Loan Association, Chicago, IL ($133 million) to GN Bank.


