 RSS Feed
 by Calculated Risk on 8/07/2014 05:27:00 PM
Thursday, August 07, 2014
Hotels: Occupancy up 4.5%, RevPAR up 11.0% Year-over-Year
From HotelNewsNow.com: STR: US hotel results for week ending 2 August
The U.S. hotel industry recorded positive results in the three key performance measurements during the week of 27 July through 2 August 2014, according to data from STR.Note: ADR: Average Daily Rate, RevPAR: Revenue per Available Room.
In year-over-year measurements, the industry’s occupancy rate rose 4.5 percent to 76.3 percent. Average daily rate increased 6.2 percent to finish the week at US$118.70. Revenue per available room for the week was up 11.0 percent to finish at US$90.54.
emphasis added
The occupancy rate probably peaked for 2014 during the last week in July at 77.9%. Before this year, the previous weekly high for the occupancy rate was late in July 2000 at 77.0%.
The following graph shows the seasonal pattern for the hotel occupancy rate using the four week average.
 Click on graph for larger image.
The red line is for 2014, blue is the median, and black is for 2009 - the worst year since the Great Depression for hotels. Purple is for 2000.
The 4-week average of the occupancy rate is solidly above the median for 2000-2007, and is at the same level as in 2000.
Right now it looks like 2014 will be the best year since 2000 for hotels. A very strong year ...
Data Source: Smith Travel Research, Courtesy of HotelNewsNow.com
NAHB: Builder Confidence improves for the 55+ Housing Market in Q2
by Calculated Risk on 8/07/2014 03:08:00 PM
This is a quarterly index from the the National Association of Home Builders (NAHB) and is similar to the overall housing market index (HMI). The NAHB started this index in Q4 2008, so the readings have been very low. Note that this index is Not Seasonally Adjusted (NSA)
From the NAHB: Builder Confidence in the 55+ Housing Market Shows Positive Signs in the Second Quarter
Builder confidence in the single-family 55+ housing market for the second quarter is up year over year, according to the National Association of Home Builders’ (NAHB) 55+ Housing Market Index (HMI) released today. Compared to the second quarter of 2013, the single-family index increased three points to a level of 56, which is the highest second-quarter reading since the inception of the index in 2008 and the 11th consecutive quarter of year over year improvements.
...
Two of the components of the 55+ single-family HMI posted increases from a year ago: present sales climbed seven points to 61 and expected sales for the next six months rose one point to 61. Meanwhile, traffic of prospective buyers dropped six points to 42.
...
“One of the factors contributing to the positive signs in the 55+ housing market is the slow but steady increase in existing home sales in the last three months,” said NAHB Chief Economist David Crowe. “The 55+ market is strongly driven by consumers being able to sell their existing homes at a favorable price in order to buy or rent in a 55+ community.”
emphasis added
 Click on graph for larger image.
This graph shows the NAHB 55+ HMI through Q2 2014. The index increased in Q2 to 56 from 50 in Q1, and up from 53 in Q2 2013. This indicates that more builders view conditions as good than as poor.
There are two key drivers: 1) there is a large cohort moving into the 55+ group, and 2) the homeownership rate typically increases for people in the 55 to 70 year old age group. So demographics should be favorable for the 55+ market.
Trulia: Asking House Prices up 7.8% year-over-year in July
by Calculated Risk on 8/07/2014 01:11:00 PM
Note: Trulia corrected the Year-over-year change in the post from 8.1% to 7.8% for July.
From Trulia chief economist Jed Kolko: Home Price Gains Now Driven More By Jobs Than By Rebound Effect
The month-over-month increase in asking home prices of 0.8% was in line with the average monthly gain over the past year, settling back down after a 1.2% month-over-month in June. ... Although prices aren’t rising as fast as they did in spring 2013, price increases continue to be widespread, with 97 of 100 metros posting year-over-year price gains, and 94 posting quarter-over-quarter gains.Note: These asking prices are SA (Seasonally Adjusted) - and adjusted for the mix of homes - and this suggests further house price increases over the next few months on a seasonally adjusted basis.
As the rebound effect diminishes, local housing markets need to depend more on job growth, which is a more sustainable driver of housing demand. So are they? We compared year-over-year asking price gains in July 2014 with year-over-year job gains in December 2013, from the Bureau of Labor Statistics’ Quarterly Census of Employment and Wages (QCEW) in the 100 largest U.S. metros. Clearly, housing markets with higher asking-price gains have faster job growth ... A year ago, the pattern was different: in July 2013, home price changes were more highly correlated with the peak-to-trough price decline than with job growth (year-over-year in December 2012). Over the past year, therefore, the rebound effect has weakened, and as prices continue to return to long-term normal levels the rebound effect will continue to fade. Local housing markets will rely more on jobs and wages to support housing demand and home prices – which is another step on the road to recovery.
...
Job Growth Boosts Rents in Largest U.S. Rental Markets
Rents rose more than 10% year-over-year in five large rental markets – San Francisco, Sacramento, Oakland, Denver, and Miami. These five markets all had job growth ranging from solid to stellar.Overall, rents rose 6.1% nationally, with rents increasing more in markets with faster job growth.
emphasis added
MBA: Delinquency and Foreclosure Rates Decrease in Second Quarter
by Calculated Risk on 8/07/2014 10:44:00 AM
From the MBA: Delinquency and Foreclosure Rates Decrease in Second Quarter
The delinquency rate for mortgage loans on one-to-four-unit residential properties decreased to a seasonally adjusted rate of 6.04 percent of all loans outstanding at the end of the second quarter of 2014. The delinquency rate decreased for the fifth consecutive quarter and reached the lowest level since the fourth quarter of 2007. The delinquency rate decreased seven basis points from the previous quarter, and 92 basis points from one year ago, according to the Mortgage Bankers Association’s (MBA) National Delinquency Survey.CR Notes: This survey has shown steady improvement in delinquency and foreclosure rates, but it will take a few more years to work through the backlog - especially in judicial foreclosure states.
The delinquency rate includes loans that are at least one payment past due but does not include loans in the process of foreclosure. The percentage of loans in the foreclosure process at the end of the second quarter was 2.49 percent, down 16 basis points from the first quarter and 84 basis points lower than one year ago. This was the lowest foreclosure inventory rate seen since the first quarter of 2008.
The percentage of loans on which foreclosure actions were started during the second quarter fell to 0.40 percent from 0.45 percent, a decrease of five basis points, and reached the lowest level since the second quarter of 2006.
The serious delinquency rate, the percentage of loans that are 90 days or more past due or in the process of foreclosure, was 4.80 percent, a decrease of 24 basis points from last quarter, and a decrease of 108 basis points from the second quarter of last year. Similar to the previous quarter, 75 percent of seriously delinquent loans were originated in 2007 and earlier. Loans with vintages started in 2011 and later only accounted for six percent of all seriously delinquent loans.
“Delinquency and foreclosure rates fell to their lowest levels in more than six years, and the rate of new foreclosure starts is at its lowest level since 2006,” said Mike Fratantoni, MBA’s Chief Economist. “Strong job growth and continued increases in home prices in most markets have been the main contributors to these steady improvements in mortgage performance.
“We have returned to more typical seasonal patterns with respect to mortgage delinquency, with 30-day and 60-day delinquency rates increasing from the first to the second quarter on an unadjusted basis. Adjusting for the seasonal pattern, we estimate that delinquencies were down for the quarter, and are down almost a full percentage point from last year.
“Nationally, the seriously delinquent rate fell by 24 basis points last quarter and has dropped 108 basis points over the past year. The loans that are seriously delinquent, either 90+ days late or in the foreclosure process, were primarily made prior to the downturn, with 75 percent of them originated in 2007 or earlier. Loans made in recent years continue to perform extremely well due to the improving market and tight credit conditions.
...
The declining trend in later stage delinquencies and foreclosure measures is clearly continuing at the national level,” added Joel Kan, MBA’s Director of Economic Forecasting. “Some states hardest hit by the crisis, for example California and Arizona, now have foreclosure inventory rates that are both back to pre-crisis levels and less than half the current national rate. On the other hand, despite declines last quarter, states with slower-moving judicial foreclosure regimes, like New Jersey, Florida and New York, have foreclosure inventory rates two to three times the national average. There were 18 states with a higher foreclosure inventory rate than the national average, and 15 of those were judicial states. Judicial states are also starting to see more foreclosure starts than non-judicial states, whereas there used to be no clear tendency for either foreclosure regime in the past quarters.
emphasis added
Most of the remaining problems are with loans made in 2007 or earlier: "75 percent of seriously delinquent loans were originated in 2007 and earlier" and are in judicial foreclosure states.
This survey includes all mortgage loans (including terrible lending via Wall Street). The total serious delinquency rate is 4.80% compared to less than 2.1% for Fannie and Freddie.
Weekly Initial Unemployment Claims decline to 289,000, 4-Week Average Lowest since February 2006
by Calculated Risk on 8/07/2014 08:37:00 AM
The DOL reports:
In the week ending August 2, the advance figure for seasonally adjusted initial claims was 289,000, a decrease of 14,000 from the previous week's revised level. The previous week's level was revised up by 1,000 from 302,000 to 303,000. The 4-week moving average was 293,500, a decrease of 4,000 from the previous week's revised average. This is the lowest level for this average since February 25, 2006 when it was 290,750. The previous week's average was revised up by 250 from 297,250 to 297,500.The previous week was revised up to 303,000.
There were no special factors impacting this week's initial claims.
The following graph shows the 4-week moving average of weekly claims since January 1971.
 Click on graph for larger image.
The dashed line on the graph is the current 4-week average. The four-week average of weekly unemployment claims decreased to 293,500.
This was lower than the consensus forecast of 305,000.
Wednesday, August 06, 2014
Thursday: Unemployment Claims
by Calculated Risk on 8/06/2014 07:21:00 PM
From Tim Duy at Economist's View: Fed Watch: Fed Hawks Squawk
How much leeway does Fed Chair Janet Yellen have in her campaign to hold interest rates low for a considerable period after asset purchases end later this year? If you listen to Fed hawks, you would believe that she is quickly running out of room. ...CR Note: Duy says the "hawks will remain frustrated", but it is also important to note that they have also been wrong!
... At the moment, we are focused on wages as the missing part of the higher rate equation. But that is too narrow of an analysis. Also on Yellen's side is low actual inflation and anchored inflation expectations. To be sure, the Fed will be under increasing pressure to begin normalizing policy if unemployment drops below 6%. At that point the Fed will be sufficiently close to their objectives that they will believe the odds of falling behind the curve will rise in the absence of movement toward policy normalization. But without a more pressing threat to inflation expectations from a combination of actual inflation in excess of the Fed's target and wage growth to support that inflation, Yellen has room to normalize policy at a gradual pace. For now, the data is still on her side and the hawks will remain frustrated, much as they have for the past several years.
Thursday:
• At 8:30 AM ET, the initial weekly unemployment claims report will be released. The consensus is for claims to increase to 305 thousand from 302 thousand.
• Early, the Trulia Price Rent Monitors for July. This is the index from Trulia that uses asking house prices adjusted both for the mix of homes listed for sale and for seasonal factors.
• At 3:00 PM, Consumer Credit for June from the Federal Reserve. The consensus is for credit to increase $18.3 billion.
Payroll Employment and Seasonal Factors
by Calculated Risk on 8/06/2014 05:31:00 PM
This might be a good time to review the seasonal pattern for employment.
Even in the best of years there are a significant number of jobs lost in the months of January and July. In 1994, when the economy added almost 3.9 million jobs, there were 2.25 million lost in January 1994, and almost 1 million payroll jobs lost in July of that year.
This year, in July 2014, 1.11 million total jobs were lost (not seasonally adjusted, NSA), however all of the decline in non-farm payrolls NSA was from the public sector (teacher layoffs). Usually those teachers return to the payrolls in September and early October. Since this happens every year, the BLS applies a seasonal adjustment before reporting the headline number.
For the private sector, there are always a number of jobs lost in January (retailers and others cutting jobs) and in September (summer hires let go).
 Click on graph for larger image.
This graph shows the seasonal pattern for the last decade for both total nonfarm jobs and private sector only payroll jobs. Notice the large spike down every January.
In July, the private sector added 127 thousand jobs (NSA). This was the strongest July since 1999.
The key point is this is a series that NEEDS a seasonal adjustment!
U.S. Births increased in 2013 after Declining for Five Consecutive Years
by Calculated Risk on 8/06/2014 12:11:00 PM
This provisional data for 2013 was released in May and shows a possible impact of the great recession ...
From the National Center for Health Statistics: Births: Preliminary Data for 2013. The NCHS reports:
The 2013 preliminary number of U.S. births was 3,957,577, slightly more (4,736) than in 2012. ...The most amazing data is on teen births (see 2nd graph below).
The general fertility rate was 62.9 births per 1,000 women aged 15–44, down slightly from 2012 and a record low.
Here is a long term graph of annual U.S. births through 2013 ...
 Click on graph for larger image.
Births had declined for five consecutive years, and are about 8.3% below the peak in 2007 (births in 2007 were at the all time high - even higher than during the "baby boom"). I suspect certain segments of the population were under stress before the recession started - like construction workers - and even more families were in distress in 2008 through 2012. And this led to fewer babies.
Notice that the number of births started declining a number of years before the Great Depression started. Many families in the 1920s were under severe stress long before the economy collapsed. By 1933 births were down by almost 23% from the early '20s levels.
Of course economic distress isn't the only reason births decline - look at the huge decline following the baby boom that was driven by demographics. But it is not surprising that the number of births slow or decline during tough economic times - but that appears to be over now.
 The second graph is from the NCHS report and shows births per 1,000 women by teen age group. From the NCHS:
 The number of births to teenagers aged 15–19 in 2013 was 274,641, also down 10% from 2012 and the lowest number of teen births ever reported for the United States. The 2013 number of births was 38% less than in 2007 (444,899), the most recent high, and 57% less than in 1970, the all-time peak year for the number of teen births (644,708).Far fewer teens births is great news (and is probably related to the much higher enrollment rates).
Another key trends ... women are waiting longer to have babies:
The birth rate for women aged 20–24 was 81.2 births per 1,000 women in 2013, down 2% from the previous record low rate in 2012 (83.1). Since 2007, the rate for women in this age group has declined steadily at nearly 4% per year.Waiting longer to have children makes sense (see: Demographics and Behavior) and we should expect a baby boom in a few years as the largest cohorts move into the 25 to 34 years old age groups. (for largest cohorts, see: Census Bureau: Largest 5-year Population Cohort is now the "20 to 24" Age Group).
The 2013 preliminary birth rate for women aged 30–34 was 98.7 births per 1,000 women, up 1% from the rate in 2012 (97.3). The number of births to women in their early 30s also increased in 2013, by 2%. The rate for women aged 35–39 was 49.6 births per 1,000 women, up 3% from 2012 (48.3), reaching the highest rate for this age group since 1963. The number of births to women in their late 30s increased 3% in 2013.
P.S. I expect that as families have babies, they will tend to buy homes (as opposed to rent)! The demographics are favorable for renting now (see: The Favorable Demographics for Apartments), but eventually the demographics will be more positive for home ownership.
Trade Deficit decreased in June to $41.5 Billion
by Calculated Risk on 8/06/2014 08:30:00 AM
The Department of Commerce reported:
[T]otal June exports of $195.9 billion and imports of $237.4 billion resulted in a goods and services deficit of $41.5 billion, down from $44.7 billion in May, revised. June exports were $0.3 billion more than May exports of $195.6 billion. June imports were $2.9 billion less than May imports of $240.3 billion.The trade deficit was smaller than the consensus forecast of $45.0 billion.
The first graph shows the monthly U.S. exports and imports in dollars through June 2014.
 Click on graph for larger image.
Imports decreased and exports increased in June.
Exports are 18% above the pre-recession peak and up 3% compared to June 2013; imports are about 2% above the pre-recession peak, and up about 5% compared to June 2013.
The second graph shows the U.S. trade deficit, with and without petroleum, through June.
 The blue line is the total deficit, and the black line is the petroleum deficit, and the red line is the trade deficit ex-petroleum products.
Oil imports averaged $96.41 in June, up from $96.12 in May, and down from $96.87 in June 2013. The petroleum deficit has generally been declining and is the major reason the overall deficit has declined since early 2012.
The trade deficit with China increased to $30.1 billion in June, from $26.7 billion in June 2013.
MBA: Mortgage Refinance Applications Increase in Latest MBA Weekly Survey
by Calculated Risk on 8/06/2014 07:00:00 AM
From the MBA: Refinance Applications, Share Increase in Latest MBA Weekly Survey
Mortgage applications increased 1.6 percent from one week earlier, according to data from the Mortgage Bankers Association’s (MBA) Weekly Mortgage Applications Survey for the week ending August 1, 2014. ...
The Refinance Index increased 4 percent from the previous week. The seasonally adjusted Purchase Index decreased 1 percent from one week earlier. ...
...
The average contract interest rate for 30-year fixed-rate mortgages with conforming loan balances ($417,000 or less) increased to 4.35 percent from 4.33 percent, with points decreasing to 0.22 from 0.24 (including the origination fee) for 80 percent loan-to-value ratio (LTV) loans.
emphasis added
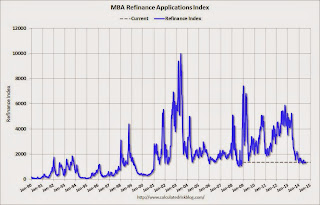 Click on graph for larger image.
The first graph shows the refinance index.
The refinance index is down 74% from the levels in May 2013.
As expected, refinance activity is very low this year.
 The second graph shows the MBA mortgage purchase index.
 According to the MBA, the unadjusted purchase index is down about 14% from a year ago.


