 RSS Feed
 by Calculated Risk on 6/25/2011 05:55:00 PM
Saturday, June 25, 2011
Schedule for Week of June 26th
Earlier:
• Summary for Week Ending June 24th
• Unofficial Problem Bank list at 1,001 Institutions and Transition Matrix
This will be busy week for economic data. The key releases will be the ISM manufacturing index on Friday, Case-Shiller house prices (April) on Tuesday, and auto sales on Friday.
Some of these releases will show ongoing weakness such as the ISM manufacturing index and the Chicago PMI. The regional surveys suggest the ISM index will be in the low 50s – or possibly below 50 in June (below 50 would indicate contraction for manufacturing).
However other releases might show some improvement such as auto sales and pending home sales. Of special interest will be the Case-Shiller index for April (a three month average of prices in February, March and April). Other house price indexes have indicated prices increased in April, however, because of the averaging, Case-Shiller might still show a decline.
8:30 AM: Personal Income and Outlays for May. The following graph shows real Personal Consumption Expenditures (PCE) through April (2005 dollars).
 Click on graph for larger image in graph gallery.
PCE increased 0.4% in April, but real PCE only increased 0.1% as the price index for PCE increased 0.3 percent in April.
The consensus is for a 0.4% increase in personal income in May, and a 0.1% increase in personal spending, and for the Core PCE price index to increase 0.2%.
10:30 AM: Dallas Fed Manufacturing Survey for June. The Texas production index increased to 12.7 in May from 8.1 in April.
 9:00 AM: S&P/Case-Shiller Home Price Index for April. Although this is the April report, it is really a 3 month average of February, March and April.
 This graph shows the nominal seasonally adjusted Composite 10 and Composite 20 indices (the Composite 20 was started in January 2000).
House prices have continued to decline, and the Composite 20 index hit a new post-bubble low in March. The consensus is for prices to decline about 0.3% in April, however other indexes suggest the decline will be less (or even an increase).
10:00 AM: Conference Board's consumer confidence index for June. The consensus is for a slight increase to 61.0 from 60.8 last month, possibly due to slightly lower gasoline prices.
10:00 AM: Richmond Fed Manufacturing Survey for June. The consensus is for the survey to show modest contraction with a reading of -2.
7:00 AM: The Mortgage Bankers Association (MBA) will release the mortgage purchase applications index. This index has been very weak over the last couple months suggesting weak home sales through early summer (not counting all cash purchases).
10:00 AM: Pending Home Sales Index for May. The consensus is for a 2% decrease in the index, however economist Tom Lawler is forecasting a possible double digit increase.
8:30 AM: The initial weekly unemployment claims report will be released. The number of claims has been elevated for the last couple of months. The consensus is for a decrease to 420,000 from 429,000 last week.
9:45 AM: Chicago Purchasing Managers Index for June. The consensus is for a decrease to 54.0, down from 56.6 in May.
11:00 AM: Kansas City Fed regional Manufacturing Survey for June. The index was at 1 in May, down from 14 in April.
10:00 AM: Construction Spending for May. The consensus is for no change in construction spending.
10:00 AM: ISM Manufacturing Index for June. The consensus is for a decrease to 51.7 from 53.5 in May. Based on the regional manufacturing surveys, the ISM index could be below 50 for June (indicating contraction).
All day: Light vehicle sales for June. Light vehicle sales are expected to increase to 12.0 million (Seasonally Adjusted Annual Rate), from 11.8 million in May.
 This graph shows light vehicle sales since the BEA started keeping data in 1967. The dashed line is the May sales rate.
 Edmunds is forecasting:
The estimated sales volume translates to a Seasonally Adjusted Annualized Rate (SAAR) of 11.9 million in June, according to Edmunds.com analysts. Even with SAAR coming in below 12 million for the second month in a row, Edmunds.com continues to project an annual SAAR of 12.9 light vehicle sales overall in 2011.The supply chain disruption is impacting sales, however sales will probably pick up in Q3.
9:55 AM: Reuter's/University of Michigan's Consumer sentiment index (final for June). The consensus is for a slight increase to 72.0 from the preliminary reading of 71.8.
Best wishes to All!
Summary for Week Ending June 24th
by Calculated Risk on 6/25/2011 11:11:00 AM
Probably the three most talked about stories of the week were 1) the Greek financial situation, 2) the release of oil from the petroleum reserves, and 3) Fed Chairman Bernanke’s press briefing following the FOMC meeting.
Oil prices fell sharply after the announcement of oil releases from reserves. And gasoline prices are expected to continue to decline (Gasoline prices are already down over 30 cents per gallon from the recent peak).
There were no surprises with the FOMC announcement or during Bernanke’s press briefing. The Fed’s forecast for growth was revised down, and the forecast for the unemployment rate and inflation were revised up. The Fed believes that most of the recent economic weakness was temporary, and the increase in inflation was transitory. QE2 will end as scheduled and the Fed is clearly on hold waiting for additional data.
This was a light week for economic data: Home sales – both existing and new home sales – were weak. However durable goods orders were a little better this month, and there were several house price reports suggesting prices increased slightly in April (Case-Shiller will be released next Tuesday).
Below is a summary of economic data last week mostly in graphs:
• May Existing Home Sales: 4.81 million SAAR, 9.3 months of supply
The NAR reports: Existing-Home Sales Decline in May
 Click on graph for larger image in graph gallery.
This graph shows existing home sales, on a Seasonally Adjusted Annual Rate (SAAR) basis since 1993.
Sales in May 2011 (4.81 million SAAR) were 3.8% lower than last month, and were 15.3% lower than in May 2010.
 The next graph shows the year-over-year (YoY) change in reported existing home inventory and months-of-supply. Since inventory is not seasonally adjusted, so it really helps to look at the YoY change.
Inventory decreased 4.4% year-over-year in May from May 2010. This is the fourth consecutive month with a YoY decrease in inventory.
 Inventory should increase over the next couple of months months (the normal seasonal pattern), and the YoY change is something to watch closely this year.
This graph shows existing home sales Not Seasonally Adjusted (NSA).
The red columns are for 2011.
Sales NSA are well below the tax credit boosted level of sales in May 2010, but slightly above the level of May sales in 2009. The level of sales is still elevated due to investor buying.
• New Home Sales in May at 319 Thousand SAAR
The Census Bureau reports New Home Sales in May were at a seasonally adjusted annual rate (SAAR) of 319 thousand. This was down from a revised 326 thousand in April (revised from 323 thousand).
 This graph shows New Home Sales vs. recessions since 1963. The dashed line is the current sales rate.
Sales of new one-family houses in May 2011 were at a seasonally adjusted annual rate of 319,000 ... This is 2.1 percent (±10.7%)* below the revised April rate of 326,000, but is 13.5 percent (±13.6%)* above the May 2010 estimate of 281,000.
 Starting in 1973 the Census Bureau broke inventory down into three categories: Not Started, Under Construction, and Completed.
This graph shows the three categories of inventory starting in 1973.
The inventory of completed homes for sale fell to 64,000 units in May. The combined total of completed and under construction is at the lowest level since this series started.
 This graph shows sales NSA (monthly sales, not seasonally adjusted annual rate).
In May 2011 (red column), 30 thousand new homes were sold (NSA). The record low for May was 26 thousand in 2010 (following the expiration of the homebuyer tax credit) and now 2011. The high was 120 thousand in 2005.
Although above the consensus forecast of 305 thousand, this was just above the record low for May - and new home sales have averaged only 300 thousand SAAR since the expiration of the tax credit ... moving sideways at a very low level.
• AIA: Architecture Billings Index indicates declining demand in May
Note: This index is a leading indicator for new Commercial Real Estate (CRE) investment.
 This graph shows the Architecture Billings Index since 1996. The index decreased in May to 47.2 from 47.6 in April. Anything below 50 indicates a decrease in billings.
Note: Nonresidential construction includes commercial and industrial facilities like hotels and office buildings, as well as schools, hospitals and other institutions.
According to the AIA, there is an "approximate nine to twelve month lag time between architecture billings and construction spending" on non-residential construction. So this suggests another dip in CRE investment towards the end of this year - and into 2012.
• Moody's: Commercial Real Estate Prices declined 3.7% in April, Prices at new Post-Bubble Low
Moody's reported that the Moody’s/REAL All Property Type Aggregate Index declined 3.7% in April.
 Here is a comparison of the Moodys/REAL Commercial Property Price Index (CPPI) and the Case-Shiller composite 20 index. Beware of the "Real" in the title - this index is not inflation adjusted.
 CRE prices only go back to December 2000. The Case-Shiller Composite 20 residential index is in blue (with Dec 2000 set to 1.0 to line up the indexes).
According to Moody's, CRE prices are down 13% from a year ago and down about 49% from the peak in 2007. Prices are at new post-bubble lows - and at new lows for the index.
• Other Economic Stories ...
• From CoreLogic: CoreLogic® Reports Shadow Inventory Continues to Decline
• DOT: Vehicle Miles Driven decreased -2.4% in April compared to April 2010
• FOMC Statement: No Change, "Economic recovery is continuing at a moderate pace"
• FHA sells record number of REO in May, Freddie Mac Serious Delinquency Rate declines
• Q1 real GDP growth revised up to 1.9%, Durable-goods orders up 1.9%
Best wishes to all!
Unofficial Problem Bank list at 1,001 Institutions and Transition Matrix
by Calculated Risk on 6/25/2011 08:26:00 AM
Note: this is an unofficial list of Problem Banks compiled only from public sources. This post includes an update to the transition matrix (see comments and table at bottom).
Here is the unofficial problem bank list for June 24, 2011.
Changes and comments from surferdude808:
As anticipated, the FDIC released its actions for May 2011, which contributed to many changes to the Unofficial Problem Bank List. This week there are eight additions and three removals. The net five additions push the list back over the 1,000 threshold to 1,001. Assets total $419.2 billion, up $2.5 billion from last week. For the month of June, changes included 17 additions and 13 removals, with four from failure, two from unassisted mergers, and seven from action terminations.
Removals this week include the failed Mountain Heritage Bank, Clayton, GA ($104 million) and action terminations against Commercial State Bank of El Campo, El Campo, TX ($127 million) and Slovak Savings Bank, Pittsburgh, PA ($85 million). This month the FDIC terminated 13 consent orders and two Prompt Corrective Action orders, but, strangely, nine of the terminations were for banks that had failed.
Among the eight additions this week are Patriot Bank, Houston, TX ($1.3 billion); American Bank of the North, Nashwauk, MN ($644 million); and Stonebridge Bank, Exton, PA ($365 million). One other change of note includes the FDIC issuing a Prompt Corrective Action Order against Colorado Capital Bank, Castle Rock, CO ($718 million).
With this being the last Friday of the second quarter, it is time to update the transition matrix. The Unofficial Problem Bank List debuted on August 7, 2009 with 389 institutions with assets of $276.3 billion (see table below).
Over the past 22 months, about 49 percent or 192 institutions have been removed from the original list with 125 due to failure, 49 due to action termination, and 18 due to unassisted merger. About 32 percent of the 389 institutions on the original list have failed, which is substantially higher than the 12 percent figure usually cited by the media as the failure rate for institutions on the FDIC Problem Bank List.
Since the publication of the original list, another 1,009 institutions have been added. However, only 804 of those 1,009 additions remain on the current list as 205 institutions have been removed in the interim. Of the 205 interim removals, 134 were from failure, 44 were from an unassisted merger, 25 from action termination, and two from voluntary liquidation.
In total, 1,398 institutions have made an appearance on the Unofficial Problem Bank List and 259 or 18.5 percent have failed. Of the 397 total removals, the primary way of exit from the list is failure at 259 or 65 percent. Only 74 or 18.6 percent have been rehabilitated while another 62 or 15.6% have found merger partners. Total assets that have appeared on the list amount to $768.9 billion and $258.6 billion have been removed due to failure. The average asset size of removals from failure is nearly $1 billion.
| Unofficial Problem Bank List | |||
|---|---|---|---|
| Change Summary | |||
| Number of Institutions | Assets ($Thousands) | ||
| Start (8/7/2009) | 389 | 276,313,429 | |
| Subtractions | |||
| Action Terminated | 49 | (12,581,702) | |
| Unassisted Merger | 18 | (3,105,440) | |
| Voluntary Liquidation | 0 | - | |
| Failures | 125 | (169,470,405) | |
| Asset Change | (20,083,711) | ||
| Still on List at 6/24/2011 | 197 | 71,072,171 | |
| Additions | 804 | 348,177,411 | |
| End (6/24/2011) | 1001 | 419,249,582 | |
| Intraperiod Deletions1 | |||
| Action Terminated | 25 | 22,538,068 | |
| Unassisted Merger | 44 | 31,856,880 | |
| Voluntary Liquidation | 2 | 833,567 | |
| Failures | 134 | 89,146,292 | |
| Total | 205 | 144,374,807 | |
| 1Institution not on 8/7/2009 or 6/24/2011 list but appeared on a list between these dates. | |||
Friday, June 24, 2011
Las Vegas: Bubble Monuments
by Calculated Risk on 6/24/2011 09:39:00 PM
Steve Kanigher at the Las Vegas Sun presents several photos of bubble monuments in Nevada: Abandoned projects leave lasting reminder of economic crash
"It wasn’t long ago that hotels, high-rise condominiums and massive retail and office complexes sprang up in Southern Nevada seemingly faster than one could drive from one end of the valley to the other. Take that same drive today, though, and you’ll likely see vestiges of the Great Recession: partially built structures with exposed foundations or steel beams ..."Check out the photos ...
It sure seemed like projects with names like "Manhattan West" (see the 4th slide) or "Central Park West" were doomed.
Bank Failure #48 in 2011: Mountain Heritage Bank, Clayton, Georgia
by Calculated Risk on 6/24/2011 05:38:00 PM
From the FDIC: First American Bank and Trust Company, Athens, Georgia, Assumes All of the Deposits of Mountain Heritage Bank, Clayton, Georgia
As of March 31, 2011, Mountain Heritage Bank had approximately $103.7 million in total assets and $89.6 million in total deposits. ... The FDIC estimates that the cost to the Deposit Insurance Fund (DIF) will be $41.1 million. ... Mountain Heritage Bank is the 48th FDIC-insured institution to fail in the nation this year, and the fourteenth in Georgia.What a surprise ... a bank in Georgia fails. That is a pretty big percentage loss.
NY Times: Overbuilding in Spain
by Calculated Risk on 6/24/2011 05:31:00 PM
Oh my ...
From the NY Times: Overbuilding in Spain Leaves Many White Elephants
Last March, local officials inaugurated a brand new airport in Castellón, a small city on Spain’s Mediterranean coast. They are still waiting for the first scheduled flight.That made me laugh ...
Castellón Airport, built at a cost of €150 million, or $213 million, is not the only white elephant that now dots Spain’s infrastructure landscape. ... Across the country, nearly empty toll roads are struggling to turn a profit. Other projects are surviving only with continued public financing ...This sounds like a classic bubble attitude: "Build it and they will come". Just a reminder that during a bubble, every project seems to make sense ... on paper.
Hotels: Occupancy Rate increased 3.7 percent compared to same week in 2010
by Calculated Risk on 6/24/2011 01:55:00 PM
Here is the weekly update on hotels from HotelNewsNow.com: STR: Luxury segment leads weekly increases
Overall, the U.S. hotel industry’s occupancy rose 3.7% to 69.2%, ADR increased 3.3% to US$101.73, and RevPAR finished the week up 7.2% to US$70.37.Note: ADR: Average Daily Rate, RevPAR: Revenue per Available Room.
The following graph shows the seasonal pattern for the hotel occupancy rate using a four week average for the occupancy rate.
 Click on graph for larger image in graph gallery.
The summer leisure travel season is now starting, and the occupancy rate will increase over the next few of months. Right now the occupancy rate is tracking closer to 2008 than to 2010 - and well above 2009.
Even though the occupancy rate has mostly recovered back to 2008 levels, ADR and RevPAR are below the pre-recession levels.
Data Source: Smith Travel Research, Courtesy of HotelNewsNow.com
By request, here are links to the posts and graph for May Home Sales:
• New Home Sales in May at 319 Thousand SAAR
• May Existing Home Sales: 4.81 million SAAR, 9.3 months of supply
• Graph Galleries: New Home sales and Existing Home sales
FHA sells record number of REO in May, Freddie Mac Serious Delinquency Rate declines
by Calculated Risk on 6/24/2011 11:27:00 AM
A couple of updates ...
• FHA Sells record number of REO (Real Estate Owned) in May.
In Q1, Fannie and Freddie were foreclosing at record levels - and selling REO even faster - so their REO inventory actually declined. However, the FHA was apparently having REO inventory problems and the FHA's REO inventory increased in Q1.
It now appears the FHA REO problem has been solved. The FHA sold a record number of REO in April, and even more in May.
According to data from HUD (ht Keith Jurow), the FHA acquired 6,727 REO in May and sold a record 12,671 properties. The FHA REO inventory has declined from 69,9581 at the end of Q1 2011, to 60,587 at the end of May 2011. It appears REO at the F's will decline again in Q2.
1REO for March was revised up slightly.
• Freddie Mac reported that the Single-Family serious delinquency rate decreased to 3.53% in May from 3.57% in April. This is down from 4.06% in May 2010. Freddie's serious delinquency rate peaked in February 2010 at 4.20%.
The normal serious delinquency rate is under 1%, so this is still very high, but at least it is declining. (I'll post a graph when Fannie release their monthly delinquency report).
Note: These are loans that are "three monthly payments or more past due or in foreclosure".
Q1 real GDP growth revised up to 1.9%, Durable-goods orders up 1.9%
by Calculated Risk on 6/24/2011 08:30:00 AM
From the BEA: Gross Domestic Product: First Quarter 2011 (Third Estimate). This small upward revision, compared to the 2nd estimate, was because of a slight increase in Net exports, and a larger contribution from the change in private inventories - partially offset by a larger decrease in state and local government spending.
From the Census Bureau: Advance Report on Durable Goods Manufacturers’ Shipments, Inventories and Orders May 2011
New orders for manufactured durable goods in May increased $3.6 billion or 1.9 percent to $195.6 billion, the U.S. Census Bureau announced today. This increase, up two of the last three months, followed a 2.7 percent April decrease. Excluding transportation, new orders increased 0.6 percent. Excluding defense, new orders increased 1.9 percent.This was above the consensus of a 1.6 percent increase.
Thursday, June 23, 2011
Greece Update and European Bond and CDS Spreads
by Calculated Risk on 6/23/2011 07:57:00 PM
First from the WSJ: EU Stops Greek Backtracking
European Union leaders fended off an effort by Greece to water down an austerity and privatization package that is the price for new aid, and EU President Herman Van Rompuy said they were nearing approval on a new rescue program to take Athens until the end of 2014.More austerity ...
...
"We have a deal after the Greek government agreed to more spending cuts and some higher taxes," said the [Greek] official.
And here is a look at European bond spreads from the Atlanta Fed weekly Financial Highlights released yesterday (graph as of June 22nd).
From the Atlanta Fed:
Since the April FOMC meeting, the 10-year Greece-to-German bond spread has widened by nearly 400 basis points (bps) through June 22. The spreads for Ireland and Portugal have soared by 157 bps and 199 bps, respectively, over the same period.
 Click on graph for larger image in new window.
The spreads for Greece, Ireland and Portugal are all near record highs. The spreads for both Ireland and Portugal are about as high as Greece a couple of months ago!
Spreads for Spain and Italy have increased recently, but are still much lower than for Greece, Ireland and Portugal.
The second graph shows the Credit Default Swap (CDS) spreads:
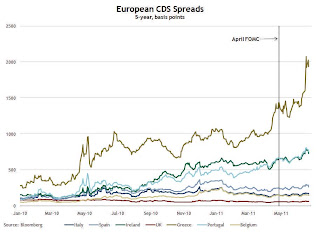 From the Atlanta Fed:
 The CDS spread on Greek debt has widened about 500 basis points (bps) since the April FOMC meeting, while those on Portuguese and Irish debt continue to be high.The Greek 2 year yield was up to 28.6% today. The ten year yield was up to 16.9%.


