 RSS Feed
 by Calculated Risk on 4/29/2011 07:20:00 PM
Friday, April 29, 2011
Bank Failures #35 through #39 in 2011
Five finance fatalities
Bereaving bankers.
by Soylent Green is People
From the FDIC: Premier American Bank, National Association, Miami, Florida, Acquires All the Deposits of Two Florida Banks, First National Bank of Central Florida, Winter Park and Cortez Community Bank, Brooksville
As of December 31, 2010, First National Bank of Central Florida had total assets of $352.0 million and total deposits of $312.1 million; and Cortez Community Bank had total assets of $70.9 million and total deposits of $61.4 million. ... The FDIC estimates that the cost to the Deposit Insurance Fund (DIF) for First National Bank of Central Florida will be $42.9 million; and for Cortez Community Bank, $18.6 million. ... The closings are the 35th and 36th FDIC-insured institutions to fail in the nation so far this yearFrom the FDIC: Bank of the Ozarks, Little Rock, Arkansas, Acquires All the Deposits of Two Georgia Banks, First Choice Community Bank, Dallas and The Park Avenue Bank, Valdosta
As of December 31, 2010, First Choice Community Bank had total assets of $308.5 million and total deposits of $310.0 million; and The Park Avenue Bank had total assets of $953.3 million and total deposits of $827.7 million. ... The FDIC estimates that the cost to the Deposit Insurance Fund (DIF) for First Choice Community Bank will be $92.4 million; and for The Park Avenue Bank, $306.1 million. ... The closings are the 37th and 38th FDIC-insured institutions to fail in the nation so far this yearFrom the FDIC: Talmer Bank & Trust, Troy, Michigan, Assumes All of the Deposits of Community Central Bank, Mount Clemens, Michigan
As of December 31, 2010, Community Central Bank had approximately $476.3 million in total assets and $385.4 million in total deposits ... The FDIC estimates that the cost to the Deposit Insurance Fund (DIF) will be $183.2 million. ... Community Central Bank is the 39th FDIC-insured institution to fail in the nation this year
LPS: Mortgage Delinquency Rates declined in March, Foreclosure pipeline "Bloated"
by Calculated Risk on 4/29/2011 04:55:00 PM
LPS Applied Analytics released their March Mortgage Performance data. From LPS:
• Delinquencies ended the quarter 12% lower than the end of last year, over 500,000 loans have left the delinquent pool over the last three months.
• New problem loan rates are at a three year low as fewer loans are going bad. At the same time, seasonal trends have helped support a large increase in monthly cure rates.
• March typically sees large seasonal declines in new delinquency rates, though this year was the second largest on record.
• Modification activity also contributes to the improved landscape with almost a quarter of 90+ delinquencies from last year now current on their payments.
• The foreclosure pipeline is still bloated with overhang at every level:
– There are almost twice as many loans deteriorating greater than 90+ days delinquent vs. starting foreclosure.• Origination activity has dropped off in early 2011 and due to much stricter underwriting, recent vintages have been performing exceptionally well.
– There are almost three times the number foreclosure starts vs. foreclosure sales.
– 90+ and foreclosure inventory levels are almost 45 times monthly foreclosure sales.
 Click on graph for larger image in graph gallery.
This graph provided by LPS Applied Analytics shows the percent delinquent and percent in foreclosure.
The percent in the foreclosure process has been trending up because of the foreclosure issues.
According to LPS, 7.78% of mortgages are delinquent (down from 8.80% in February), and a record 4.21% are in the foreclosure process (up from 4.15% in February) for a total of 11.93%. It breaks down as:
• 2.12 million loans less than 90 days delinquent.
• 1.99 million loans 90+ days delinquent.
• 2.22 million loans in foreclosure process.
For a total of 6.33 million loans delinquent or in foreclosure.
 The second graph shows the break down of foreclosures by days delinquent.
"31% of loans in foreclosure have not made a payment in over 2 years." So about one third of the 2.22 million loans in the foreclosure process haven't made a payment in over 2 years.
The decline in the delinquency rate is partially seasonal, but the sharp decline is a positive. A key problem is all those homes in the foreclosure process. As LPS notes: "Delinquencies have dropped to about 1.8 times the 1995-2005 average, foreclosure inventories are 8 times historical “norms”." There were only 94,780 foreclosure sales in March and 270,681 foreclosure starts - so the foreclosure inventory just keeps growing.
Q1 2011 Details: Investment in Office, Mall, and Lodging, Residential Components
by Calculated Risk on 4/29/2011 03:04:00 PM
The BEA released the underlying detail data today for the Q1 Advance GDP report. Here is a look at office, mall and lodging investment:
 Click on graph for larger image in new graph gallery.
This graph shows investment in offices, malls and lodging as a percent of GDP. Office investment as a percent of GDP peaked at 0.46% in Q1 2008 and has declined sharply to a new series low as a percent of GDP (data series starts in 1959).
Investment in multimerchandise shopping structures (malls) peaked in 2007 and has fallen by 70% (note that investment includes remodels, so this will not fall to zero). Mall investment is also at a series low (as a percent of GDP).
The bubble boom in lodging investment was stunning. Lodging investment peaked at 0.32% of GDP in Q2 2008 and has fallen by 80% already.
Notice that investment for all three categories typically falls for a year or two after the end of a recession, and then usually recovers very slowly (flat as a percent of GDP for 2 or 3 years). Something similar will probably happen again, and there will not be a recovery in these categories until the vacancy rates fall significantly.
The second graph is for Residential investment (RI) components. According to the Bureau of Economic Analysis, RI includes new single family structures, multifamily structures, home improvement, broker's commissions, and a few minor categories (dormitories, manufactured homes).
 This graph shows the various components of RI as a percent of GDP for the last 50 years. Usually the most important components are investment in single family structures followed by home improvement.
Investment in single family structures was just above the record low set in Q2 2009.
Investment in home improvement was at a $151.0 billion Seasonally Adjusted Annual Rate (SAAR) in Q1 (about 1.0% of GDP), significantly above the level of investment in single family structures of $106.3 billion (SAAR) (or 0.7% of GDP).
Brokers' commissions declined slightly in Q1, and are near the lowest level (as a percent of GDP) since the early '80s. In nominal dollar terms, brokers' commissions are back to the 1999 level.
And investment in multifamily structures has been bouncing along at a series low for the last few quarters, although this is expected to increase this year as starts increase.
These graphs show there is currently very little investment in offices, malls and lodging - and also very little investment in most components of residential investment. I expect investment in commercial real estate to bottom mid-year, but the recovery will not start until the vacancy rates fall. For Residential Investment, I expect RI to make a positive contribution to GDP this year for the first time since 2005 - mostly because of increases in multifamily investment and home improvement.
Restaurant Performance Index increases in March
by Calculated Risk on 4/29/2011 11:56:00 AM
This is one of several industry specific indexes I track each month.
 Click on graph for larger image in graph gallery.
The index increased to 101.0 in March (above 100 indicates expansion).
Unfortunately the data for this index only goes back to 2002.
From the National Restaurant Association: Restaurant Industry Outlook Gained Strength in March as Same-Store Sales, Customer Traffic Levels Continued to Improve
The National Restaurant Association’s Restaurant Performance Index (RPI) – a monthly composite index that tracks the health of and outlook for the U.S. restaurant industry – stood at 101.0 in March, up 0.3 percent from February and the third gain in the last four months. In addition, March represented the sixth time in the last seven months that the RPI stood above 100, which signifies expansion in the index of key industry indicators.Increased traffic and sales, and a positive outlook for capital spending and hiring ... another solid report.
“The March increase in the Restaurant Performance Index was fueled by continued improvements in the same-store sales and customer traffic indicators,” said Hudson Riehle, senior vice president of the Research and Knowledge Group for the Association. “Most notably, the overall Current Situation component of the RPI stood above 100 for the first time in 43 months, which signifies expansion in the indicators of current industry performance.”
...
Restaurant operators continued to report improvements in same-store sales in March. ... Restaurant operators also reported a net increase in customer traffic levels in March.
...
Along with an optimistic sales outlook, restaurant operators’ plans for capital spending rose to its highest level in 41 months.
...
For the sixth consecutive month, restaurant operators reported a positive outlook for staffing gains in the months ahead.
Earlier:
• Consumer Sentiment increases slightly in April compared to March
• Personal Income and Outlays Report for March
Consumer Sentiment increases slightly in April compared to March
by Calculated Risk on 4/29/2011 09:55:00 AM
• From the Chicago Business Barometer™ Tempered: "The Chicago Purchasing Managers reported the CHICAGO BUSINESS BAROMETER slackened but remained strong, indicating expanding economic activity for the nineteenth consecutive month. In response to special questions about the Japanese disaster, panelists reported minimal impact."
The overall index decreased to 67.6 from 70.6 in March. This was below consensus expectations of 69.2. Note: any number above 50 shows expansion. The employment index decreased to a still strong 63.7 from 65.6. This was another fairly strong report.
• The final April Reuters / University of Michigan consumer sentiment index decreased to 68.9 in April from the preliminary 69.6. This was up slightly from the March reading of 67.5.
 Click on graph for larger image in graphic gallery.
This was below the consensus forecast of 70.0.
In general consumer sentiment is a coincident indicator and is usually impacted by employment (and the unemployment rate) and gasoline prices.
This low reading is probably due to $4 per gallon gasoline prices.
Personal Income and Outlays Report for March
by Calculated Risk on 4/29/2011 08:30:00 AM
The BEA released the Personal Income and Outlays report for March:
Personal income increased $67.0 billion, or 0.5 percent ... Personal consumption expenditures (PCE) increased $60.7 billion, or 0.6 percent.Real PCE was revised up significantly for both January and February.
...
Real PCE -- PCE adjusted to remove price changes -- increased 0.2 percent in March, compared with an increase of 0.5 percent in February.
The following graph shows real Personal Consumption Expenditures (PCE) through March (2005 dollars). Note that the y-axis doesn't start at zero to better show the change.
 Click on graph for larger image in graph gallery.
PCE increased 0.5% in March, but real PCE only increased 0.2% as the price index for PCE increased 0.4 percent in March.
Note: Core PCE - PCE excluding food and energy - increased 0.1% in March.
 The second graph shows real personal income less transfer payments as a percent of the previous peak. This has been slow to recover - and real personal income less transfer payments declined slightly in March. This remains 3.1% below the previous peak.
The personal saving rate was unchanged at 5.5% in March.
Personal saving -- DPI less personal outlays -- was $651.2 billion in March, compared with $647.5 billion in February. Personal saving as a percentage of disposable personal income was 5.5 percent in March, the same as in February.
 This graph shows the saving rate starting in 1959 (using a three month trailing average for smoothing) through the March Personal Income report.
 One of the surprises in the Q1 GDP report was the 2.7% annualized growth rate for PCE. PCE growth in January and February was revised up significantly, and PCE in March increased at a 3.1% annualized rate (over the last 3 months).
Thursday, April 28, 2011
European Bond and CDS Spreads
by Calculated Risk on 4/28/2011 09:22:00 PM
Here is a look at European bond spreads from the Atlanta Fed weekly Financial Highlights released today (graph as of April 27th):
 Click on graph for larger image in new window.
From the Atlanta Fed:
Since the March FOMC meeting, peripheral European bond spreads (over German bonds) continue to be elevated, with those of Greece, Ireland, and Portugal setting record highs.The second graph shows the Credit Default Swap (CDS) spreads:
Since the March FOMC meeting, the 10-year Greece-to-German bond spread has widened by 189 basis points (bps), through April 26. The spreads for Ireland and Portugal have soared higher by 85 and 237 bps, respectively, over the same period.
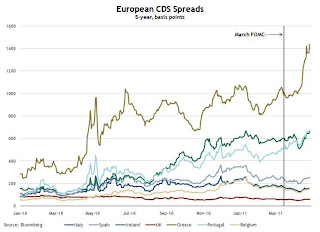 From the Atlanta Fed:
 The CDS spread on Greek debt has widened about 430 basis points (bps) since the March FOMC meeting, while those on Portuguese and Irish debt continue to be high.Here is a story from Reuters discussing the Greece CDS (and possible haircuts of 60%): Upward bias seen for Greek bond yields, trade choppy
The yield on Greece ten year bonds decreased to 15.7% today and the two year yield was down slightly to 24.9%.
Here are the ten year yields for Ireland at 10.4%, Portugal up to a record 9.7%, and Spain at 5.4%.
Earlier:
• Advance Report: Real Annualized GDP Grew at 1.8% in Q1
• Residential Investment and Non-Residential investment in Structures at Record Lows as Percent of GDP
Fannie Mae and Freddie Mac Delinquency Rates decline
by Calculated Risk on 4/28/2011 06:03:00 PM
Fannie Mae reported that the serious delinquency rate decreased to 4.44% in February from 4.45% in January. This is down from the all time high 5.59% in February 2010.
Freddie Mac reported that the serious delinquency rate decreased to 3.63% in March from 3.82% in February. (Note: Fannie reports a month behind Freddie). This is down from 4.13% in March 2010.
These are loans that are "three monthly payments or more past due or in foreclosure".
 Click on graph for larger image in graph gallery.
Some of the rapid increase in 2009 was probably because of foreclosure moratoriums, and also because loans in trial mods were considered delinquent until the modifications were made permanent. As modifications have become permanent, they are no longer counted as delinquent.
Although delinquencies typically decline in March, the decline for Freddie Mac delinquencies is larger than usual - and other data suggest the overall delinquency rate declined further in Q1. The MBA will release the Q1 National Delinquency Survey in May.
Earlier:
• Advance Report: Real Annualized GDP Grew at 1.8% in Q1
• Residential Investment and Non-Residential investment in Structures at Record Lows as Percent of GDP
Multifamily: Rents Rising, Record low completions, Starts increasing rapidly, more "hate" for owning
by Calculated Risk on 4/28/2011 03:04:00 PM
Here are some conference call comments from AvalonBay Communities, Inc (ht Brian). AVB has close to 50,000 apartment units. We've discussed many of these key point:
• The percent of residents moving out to purchase a home was at 12%; an all time record low (we are starting to feel the "hate" for owning).
• A record low number of multifamily units will be completed this year. AVB mentions starts of around 150,000 units this year, and probably 240,000 units next year (for delivery in 2013 and 2014). There were just over 100,000 multifamily starts in 2010, so there will be a strong increase this year.
• Rents are increasing - around 7% year-over-year for leases expiring in June (this probably includes some concessions last year). AVB is seeing some push back (moveouts) due to higher rents, but not a large number - this might limit future rent increases.
AVB: The factors driving the improvement in apartment fundamentals are reasonably well known. Probably most visibly is an improving economy, now generating approximately 200,000 new jobs per month. It's both the magnitude and the composition of the jobs that matter and importantly, a disproportionate share of the new jobs created have been in the under 35 age cohort. Over the past year, job growth in the younger age group has been at a rate more than two times than that of the economy as a whole. With more jobs, they are increasingly unbundling. Secondly, corporate investment and equipment and software is rising at an annual rate of approximately 15% nationally, setting off strong job growth in our key high tech markets such as San Jose, Seattle, and Boston. Another key factor affecting rental demand is the continued weakness in the for sale market. Yesterday, the first quarter homeownership data was released, which showed the homeownership rate falling once again, now down to 66.5%. The weakness in the for sale market provides an obvious and direct benefit to the rental market, with households that are increasingly choosing to rent versus buy. As you know, we tracked the reasons for moveout, and during the first quarter, the percent of residents moving out to purchase a home fell to 12%, down from 15% last quarter, and is now at the lowest level since we began tracking this data. Historically -- low to mid 20% range. The increase in rental housing demand is being met by a sharp reduction in the supply of new apartments. Just to put this into perspective, over the 10-year period from 1998 through 2008, there's an average of about 240,000 new rental completions per year. Last year, there were 160,000. And this year, completions are expected to be below 80,000 units, which would make it a 50-year low. This level of new completions is actually less than the estimated annual loss due to obsolescence, meaning that we're seeing essentially a net zero increase in the stock at a time of strong demand. Recently there's been a fair amount of discussion regarding the likelihood of an increased volume of new apartment starts, and there's little doubt that the volume will increase, it's important to remember that we're coming off of a 50-year low. For 2011, third party estimates project new rental starts in the range of about 150,000 new units, which is substantially below the 10-year average of 240,000 I previously mentioned. New starts are not expected to approach historical levels until late next year, 2012, which means it would likely not be until late '13 and into '14 that we'll see completions return to historical levels. And obviously it's the completions that are what's important in affecting the supply demand fundamentals. ...
AVB on Rents: Growth in portfolio rents is broad-based, as accelerating as we move into the peak leasing season in the second and third quarters, when over 60% of leases expire. During Q1, year-over-year growth in same-store revenues accelerated through the quarter from 3.2% in January to over 4% in March. This momentum is continuing, with April revenues projected to be up around 4.5%, driven by an average rental rate increase of 4.8% compared to April 2010. Renewal rates are continuing to escalate as well, with offers for renewal increases averaging around 7% per May lease expirations and over 8% for June expirations, up from around 5% April. For June, in Northern California, New York, New Jersey, and New England, the range is around 9 to 9.5%. Every region is experiencing acceleration and renewal increases, except the DC market, where renewal increases leveled off in the 7% range for June. As we mentioned last quarter, Seattle and Southern California had been lagging other regions in recovery. However, during Q1, these regions began to recover as they posted the highest levels of sequential rent growth for new leases over the quarter. Over the last three months alone, new lease rents, which are a blend of new move-ins and renewals, have risen in Seattle and Southern California by 9.5% and 6.5% respectively. Both of these regions have been helped by positive job growth over the last six months. With the recent improvement in Seattle and Southern California, every region is now experiencing improving performance. As the year progresses, we expect that the West Coast markets will continue to accelerate at a faster rate than the East Coast, although every region should continue to experience a healthy rate of growth.
Q&A:
Analyst: I just was wondering if you're seeing any pressure from rental housing?
AVB: We're not seeing anything new, any new pressure from rental housing. If you're alluding to, like, a gray market. If anything, we're seeing the gray market pull back. Whereas a year ago, I would have said there were certain submarkets where we saw more gray market activity. As I speak to the people that run the various regions, we're actually seeing less competition from that, that rental housing stock.
Analyst: What is the main reason moveouts are saying right now?
AVB: The top reason for move out that we're experiencing is when people are just relocating. But it's right consistent with historic averages. You know, as Bryce indicated, home purchase is an area where it's changed, where we're well under historic averages. And then related to rent increase or financial reasons, that's up. And that's up to around 14%, where it's typically run 8 to 10%.
Earlier:
• Advance Report: Real Annualized GDP Grew at 1.8% in Q1
• Residential Investment and Non-Residential investment in Structures at Record Lows as Percent of GDP
Kansas City Manufacturing Survey: Slower expansion in April
by Calculated Risk on 4/28/2011 12:18:00 PM
From the Kansas City Fed: Survey of Tenth District Manufacturing
Growth in Tenth District manufacturing activity moderated somewhat in April, but remained solid. Most producers continued to report healthyNote: both the composite index and employment index were at record highs last month. Any reading above zero indicates expansion.
expectations. Raw materials prices continued to rise, and more producers raised selling prices.
The month-over-month composite index was 14 in April, down from 27 in March and 19 in February. The employment index dropped from 25 to 17 ...
This is the last of the regional Fed surveys for April. The regional surveys provide a hint about the ISM manufacturing index, as the following graph shows.
 Click on graph for larger image in graph gallery.
The New York and Philly Fed surveys are averaged together (dashed green, through April), and averaged five Fed surveys (blue, through April) including New York, Philly, Richmond, Dallas and Kansas City. The Institute for Supply Management (ISM) PMI (red) is through March (right axis).
The regional surveys suggest the ISM manufacturing index will in the mid-to-high 50s range (fairly strong expansion). The ISM index for April will be released on Monday, May 2nd.
Earlier:
• Advance Report: Real Annualized GDP Grew at 1.8% in Q1
• Residential Investment and Non-Residential investment in Structures at Record Lows as Percent of GDP


