by Calculated Risk on 4/19/2011 02:05:00 PM
Tuesday, April 19, 2011
Housing: On pace for Record Low Completions in 2011
With just three months of data for 2011, it is already pretty clear that there will be a record low number of housing completions this year. Here is a look at the data so far ...
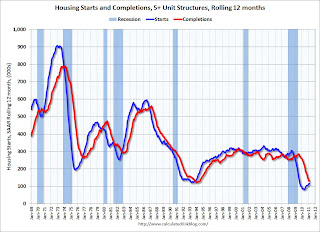
In general multi-family housing starts are trending up. Apartment owners are seeing falling vacancy rates, and some have started to plan for 2012 and will be breaking ground this year. However it takes about 13 months on average to complete a multi-family building, and the low level of starts in 2010 means a low level of completions this year.
The following graph shows this lag between multi-family starts and completions through March:
 Click on graph for larger image in graph gallery.
The blue line is for multifamily starts and the red line is for multifamily completions. Since multifamily starts collapsed in 2009, completions collapsed in 2010.
Notice that the blue line (Starts) is now trending up, and the red line (completions) is still falling. Based on starts in 2010, I expect mutlifamily completions to be around 100 thousand in 2011 - well below the 146.5 thousand in 2010, and below the previous record low of 127.1 thousand in 1993.
We can do a similar analysis for single family housing completions. Through March, about 90 thousand units have been completed (1 to 4 unit structures), and based on housing starts, another 200 thousand or so will be completed over the next 6 months (it takes about 6 months on average to complete single family structures). Even if starts increase over the next few months, it seems likely that 1 to 4 unit completions will be in the 400 thousand to 450 thousand range for the year - well below the previous record low of 505 thousand set in 2010.
 This graph shows annual completions for 1 to 4 units, 5+ units and manufactured homes (and an estimate for 2011)
In 2010, 1 to 4 unit completions were at a record low 505 thousand. This was just below the 535 thousand units completed in 2009 and was far below the previous record low of 712 thousand units in 1982. 1 to 4 units completions are currently on pace for another record low in 2011.
For 5+ units, completions were at 147 thousand units in 2010. This was just above the record low of 127 thousand in 1993 - and that record will be broken in 2011.
This doesn't include demolitions that were probably in the 200 thousand unit range (some estimate are as high as 300 thousand). This suggest the excess supply was reduced in 2010, and will probably be significantly reduced in 2011. Of course this also depends on household formation - and that means jobs.
Here is a table of housing units added to stock by year:
| 2005 | 2006 | 2007 | 2008 | 2009 | 2010 | 20111 | |
|---|---|---|---|---|---|---|---|
| 1 to 4 Units | 1,673.4 | 1,695.3 | 1,249.8 | 842.5 | 534.6 | 505.2 | 450.0 |
| 5+ Units | 258.0 | 284.2 | 253.0 | 277.2 | 259.8 | 146.5 | 100.0 |
| Manufactured Homes | 146.8 | 117.3 | 95.7 | 81.9 | 49.8 | 50 | 50 |
| Sub-Total | 2,078.2 | 2,096.8 | 1,598.5 | 1,201.6 | 844.2 | 701.7 | 600.0 |
| Demolitions | 200 | 200 | 200 | 200 | 150 | 150 | 150 |
| Total added to Stock | 1,878.2 | 1,896.8 | 1,398.5 | 1,001.6 | 694.2 | 551.7 | 450.0 |
1 Estimates for 2011.
2 Demolitions estimated (extra conservative for last few years).
This means a record low number of housing units will be added to the housing stock in 2011.
Special thanks to housing economist Tom Lawler who shared with me some of his thoughts on completions.


