 RSS Feed
 by Calculated Risk on 10/15/2010 12:56:00 PM
Friday, October 15, 2010
Inflation: Core CPI, Median CPI, 16% trimmed-mean CPI all very low
From Fed Chairman Ben Bernanke:
The significant moderation in price increases has been widespread across many categories of spending, as is evident from various measures that exclude the most extreme price movements in each period. For example, the so-called trimmed mean consumer price index (CPI) has risen by only 0.9 percent over the past 12 months, and a related measure, the median CPI, has increased by only 0.5 percent over the same period.The Cleveland Fed released the measures of inflation that Bernanke mentioned for September this morning:
According to the Federal Reserve Bank of Cleveland, the median Consumer Price Index was virtually unchanged at 0.0% (0.6% annualized rate) in September. The 16% trimmed-mean Consumer Price Index increased 0.1% (0.9% annualized rate) during the month. The median CPI and 16% trimmed-mean CPI are measures of core inflation calculated by the Federal Reserve Bank of Cleveland based on data released in the Bureau of Labor Statistics' (BLS) monthly CPI report.So these three measures: core CPI, median CPI and trimmed-mean CPI, were all below 1% in September, and also under 1% for the last 12 months.
Earlier today, the BLS reported that the seasonally adjusted CPI for all urban consumers rose 0.1% (1.2% annualized rate) in September. The CPI less food and energy was unchanged at 0.0% (0.0% annualized rate) on a seasonally adjusted basis.
Over the last 12 months, the median CPI rose 0.5%, the trimmed-mean CPI rose 0.8%, the CPI rose 1.1%, and the CPI less food and energy rose 0.8%
 Click on graph for larger image in new window.
This graph shows these three measure of inflation on a year-over-year basis.
They all show that inflation has been falling, and that measured inflation is up less than 1% year-over-year. Core CPI and median CPI were flat in September, and the 16% trimmed mean CPI was up 0.1%.
Note: The Cleveland Fed has a discussion of a number of measures of inflation: Measuring Inflation
Misc: Consumer Sentiment dips, CPI-W, and NY Fed Manufacturing Survey
by Calculated Risk on 10/15/2010 10:03:00 AM
So much data ...
From MarketWatch: Consumer sentiment edges lower in October
The preliminary Reuters-University of Michigan consumer sentiment index edged lower in October, falling to 67.9 ... from 68.2 last month.
 Click on graph for larger image in new window.
Consumer sentiment is a coincident indicator - and this suggests a sluggish economy.
This was a big story in July when consumer sentiment collapsed to the lowest level since late 2009. It has moved sideways since then ...
From the NY Fed: Empire State Manufacturing Survey
The Empire State Manufacturing Survey indicates that conditions improved in October for New York State manufacturers. The general business conditions index rose 12 points, to 15.7. The new orders and shipments indexes were also positive and well above their September levels.
...
The index for number of employees climbed for a third consecutive month, although the average workweek index dipped slightly.
 Here is a graph from the NY Fed.
These regional surveys had been showing a slowdown in manufacturing and are being closely watched right now. This was above expectations.
Retail Sales increase in September
by Calculated Risk on 10/15/2010 09:15:00 AM
On a monthly basis, retail sales increased 0.6% from August to September (seasonally adjusted, after revisions - August sales were revised up), and sales were up 7.3% from September 2009. This is an easy YoY comparison because of the slump in auto sales last September following Cash-for-Clunkers.
Retail sales increased 0.4% ex-autos - about at expectations.
 Click on graph for larger image in new window.
This graph shows retail sales since 1992. This is monthly retail sales, seasonally adjusted (total and ex-gasoline).
Retail sales are up 9.6% from the bottom, but still off 3.2% from the pre-recession peak.
Retail sales had moved mostly moved sideways for six months, but this is now the high for the year.
 The second graph shows the year-over-year change in retail sales (ex-gasoline) since 1993.
Retail sales ex-gasoline increased by 7.0% on a YoY basis (7.3% for all retail sales).
Here is the Census Bureau report:
The U.S. Census Bureau announced today that advance estimates of U.S. retail and food services sales for September, adjusted for seasonal variation and holiday and trading-day differences, but not for price changes, were $367.7 billion, an increase of 0.6 percent (±0.5%) from the previous month, and 7.3 percent (±0.7%) above September 2009. ... The July to August 2010 percent change was revised from +0.4 percent (±0.5%)* to +0.7 percent (±0.3%).
Bernanke: "Appears to be a case for further action"
by Calculated Risk on 10/15/2010 08:15:00 AM
From Fed Chairman Ben Bernanke: Monetary Policy Objectives and Tools in a Low-Inflation Environment
Given the Committee's objectives, there would appear--all else being equal--to be a case for further action. However, as I indicated earlier, one of the implications of a low-inflation environment is that policy is more likely to be constrained by the fact that nominal interest rates cannot be reduced below zero.This is less of a framework than I expected. There was one key paragraph on inflation:
...
For example, a means of providing additional monetary stimulus, if warranted, would be to expand the Federal Reserve's holdings of longer-term securities. Empirical evidence suggests that our previous program of securities purchases was successful in bringing down longer-term interest rates and thereby supporting the economic recovery.
...
Central bank communication provides additional means of increasing the degree of policy accommodation when short-term nominal interest rates are near zero. For example, FOMC postmeeting statements have included forward policy guidance since December 2008, and the most recent statements have reflected the FOMC's anticipation that exceptionally low levels of the federal funds rate are likely to be warranted "for an extended period," contingent on economic conditions. A step the Committee could consider, if conditions called for it, would be to modify the language of the statement in some way that indicates that the Committee expects to keep the target for the federal funds rate low for longer than markets expect. Such a change would presumably lower longer-term rates by an amount related to the revision in policy expectations. A potential drawback of using the FOMC's statement in this way is that, at least without a more comprehensive framework in place, it may be difficult to convey the Committee's policy intentions with sufficient precision and conditionality. The Committee will continue to actively review its communications strategy with the goal of providing as much clarity as possible about its outlook, policy objectives, and policy strategies.
Although the attainment of price stability after a period of higher inflation was a landmark achievement, monetary policymaking in an era of low inflation has not proved to be entirely straightforward. In the 1980s and 1990s, few ever questioned the desired direction for inflation; lower was always better. During those years, the key questions related to tactics: How quickly should inflation be reduced? Should the central bank be proactive or "opportunistic" in reducing inflation? As average inflation levels declined, however, the issues became more complex. The statement of the Federal Open Market Committee (FOMC) following its May 2003 meeting was something of a watershed, in that it noted that, in the Committee's view, further disinflation would be "unwelcome." In other words, the risks to price stability had become two-sided: With inflation close to levels consistent with price stability, central banks, for the first time in many decades, had to take seriously the possibility that inflation can be too low as well as too high.
Thursday, October 14, 2010
Foreclosure-Gate: The house that started it all
by Calculated Risk on 10/14/2010 11:59:00 PM
From David Streitfeld at the NY Times: From This House, a Foreclosure Freeze
The house that set off the national furor over faulty foreclosures is blue-gray and weathered. The porch is piled with furniture and knickknacks awaiting the next yard sale. In the driveway is a busted pickup truck.A very interesting story.
...
Nicolle Bradbury bought this house seven years ago for $75,000, a major step up from the trailer she had been living in with her family. But she lost her job and the $474 monthly mortgage payment became difficult, then impossible.
It should have been a routine foreclosure ...
Her file was pulled, more or less at random, by Thomas A. Cox, a retired lawyer who volunteers ... Mr. Cox realized almost immediately that Mrs. Bradbury’s foreclosure file did not look right. The documents from the lender, GMAC Mortgage, were approved by an employee whose title was “limited signing officer,” an indication to the lawyer that his knowledge of the case was effectively nonexistent.
Friday Preview: Bernanke, Retail Sales, CPI, and more
by Calculated Risk on 10/14/2010 07:43:00 PM
Friday will be really busy with several key releases, many at the same time (8:30 AM ET).
I'll start off posting Fed Chairman Ben Bernanke's speech, and I'll probably wait a little while to post on retail sales (Bernanke will probably discuss QE2, but I think he might outline what the Fed will do if QE2 doesn't achieve the desired goals).
On CPI, the release tomorrow will confirm that there will be no increase in Social Security benefits in 2011 - and no increase in the maximum contribution base ($106,800 same as in 2009 and 2010). For an explanation, see: No increase to Social Security Benefits for 2011 (unofficial)
Here is the economic release schedule for tomorrow ...
8:15 AM ET: Fed Chairman Ben S. Bernanke will speak at the Federal Reserve Bank of Boston Conference "Monetary Policy Objectives and Tools in a Low-Inflation Environment"
8:30 AM: Consumer Price Index for September. The consensus is for a 0.2% increase in prices. This is being closely watched for further disinflation, and also because Q3 is the quarter the annual annual cost-of-living adjustment (COLA) is calculated for Social Security (this will make it official that there will be no change in 2011).
8:30 AM: Retail Sales for September. The consensus is for a 0.4% increase from August.
8:30 AM: Empire Manufacturing Survey for October. The consensus is for a reading of 8.0, up from 4.1 in September. These regional surveys have been showing a slowdown in manufacturing and are being closely watched right now.
9:15 AM: Atlanta Fed President Dennis Lockhart participates in a question-and-answer session on the economy in Atlanta.
9:55 AM: Reuters/University of Mich Consumer Sentiment preliminary for October. The consensus is for a slight increase to 69.0 from 68.2 in September.
10:00 AM: Manufacturing and Trade: Inventories and Sales for August. Consensus is for a 0.4% increase in inventories in August.
Early Third Quarter GDP Forecast
by Calculated Risk on 10/14/2010 04:44:00 PM
From Catherine Rampell at the NY Times Economix: Third-Quarter G.D.P. Forecast Revised Down
Macroeconomic Advisers ... has just downgraded its estimate for third-quarter annual output growth to a measly 1.2 percent.My early guess is real PCE growth will come in around 2.0% in Q3. Since PCE is about 70% of GDP, that gives a contribution to GDP of 1.4 percentage points at an annual rate.
Residential investment (RI) will probably subtract close to 0.6 or more percentage points. Equipment and software will be positive and mostly offset the decline in RI. Government spending will also probably make a negative contribution. All of that puts us close to 1.0% annualized real GDP growth in Q3 before ..
Still unknown are the contributions from the trade balance and changes in inventories. With the higher than expected trade deficit in August, the contribution from trade could be close to zero. I expect a small positive contribution from inventories - so I think the 1.2% estimate is probably close (I'd guess closer to 1.5%).
It sure seems like the 2nd half slowdown is intact. And I expect PCE growth to slow in Q4 - but I think that will be offset with residential investment probably being somewhat flat (as opposed to the negative contribution in Q3).
The advance Q3 GDP report will be released on Oct 29th, and that is probably the last economic release standing between the Fed and QE2. Based on this early forecast, QE2 will arrive on Nov 3rd ...
Freddie Mac: 30 year Mortgage Rates fall to 4.19 percent, lowest since 1951
by Calculated Risk on 10/14/2010 03:10:00 PM
From Freddie Mac: 30-Year FRM Under 5 Percent for 23 Consecutive Weeks
Freddie Mac today released the results of its Primary Mortgage Market Survey® (PMMS®), which found that the 30-year fixed-rate mortgage rate fell again to break the survey’s all-time low; the 30-year FRM has been under 5 percent for 23 weeks in a row. The last time 30-year FRM rates were this low was April 1951 (based on a data series of FHA rates going back to 1948). The 5-year ARM tied the all-time survey low set last week.
...
30-year fixed-rate mortgage (FRM) averaged 4.19 percent with an average 0.8 point for the week ending October 14, 2010, down from last week when it averaged 4.27 percent. Last year at this time, the 30-year FRM averaged 4.92 percent.
Hotel Performance: RevPAR up 8.8% compared to same week in 2009
by Calculated Risk on 10/14/2010 12:43:00 PM
Hotel occupancy is one of several industry specific indicators I follow ...
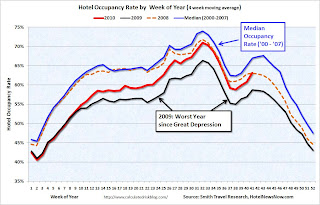
Important: Even though the occupancy rate is close to 2008 levels, 2010 is a much more difficult year for the hotel industry than 2008. RevPAR (revenue per available room) is up 8.8% compared to 2009, but still down 4.1% compared to 2008 - and 2008 was a very difficult year for the hotel industry.
From HotelNewsNow.com: STR: Economy ADR performance falls short
Overall, the industry’s occupancy increased 6.5% to 63.6%, ADR was up 2.2% to US$101.58, and revenue per available room ended the week up 8.8% to US$64.62.The following graph shows the four week moving average for the occupancy rate by week for 2008, 2009 and 2010 (and a median for 2000 through 2007).
 Click on graph for larger image in new window.
Notes: the scale doesn't start at zero to better show the change. The graph shows the 4-week average, not the weekly occupancy rate.
On a 4-week basis, occupancy is up 7.4% compared to last year (the worst year since the Great Depression) and 5.8% below the median for 2000 through 2007.
The occupancy rate is about at the levels of 2008, but RevPAR is still down 4.1%.
Data Source: Smith Travel Research, Courtesy of HotelNewsNow.com
Trade Deficit increases sharply in August
by Calculated Risk on 10/14/2010 09:10:00 AM
The Census Bureau reports:
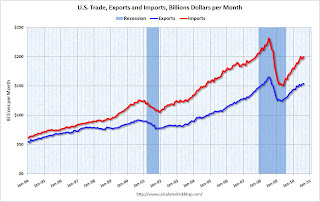
[T]otal August exports of $153.9 billion and imports of $200.2 billion resulted in a goods and services deficit of $46.3 billion, up from $42.6 billion in July, revised.
 Click on graph for larger image.
The first graph shows the monthly U.S. exports and imports in dollars through August 2010.
After trade bottomed in the first half of 2009, both imports and exports increased significantly. However in 2010 export growth has slowed, and imports have been increasing much faster than exports.
The second graph shows the U.S. trade deficit, with and without petroleum, through August.
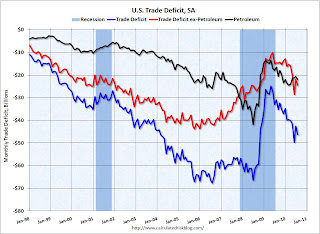 The blue line is the total deficit, and the black line is the petroleum deficit, and the red line is the trade deficit ex-petroleum products.
The increase in the deficit in August was due to both oil and China, although the bulk of the increase was because of trade with China. The trade deficit with China increased to $28.0 billion in August from $25.9 billion in July (NSA).
The imbalances have returned ...


