 RSS Feed
 by Calculated Risk on 7/26/2010 02:20:00 PM
Monday, July 26, 2010
Survey shows house prices falling in June, but long wait for house price indexes
Campbell Surveys put out a press release this morning: Home Prices Tumble in Most Categories During June (no link)
A drop in homebuyer activity helped trigger a noticeable decline in home prices between May and June, according to the latest Campbell/Inside Mortgage Finance Monthly Survey of Real Estate Market Conditions.We already know existing home sales collapsed in July, however, as Popik notes, it will take some time for the impact on house prices to show up in the house price indexes.
...
Average prices tumbled by 6.8% for move-in ready foreclosed properties, 6.3% for short sales, and 4.6% for non-distressed properties.
...
“Prices are dropping…same house that had 2 showings a day in April with hopes of a closing by June at $139,000 now gets a showing of just one a week if we are lucky and at $129,000,” reported a real estate agent responding to the survey and located in Florida.
“Buyers just plan on deducting the $8,000 off what they are going to offer now. So, now prices are dropping to compensate for the credit not being available,” stated an agent located in Ohio.
...
“Contracts signed in June will be closing in July and August,” explained [Thomas Popik, research director for Campbell Surveys]. “That’s why we know prices for closed transactions will continue their decline. But this won’t be reflected in the publicly-released price indexes until October or November.”
The Case-Shiller index is a three month average and is released with a two month lag. The Case-Shiller house price index to be released tomorrow will be for a three month average ending in May.
The first Case-Shiller release with July prices will be released at the end of September - and that will include the months of May, June and July! And prices were probably up in May and June.
And prices don't fall overnight. Based on the timing of the above survey, prices fell from May to June - and those transactions will probably mostly closed in August. That is why Popik is saying the price declines will not show up in house price indexes until October of November.
The Corelogic data for July will also be released in September. There are other repeat sales measures (like from Radar Logic and Clear Capital), but in general it will be a long wait before reported house prices are falling.
Dallas Fed: Manufacturing Activity Remains Sluggish in July
by Calculated Risk on 7/26/2010 11:51:00 AM
Usually I don't post all the regional manufacturing surveys, however with the inventory adjustment over, export growth appearing to slow, and domestic consumer demand sluggish, these surveys might provide a hint of weakness in the manufacturing sector.
From the Dallas Fed: Texas Manufacturing Activity Remains Sluggish
Texas factory activity rebounded slightly in July, according to business executives responding to the Texas Manufacturing Outlook Survey. The production index, a key indicator of state manufacturing conditions, rose from –2 to 5, suggesting output expanded slightly in July after contracting in June.Although production was up slightly, new orders were down sharply. This was a weak report - I'll post a summary of the regional reports later this week.
Several indexes for factory activity continued to fall in July. The new orders and growth rate of orders indexes pushed deeper into negative territory, indicating a further contraction of demand. The index for capacity utilization dipped to –1, its first negative reading in nine months. The shipments index stabilized in July, rising from –9 to –1, with nearly equal shares of respondents noting an increase or decrease.
The general business activity index fell sharply to –21, its lowest level since July 2009. Thirty-one percent of firms reported a worsening of activity, up from 22 percent in June. The company outlook index also fell to a 12-month low, as only 13 percent of manufacturers said their outlook had improved over the previous month, compared with 24 percent who said it had worsened.
The employment index edged up and was positive for the fifth consecutive month, with 20 percent of firms reporting new hires.
New Home Sales: Worst June on Record
by Calculated Risk on 7/26/2010 10:00:00 AM
Ignore all the month to previous month comparisons. May was revised down sharply and that makes the increase look significant. Here is the bottom line: this was the worst June for new home sales on record.
The Census Bureau reports New Home Sales in June were at a seasonally adjusted annual rate (SAAR) of 330 thousand. This is an increase from the record low of 267 thousand in May (revised from 300 thousand).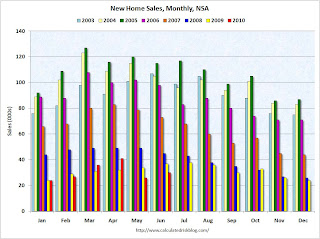 Click on graph for larger image in new window.
The first graph shows monthly new home sales (NSA - Not Seasonally Adjusted).
Note the Red columns for 2010. In June 2010, 30 thousand new homes were sold (NSA). This is a new record low for June.
The previous record low for the month of June was 34 thousand in 1982; the record high was 115 thousand in June 2005.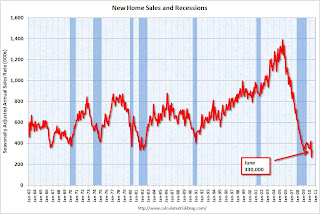 The second graph shows New Home Sales vs. recessions for the last 47 years.
Sales of new single-family houses in June 2010 were at a seasonally adjusted annual rate of 330,000 ... This is 23.6 percent (±15.3%) above the revised May rate of 267,000, but is 16.7 percent (±10.9%) below the June 2009 estimate of 396,000.And another long term graph - this one for New Home Months of Supply.
 Months of supply decreased to 7.6 in June from a revised 9.6 in May (revised from 8.5). The all time record was 12.4 months of supply in January 2009. This is still very high (less than 6 months supply is normal).
 The seasonally adjusted estimate of new houses for sale at the end of June was 210,000. This represents a supply of 7.6 months at the current sales rate.
 The final graph shows new home inventory.
 The 267 thousand annual sales rate for May is the all time record. This is a very sharp downward revision.
The 330 thousand in June is the worst June on record. With all the gyrations, it is difficult to see what is happening month to month, but overall this was a very weak report.
Chicago Fed: Economic activity declined in June
by Calculated Risk on 7/26/2010 08:30:00 AM
Note: This is a composite index based on a number of economic releases.
From the Chicago Fed: Index shows economic activity declined in June
Led by deterioration in production- and employment-related indicators, the Chicago Fed National Activity Index declined to –0.63 in June, down from +0.31 in May. Three of the four broad categories of indicators that make up the index made negative contributions in June, while the sales, orders, and inventories category made the lone positive contribution.
The index’s three-month moving average, CFNAI-MA3, decreased to –0.05 in June from +0.31 in May. The CFNAI-MA3 suggests that growth in national economic activity returned very close to its historical trend in June after reaching its highest level since March 2006 in May. With regard to inflation, it indicates subdued inflationary pressure from economic activity over the coming year.
 Click on table for larger image in new window.
This graph shows the Chicago Fed National Activity Index (three month moving average) since 1967. According to the Chicago Fed:
A zero value for the index indicates that the national economy is expanding at its historical trend rate of growth; negative values indicate below-average growth; and positive values indicate above-average growth.This is a compositive of other indicators. June was definitely a weak month.
Sunday, July 25, 2010
European Stress Tests: Not very stressful
by Calculated Risk on 7/25/2010 07:32:00 PM
It was announced last week that the stress tests didn't consider a sovereign default, and here is more ...
From David Enrich at the WSJ: Europe's 'Stress Tests' Relied on Mild Assumptions (ht jb)
In some of the 20 countries that conducted the tests, regulators figured that property values would keep rising or hold steady in a worst-case economic scenario.These are the two assumptions that put the most stress on households - lost jobs and negative equity. I guess in some European countries property prices only go up, and the unemployment rate only goes down.
In other cases, unemployment rates in a double-dip recession crept up by as little as 0.1 percentage point from the tests' so-called benchmark scenario, which is based on current economic conditions.
Earlier today: Weekly Summary and Schedule, July 25th
Yesterday: Sovereign default Part 5B. What Happens If Things Go Really Badly? More Things Can Go Badly: Credit Default Swaps, Interest Swaps and Options, Foreign Exchange
Private Investment?
by Calculated Risk on 7/25/2010 03:38:00 PM
The WSJ is quoting Treasury Secretary Timothy Geithner as saying it is time for private investment to take over from government stimulus:
“We need to make that transition now to a recovery led by private investment,” Mr. Geithner said Sunday on NBC’s “Meet the Press.”I discussed this last week - in most sectors of the economy there is over capacity or too much supply (housing), so there is no reason for significant new private investment.
...
“I think the most likely thing is you’ll see an economy that gradually strengthens over the next year or two, you’ll see job growth start to come back, investments expanding ... but we’ve got a long way to go still,” Mr. Geithner said.
Earlier today: Weekly Summary and Schedule, July 25th
Yesterday: Sovereign default Part 5B. What Happens If Things Go Really Badly? More Things Can Go Badly: Credit Default Swaps, Interest Swaps and Options, Foreign Exchange
Weekly Summary and Schedule, July 25th
by Calculated Risk on 7/25/2010 11:29:00 AM
The focus this week will be on the Q2 GDP report to be released on Friday. There are also two key housing reports: New Home Sales on Monday and Case-Shiller house prices on Tuesday.
On Monday, the June Chicago Fed National Activity Index will be released at 8:30 AM. This is a composite index of other data.
At 10 AM on Monday, the Census Bureau will release the New Home Sales report for June. The consensus is for a slight increase to 310 thousand at a seasonally adjusted annual rate (SAAR) from the record low 300 thousand in May.
Also on Monday, the Dallas Fed Manufacturing survey for July will be released at 10:30 AM. This is one of several regional surveys that will be released this week. Usually I don't highlight the minor regional reports, but right now I'm looking for hints of a slowdown in industrial production.
On Tuesday, the May Case-Shiller house price index will be released at 9:00 AM. The consensus is for a slight increase in the house price index. At 10:00 AM, the Conference Board will release Consumer Confidence for July (consensus is for a slight decrease from June). Also at 10:00 AM, the Richmond Fed Manufacturing Survey for July will be released.
Also at 10 AM Tuesday, the Census Bureau will release the Q2 Housing Vacancies and Homeownership report. This report provides the homeownership rate and estimates of the homeowner and rental vacancy rates.
On Wednesday, the MBA mortgage purchase index will be released. The purchase index is at the same level as in 1996 – suggesting further weakness in housing. Also on Wednesday, the June Durable Goods Orders will be released at 8:30 AM. The consensus is for a 1.0% increase.
Also on Wednesday, at 2 PM ET, the Fed will release the Beige Book for July. This will be closely scrutinized for further evidence of a 2nd half slowdown.
On Thursday, the initial weekly unemployment claims will be released. Consensus is for a decline to 460 thousand from 464 thousand last week. Also on Thursday, the Kansas City Fed Manufacturing survey will be released at 11 AM.
And on Friday, at 8:30 AM, the BEA will release the Q2 GDP report. The consensus is for real annualized GDP growth of 2.5% in Q2, down from a sluggish 2.7% in Q1. Also on Friday, the Chicago Purchasing Manager index for July will be released at 9:45 AM. And the FDIC will probably be busy on Friday afternoon ...
And a summary of last week:
 Click on graph for larger image in new window.
This graph shows existing home sales, on a Seasonally Adjusted Annual Rate (SAAR) basis since 1993.
Sales in June 2010 (5.37 million SAAR) were 5.1% lower than last month, and were 9.8% higher than June 2009 (4.89 million SAAR).
 The second graph shows nationwide inventory for existing homes.
According to the NAR, inventory increased to 3.99 million in June from 3.89 million in May. The all time record high was 4.58 million homes for sale in July 2008.
Months of supply increased to 8.9 months in June from 8.3 months in May. A normal market has under 6 months of supply, so this is already high - and probably excludes some substantial shadow inventory.
The next graph shows the year-over-year (YoY) change in reported existing home inventory and months-of-supply. Inventory is not seasonally adjusted, so it really helps to look at the YoY change.
 Inventory increased 4.7% YoY in June. This is the third consecutive month of a year-over-year increases in inventory, and this is the largest YoY increase since early 2008.
 This increase in inventory is especially bad news because the reported inventory is already historically very high, and the 8.9 months of supply in June is well above normal.
The months-of-supply will jump in July as sales collapse - probably to double digits - and a double digit months-of-supply would be a really bad sign for house prices ...
This was another a weak report. Sales were slightly above expectations (5.37 million at a seasonally adjusted annual rate vs. expectations of 5.3 million), but the YoY increase in inventory and the increase in months-of-supply are the real stories.
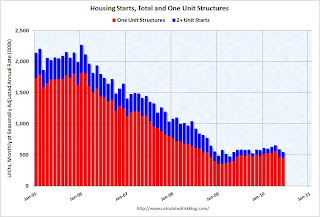 Total housing starts were at 549 thousand (SAAR) in June, down 5% from the revised May rate of 578,000 (revised down from 593 thousand), and up 15% from the all time record low in April 2009 of 477 thousand (the lowest level since the Census Bureau began tracking housing starts in 1959).
 Single-family starts declined 0.7% to 454,000 in June. This is 26% above the record low in January 2009 (360 thousand).
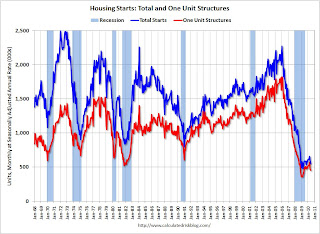 This graph shows total and single unit starts since 1968. This shows the huge collapse following the housing bubble, and that housing starts have mostly been moving sideways for over a year.
This was way below expectations of 580 thousand (I took the under!), and is good news for the housing market longer term (there are already too many housing units), but bad news for the economy and employment short term.
 This graph shows the builder confidence index from the National Association of Home Builders (NAHB).
The housing market index (HMI) was at 14 in June. This is the lowest level since April 2009.
The record low was 8 set in January 2009, but 14 is very low ...
Note: any number under 50 indicates that more builders view sales conditions as poor than good.
Note: This index is a leading indicator for new Commercial Real Estate (CRE) investment.
 This graph shows the Architecture Billings Index since 1996. The index has remained below 50, indicating falling demand, since January 2008.
Note: Nonresidential construction includes commercial and industrial facilities like hotels and office buildings, as well as schools, hospitals and other institutions.
This suggests the slump for commercial real estate design is ongoing. According to the AIA, there is an "approximate nine to twelve month lag time between architecture billings and construction spending" on non-residential construction. So there will probably be further declines in CRE investment into 2011.
Best wishes to all.
More State and Local Government Layoffs and the Pension Crisis
by Calculated Risk on 7/25/2010 08:36:00 AM
From Tom Abate at the San Fransicso Chronicle: Public pensions put state, cities in crisis
The recent layoff of 80 police officers in Oakland could be the harbinger of things to come ...The author argues that many of these layoffs are happening because pensions are straining state and local government budgets.
"This is not unique to Oakland," said Ron Cottingham, president of the Police Officers Research Association of California. "Stockton is having this happen. So is Sacramento."
The article contains some information on a recent scandal and the size of most pensions:
[T]he city of Bell (Los Angeles County) ... has been paying its city manager nearly $800,000 a year and setting him and other highly paid local officials up for huge pensions.The pension problem is a long term issue, but in the short term, the state and local government layoffs will contribute to the unemployment problem.
Scandals like this fuel public outrage and overshadow the reality that while abuses occur, and fatter pension payouts are on the rise, the average CalPERS beneficiary currently gets just over $24,000 a year, and 78 percent of all the fund's recipients get $36,000 or less.
Saturday, July 24, 2010
Charlie Rose: Geithner on Financial Regulatory Reform and Elizabeth Warren
by Calculated Risk on 7/24/2010 08:25:00 PM
Early today: Part 5B of Sovereign default series: What Happens If Things Go Really Badly? More Things Can Go Badly: Credit Default Swaps, Interest Swaps and Options, Foreign Exchange
Here is the full interview at CharlieRose.com.
Charlie Rose (about 6 mins): "Will Professor Elizabeth Warren be the new director of the consumer agency?"
Treasury Secretary Timothy Geithner: "She is a incredibly capable effective advocate for reform. She was way ahead of her time - way ahead of the country - in pointing out what was actually happening in the credit business. All the bad stuff that was happening. The looming housing crisis. She was pioneering in pointing out those risks. And she is the most effective advocate of reform we have in the country on these questions. And obviously I think she would do a great job in that position."
Charlie Rose: "She has the qualities you are looking for?"
Geithner: "Absolutely. Without a doubt."
A short preview (doesn't include Warren comments).
More new condo inventory
by Calculated Risk on 7/24/2010 04:30:00 PM
Another update on condos as shadow inventory ...
From Roger Vincent at the LA Times: Luxury condo tower in Century City is completed
The prices, exceeding $2,700 per square foot, were a record high for Los Angeles-area condos. ... In recognition that times have changed, developer Related Cos. reduced prices as much as 25% on the building's 140 units. ... About 25% of the building's residential space has been sold or is in escrow ...So 75% are still for sale.
A handful of other deluxe condominium projects have opened in recent months
There are some areas - like Las Vegas and Miami - that have a huge number of vacant high rise condos. But there are also many smaller buildings that are mostly vacant in a number of cities (like in New York, Chicago, San Diego, Raliegh, N.C. and Irvine, Ca).
Unless the high rise condos are listed for sale, they are not included in either the new home inventory report (from the Census Bureau) or the existing home inventory report (from NAR). They are part of the shadow inventory ...


