 RSS Feed
 by Calculated Risk on 7/14/2010 08:55:00 PM
Wednesday, July 14, 2010
Part 4. What are Total Estimated Losses on Sovereign Bonds Due to Default?
CR Note: This series is from reader "some investor guy".
In Part 3, we showed that credit default swaps imply that 7.4% of sovereign debt will default over the next 5 years. However, the defaulted bonds probably would not lose all of their value.
In some cases, losses given default are quite small, a few percent. In some restructurings, only the durations are changed, and a technical default might not result in an actual loss. At the opposite end of the spectrum, losses on a particular bond could be 100%, especially if a sovereign had junior or subordinate debt.
To estimate losses, in addition to the Probability of Default, we need to estimate Recovery Rates Given Default.
Moody’s has studied sovereign default recoveries in the past several decades (Source: Sovereign Default and Recovery Rates, 1983-2008). Recovery rates have ranged from 18% (Russia, 1998) to 95% (Dominican Republic, 2005), when measured on all debt from a particular sovereign at the time of default. The average recovery rate was 50% when each country was weighted equally, but only 31% when weighted by the face value of all outstanding bonds from all defaulting issuers.
Applying those recovery rates leads to expected losses of $1.3 to 1.8 trillion, or about 3.7 - 5.1% of outstanding sovereign debt at 12/31/09, and about $100 billion more at 6/30/10. We now have our baseline estimate of worldwide sovereign default losses.
This might not sound too bad, unless you happen to live in one of the defaulted countries, or own a lot of that country’s bonds.
Even at the baseline $1.3 to $1.8 trillion, those losses would be about the size of all outstanding debt of China, Germany, or France. And, default losses aren’t the only losses which could be occurring in your bond portfolio. For example, if Greek bonds default, Irish interest rates might go up substantially, and Ireland might merely be in pain rather than in default. In that case, if you purchased Irish bonds before the crisis, their market value might drop substantially below what you paid. Hopefully you didn’t buy them using leverage. If the bonds aren’t denominated in your native currency, you could be experiencing large FX losses.
Ubernerd warning. This part of the post contains pictures, but is also pretty technical.
Some posters have asked, “why not use the CDS prices themselves, which contain information on both the default probabilities and expected recoveries?” Well, if the two are separated, you are able to do certain things in modeling that are impossible to calculate with them jumbled together. It is easier to compare to historic data which often tracks the occurrence of default, but not the recovery. It allows you to do frequency-severity simulations.
For you ubernerds, it also means that you can model and correlate frequency and severity separately. Would you change your estimate of severity of loss on Greek bonds if you thought Spain and Italy would also default? Do you think that the probability of default goes up each time debt needs to be rolled over, but the recoveries given default won’t move much? Then the common assumption of 40% recovery rate doesn’t work with your model.
 Click on graph for larger image in new window.
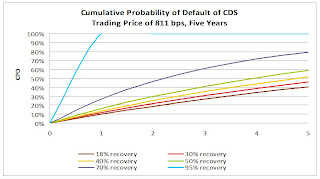
Here is a chart derived from a large bank’s presentation on sovereign CDS modeling which shows just how different your cumulative probability of default could be for a sovereign like Greece which closed at 811 basis points yesterday (July 13, 2010). The differences get pretty big, pretty fast. I’ve used the same historic range of 18% to 95% recovery rates to illustrate this. It’s pretty obvious that the CDS market doesn’t expect 95% recoveries from Greece. However, there are many combinations of probability of default and recovery rate which are consistent with current pricing.
For those of you who followed the subprime crisis closely, some common CDS modeling assumptions may sound familiar. My favorite misnomer is “discount cashflows at the risk-free rate”. There IS no truly riskfree rate. (CR note: by "riskfree", usually people mean essentially default risk free like U.S. treasuries. "Some investor guy" is pointing out there is still interest rate risk). There might be interest rates on a security incredibly unlikely to default. However, interest rates on that security will still move around, introducing plenty of risk which has nothing to do with default. Do you think that commonly used “riskfree” rates like 30 day LIBOR or 90 day US Treasuries might fluctuate and diverge in a crisis? Like they did in 2008 and 2009?
 There appears to be another market behavior which you might not expect unless you had seen it before: very strong correlations of securities which don’t appear to have the same underlying risks. Take a look at these charts on CDS prices for example. These may be artifacts of how people are funding, leveraging, or hedging their positions.
 The short term correlations are so strong that only events like Hungary’s “whoops, we didn’t really mean that” event stand out.
Source: CMA Sovereign Risk Report for Q2 2010
The strong correlations aren’t just in prices, those correlations also occur in trading volume. (see chart 4 below) It would not be surprising to find correlation desks at major traders generating lots of this volume. Who is trading, why, and how, are important in guessing what might happen if things go really badly.
Source: CMA CDS Liquidity Study
 Next in the series
The baseline losses from today’s article are certainly not the maximum possible number. For example, what would happen if Japan defaulted? That’s in Part 5, What if Things Go Really Badly?
In Part 6, we will talk about some of the indirect effects, which can cause distress through other mechanisms besides the original default(s).
CR Note: This is from "Some investor guy". Over the next week , some investor guy will address several questions: What are total estimated losses on sovereign bonds due to default? What happens if things go really badly and what are the indirect effects of default?
Coming this weekend: Part 5, What if Things Go Really Badly?
Series:
• Part 1: How Large is the Outstanding Value of Sovereign Bonds?
• Part 2. How Often Have Sovereign Countries Defaulted in the Past?
• Part 2B: More on Historic Sovereign Default Research
• Part 3. What are the Market Estimates of the Probabilities of Default?
• Part 4. What are Total Estimated Losses on Sovereign Bonds Due to Default?
• Part 5A. What Happens If Things Go Really Badly? $15 Trillion of Sovereign Debt in Default
• Part 5B. Part 5B. What Happens If Things Go Really Badly? More Things Can Go Badly: Credit Default Swaps, Interest Swaps and Options, Foreign Exchange
• Part 5C. Some Policy Options, Good and Bad
• Part 5D. European Banks, What if Things Go Really Badly?
Lawler: Update on the California Home Buyer Tax Credit
by Calculated Risk on 7/14/2010 05:48:00 PM
CR Note: This is from housing economist Thomas Lawler.
The State of California Franchise Tax Board reported that it estimates it has received first-time home buyer tax credit applications above the $100 million cap. However, it is still taking applications, as it believes it has received significant amounts of duplicate, revised, or invalid applications. Here are the stats the CFTB has reported on its estimates of applications for the first-time tax credit, as well as the paragraph highlighting that they are estimates only.
The figures shown below are only estimates, based on small samples. The numbers are overstated as there will be duplicate, revised, and invalid applications included as we have not verified any of the applications. These estimates are only provided to give a general idea of the number of applications received and the amount requested for the First-Time Buyer Credit. We are showing 57% of the estimated requested credit since the $100 million cap will only be reduced by 57% of the credit allocated to the buyer. The amounts do not reflect actual amounts which will be allocated. These estimates will be updated each Thursday until we are sure that we have received more than enough applications to allocate the full $100 million. Once we determine that we have received sufficient applications to allocate the full $100 million, we will stop accepting applications for the First-Time Buyer Credit. Estimates for the New Home Credit will be provided once our computer system is completed.
| Applications for First-Time Buyer Credit received as of 07/13/10 | ||
|---|---|---|
| As of | Estimated Total First-Time Buyer Applications Received | 57% of Estimated Requested Credit |
| 5/4/2010 | 430 | $2,351,000 |
| 5/11/2010 | 2,470 | $13,283,000 |
| 5/18/2010 | 4,830 | $25,473,000 |
| 5/25/2010 | 7,330 | $38,357,000 |
| 6/1/2010 | 9,760 | $50,948,000 |
| 6/8/2010 | 12,740 | $65,787,000 |
| 6/15/2010 | 15,220 | $78,108,000 |
| 6/22/2010 | 17,860 | $91,404,000 |
| 6/29/2010 | 20,760 | $105,898,000 |
| 7/6/2010 | 23,680 | |
| 7/9/2010 | 25,120 | |
| 7/12/2010 | 25,790 | |
| 7/13/2010 | 26,260 | |
Amazingly, the CFTB – which handled a similar tax credit last year, notes the following on its website:
“We have not processed any applications yet as our computer system is still being developed. Once our computer system is completed, we will provide weekly updates on the number of certificates that have been mailed and the amount of credits that have been allocated.”The CFTB notes that in order that it does not risk cutting off the program “too soon,” it “will wait for the computer system to be released before we determine when to stop accepting First-Time Buyer applications.” It also notes, however, that it “will only issue approved certificates of allocation until the $100 million is exhausted,” and the allocation is based on a first-come/first served basis. As such, there is some risk to home buyers that they may not get the credit they hoped for. And since applications must be faxed AFTER escrow closes, ...
According to the CFTB, “(w)e expect it to take 3-6 months to notify taxpayers after an application or reservation is received,” because “(w)e need to develop a computer system to capture, verify, reserve or allocate, issue letters, and track the credits.
The CFTB also provided some updated estimates for the new home tax credit, which also are “only estimates, based on small samples.” This credit is also capped at $100 million.
| As of | Estimated Reservation Requests Received | Estimated Applications Received | Estimated Total Reservation Requests and Applications Received | 70% of Estimated Total Requested Credit |
|---|---|---|---|---|
| 06/15/10 | 1,930 | 3,700 | 5,630 | $ 36,360,000 |
| 06/22/10 | 2,250 | 4,180 | 6,430 | $ 41,683,000 |
| 06/29/10 | 2,600 | 5,150 | 7,750 | $ 50,136,000 |
| 07/06/10 | 2,850 | 5,950 | 8,800 | $ 57,191,000 |
For those who forgot, each credit enables an eligible home buyer to get a state income tax credit of up to $10,000, taken in equal installments over three years. The credit cannot reduce a borrower’s tax to below zero, and last year’s experience was that many borrowers were not able to take advantage of the full $10,000 credit. So here is the rationale for the 57% and 70% “haircuts.”
“The total amount of allocated tax credit for all taxpayers may not exceed $100 million for the New Home Credit and $100 million for the First-Time Buyer Credit. However, since many taxpayers will not be able to utilize the entire tax credit, the legislation specifies that the $100 million cap for the New Home Credit will be reduced by 70 percent of the tax credit allocated to each buyer and the $100 million cap for the First-Time Buyer Credit will be reduced by 57 percent of the tax credit allocated to each buyer. For example, if a taxpayer is allocated $10,000 for the New Home Credit, the $100 million cap for the New Home Credit will only be reduced by $7,000. If a taxpayer is allocated $10,000 for the First-Time Buyer Credit, the $100 million cap for the First-Time Buyer Credit will only be reduced by $5,700. The 70 and 57 percent reductions do not impact the amount that can be claimed by the taxpayer.”This sure doesn’t seem like a well-run program!!!!!
CR Note: This is from housing economist Thomas Lawler.
LA Port Traffic: Imports Surge, Exports Decline
by Calculated Risk on 7/14/2010 03:38:00 PM
Notes: this data is not seasonally adjusted. There is a very distinct seasonal pattern for imports, but not for exports. LA area ports handle about 40% of the nation's container port traffic.
Sometimes port traffic gives us an early hint of changes in the trade deficit. The following graph shows the loaded inbound and outbound traffic at the ports of Los Angeles and Long Beach in TEUs (TEUs: 20-foot equivalent units or 20-foot-long cargo container). Although containers tell us nothing about value, container traffic does give us an idea of the volume of goods being exported and imported.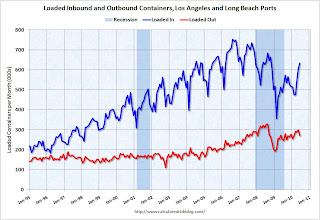 Click on graph for larger image in new window.
Loaded inbound traffic was up 30.0% compared to June 2009. Inbound traffic is now up 1% vs. two years ago (June '08).
Loaded outbound traffic was up 7.7% from June 2009. Exports were off almost 4% from May 2010. Unlike imports, exports are still off from 2 years ago (off 13%).
For imports there is usually a significant dip in either February or March, depending on the timing of the Chinese New Year, and then usually imports increase until late summer or early fall as retailers build inventory for the holiday season. So part of this increase in June imports is just the normal seasonal pattern.
Based on this data, it appears the trade deficit with Asia increased again in June. Not only have the pre-crisis global imbalances returned, but the decline in exports from May is concerning (there is no clear seasonal pattern for exports).
FOMC Minutes: Forecast revised down
by Calculated Risk on 7/14/2010 02:00:00 PM
From the June 22-23, 2010 (and May 9th) FOMC meeting.
The Fed revised down their forecasts:
| Economic projections of Federal Reserve Governors and Reserve Bank presidents | |||
|---|---|---|---|
| 2010 | 2011 | 2012 | |
| Change in Real GDP | 3.0% to 3.5% | 3.5% to 4.2% | 3.5% to 4.5% |
| April projection | 3.2% to 3.7% | 3.4% to 4.5% | 3.5% to 4.5% |
| Unemployment Rate | 9.2% to 9.5% | 8.3% to 8.7% | 7.1% to 7.5% |
| April projection | 9.1% to 9.5% | 8.1% to 8.5% | 6.6% to 7.5% |
| PCE Inflation | 1.0% to 1.1% | 1.1% to 1.6% | 1.0% to 1.7% |
| April projection | 1.2% to 1.5% | 1.1% to 1.9% | 1.2% to 2.0% |
Unfortunately, I'll take the under on GDP growth and inflation, and the over on the unemployment rate.
On further stimulus:
[M]embers noted that in addition to continuing to develop and test instruments to exit from the period of unusually accommodative monetary policy, the Committee would need to consider whether further policy stimulus might become appropriate if the outlook were to worsen appreciably.That is it.
AIA Forecast: Nonresidential Construction Spending to fall 20% in 2010
by Calculated Risk on 7/14/2010 12:11:00 PM
From Reuters: US nonresidential building seen down 20 pct in '10
Spending on U.S. nonresidential construction is likely to fall more than 20 percent this year before recovering slightly in 2011, according to a semiannual survey by an architects' trade group.Nonresidential construction investment has been a drag on GDP for six consecutive quarters (through Q1 2010), and will remain a drag throughout 2010 and probably into 2011.
...
Construction spending on hotels will drop more than 43 percent this year, construction of office buildings will decline almost 30 percent, and retail and industrial categories will be down more than 20 percent, the [American Institute of Architects] said.
Here is a repeat of a graph shows the rolling 4 quarter contribution to GDP from residential investment, equipment and software, and nonresidential structures. This is important to follow because residential investment tends to lead the economy, equipment and software is generally coincident, and nonresidential structure investment trails the economy.
For the following graph, red is residential, green is equipment and software, and blue is investment in non-residential structures. The usual pattern - both into and out of recessions is - red, green, blue.
 Click on graph for larger image in new window.
Equipment and software investment has made a positive contribution to GDP for three straight quarters (it is coincident). Tech has done better than most other sectors.
Residential Investment (RI) made a small positive contribution to GDP in the second half of 2009, but was a drag in Q1 2010. It will be positive again in Q2 2010 (tax credit related), and be negative again later this year. The rolling four quarter change is moving up, but as expected there has been no strong boost to GDP from RI.
Nonresidential investment in structures continues to be a drag on the economy, and as usual the economy is recovering long before nonresidential investment in structures recovers.
Manufacturing and Trade Inventory-to-Sales Ratio
by Calculated Risk on 7/14/2010 10:00:00 AM
The Manufacturing and Trade Inventories and Sales report from the Census Bureau today showed that the inventory adjustment is over:
Inventories. Manufacturers’ and trade inventories, adjusted for seasonal variations but not for price changes, were estimated at an end-of-month level of $1,355.7 billion, up 0.1 percent (±0.1%)* from April 2010, but down 1.5 percent (±0.3%) from May 2009.
Inventories/Sales Ratio. The total business inventories/sales ratio based on seasonally adjusted data at the end of May was 1.24. The May 2009 ratio was 1.41.
 Click on graph for larger image in new window.
This graph shows the inventory to sales ratio. This increased slightly in May to 1.24 (SA), after declining sharply from the peak of 1.48 back in Jan 2009. This could decline further - the trend is definitely down over time - but clearly the inventory adjustment is over.
This is important because the change in inventory added significantly to Q4 GDP growth and some to Q1 GDP. See BEA line 13: the contribution to GDP in Q4 2009 from 'Change in private inventories' was 3.79 of the 5.9 percent annualized increase in Q4 GDP. In Q1 2010. the 'change in private inventories' was 1.88 of the 2.7 percent annualized increase.
Any contributions to Q2 GDP from inventory changes will be minor or possibly even negative. This is one of the reasons I expect the change in real GDP growth to slow in the 2nd half.
Retail Sales fall 0.5% in June
by Calculated Risk on 7/14/2010 08:30:00 AM
On a monthly basis, retail sales decreased 0.5% from May to June (seasonally adjusted, after revisions), and sales were up 4.8% from June 2009.  Click on graph for larger image in new window.
This graph shows retail sales since 1992.
This is monthly retail sales, seasonally adjusted (total and ex-gasoline).
Retail sales are up 7.3% from the bottom, but still off 5.2% from the pre-recession peak. The second graph shows the year-over-year change in retail sales (ex-gasoline) since 1993.
Retail sales ex-gasoline increased by 4.5% on a YoY basis (4.8% for all retail sales). The year-over-year comparisons are easy now since retail sales collapsed in late 2008.
Here is the Census Bureau report:
The U.S. Census Bureau announced today that advance estimates of U.S. retail and food services sales for June, adjusted for seasonal variation and holiday and trading-day differences, but not for price changes, were $360.2 billion, a decrease of 0.5 percent (±0.5%)* from the previous month, but 4.8 percent (±0.7%) above June 2009. Total sales for the April through June 2010 period were up 6.8 percent (±0.3%) from the same period a year ago. The April to May 2010 percent change was revised from -1.2 percent (±0.5%) to -1.1 percent (±0.2%).Retail sales have declined for two consecutive months. This is another weak report, and the decline in sales was worse than expected.
MBA: Mortgage Purchase Applications lowest since December 1996
by Calculated Risk on 7/14/2010 07:46:00 AM
The MBA reports: Mortgage Applications Decrease in Latest MBA Weekly Survey
The Refinance Index decreased 2.9 percent from the previous week and the seasonally adjusted Purchase Index decreased 3.1 percent from one week earlier. This was the lowest Purchase Index observed in the survey since December 1996.
...
The average contract interest rate for 30-year fixed-rate mortgages increased to 4.69 percent from 4.68 percent, with points increasing to 0.96 from 0.86 (including the origination fee) for 80 percent loan-to-value (LTV) ratio loans.
 Click on graph for larger image in new window.
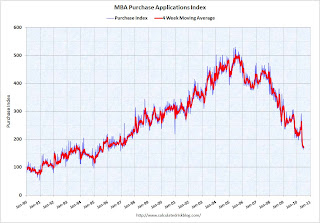
This graph shows the MBA Purchase Index and four week moving average since 1990.
Mortgage applications have fallen off a cliff. The weekly applications index is at the lowest level since December 1996, and and the four week average is at the lowest level since September 1995 - almost 15 years ago. The four week average is off 35% since the mini-peak in April (the weekly index is off 44% since the end of April).
This collapse in the mortgage application index has already shown up as a decline in new home sales, and will show up in the July existing home sales report (counted at close of escrow).
Tuesday, July 13, 2010
Fed Minutes Preview
by Calculated Risk on 7/13/2010 10:29:00 PM
Usually the Fed minutes are pretty boring, but the minutes for the two day meeting held on June 22nd and 23rd, to be released on Wednesday, might be a little more interesting.
This release will include a revised forecast. Look for the Fed to revise down estimates for GDP and for inflation. And revise up estimates for unemployment.
The Fed April forecast for 2010 (most recent) was:
Also the Fed might have discussed possible additional easing measures at the June meeting, and if so, it will be interesting to see the options discussed.
Jon Hilsenrath at the WSJ has a preview: Fed Sees Slower Growth
From Steve Matthews and Carol Massar at Bloomberg: Blinder Cuts U.S. Forecast, Says Fed Must Plan for More Easing (ht jb)
Some European Stress Test Results may be delayed
by Calculated Risk on 7/13/2010 07:02:00 PM
From James Kanter at the NY Times: European Bank Stress Test Results May Be Delayed
Top European finance officials said Tuesday that results of banking stress tests would be released on July 23, but that some national regulators could take longer to release more detailed information on certain national lenders ... national regulators will retain the leeway to choose whether to publish additional information about the nationally based subsidiaries of large banking groups within two weeks from July 23.Sounds confusing ...


