 RSS Feed
 by Calculated Risk on 6/25/2010 08:32:00 AM
Friday, June 25, 2010
Q1 GDP revised down to 2.7%
The Q1 real GDP rate was revised down again (third estimate) to 2.7% from the 2nd estimate of 3.0%.
Consumer spending was weaker in Q1 than originally estimated. PCE growth (personal consumption expenditures) was revised down to 3.0% in Q1 from the previous estimate of 3.5%.
Some more from Reuters: Economy Grew Slower in First Quarter than Expected, Up 2.7%
... business spending, which only rose at a 2.2 percent rate instead of 3.1 percent as reported last month. This was as a spending on structures was revised down to show a slightly bigger decline than reported last month. Growth in software and equipment investment was also lowered to a 11.4 percent rate from 12.7 percent.The "Change in private inventories" was revised up to a contribution of 1.88 percentage points from the previous estimate of 1.65. So inventory adjustment accounted for over two-thirds of the GDP growth in Q1 - and the inventory adjustment appears over. This is a weak third estimate.
...
Another drag on growth came from exports whose growth was eclipsed by a rise in imports, resulting in a trade deficit that subtracted from GDP.
... real final sales to domestic purchasers, considered a better measure of domestic demand, rose at a 1.6 percent rate instead of the 2.0 percent pace reported last month.
Thursday, June 24, 2010
Late Night Reading
by Calculated Risk on 6/24/2010 11:59:00 PM
Just a couple of depressing articles ...
From Paul Krugman in the NY Times: The Renminbi Runaround
As of Thursday, the currency was only about half a percent higher than its typical level before the announcement. And all indications are that watching the future movement of the renminbi will be like watching paint dry: Chinese officials are still making statements denying that a rise in their currency will do anything to reduce trade imbalances, and prices in the forward market, in which traders agree to exchange currencies at various points in the future, suggest a rise of only about 2 percent in the renminbi by the end of this year. This is basically a joke.From Michael Pettis: What might history tell us about the Greek crisis?
Update: Unemployment Benefits, Housing Tax Credit
by Calculated Risk on 6/24/2010 07:32:00 PM
From Lori Montgomery at the WaPo: Senate again rejects emergency spending package
The Senate on Thursday rejected a package of tax cuts, state aid and emergency jobless benefits ... [try again] after the July 4 recess. By then, more than 2 million people will have seen their unemployment benefits cut off, according to the U.S. Department of Labor.What this means is that anyone receiving extended unemployment benefits (there are several tiers) will not be eligible for the next tier when their unemployment benefits expire.
This bill also contains the extension of the closing date for the homebuyer tax credit. As of right now, homebuyers must close by June 30th to receive the tax credit.
But of course the housing industry wants even more. From Zach Fox at SNL Financial: Analysts: Record low new-home sales could lead to another tax credit
Even though he is not in favor of another tax credit, [Michael Widner, an analyst with Stifel Nicolaus & Co.] said May's exceptionally low number means plenty of industry insiders will push for one.Hopefully there will not be another housing tax credit. And hopefully the change in eligibility date for extended unemployment benefits will be approved.
"On the one hand, I know that the phones are ringing off the hook in D.C. right now for people clamoring for a new tax credit," Widner said. "So the shock value of an all-time low is going to be a lot of people saying: 'Oh my God, we gotta do more to stimulate housing.' ... And on the other hand, you're going to get people, who frankly I side with more, saying: 'You know, look, obviously the tax credit did nothing but pull demand forward, and in the wake of the tax credit you see the void left behind.'"
Misc: Quote of the Day, Greece Bond Spreads increase Sharply, and Market Update
by Calculated Risk on 6/24/2010 04:00:00 PM
Here is a graph from the Atlanta Fed weekly Financial Highlights released today (graph as of June 23rd):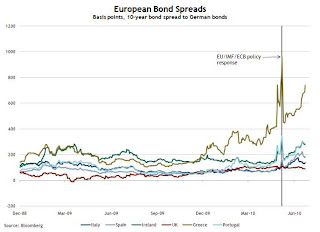 Click on graph for larger image in new window.
From the Atlanta Fed:
Greek bond spreads (over German bonds) have risen recently, near the highs seen before the European policy package was announced in early May.Note: The Atlanta Fed data is one day old. Nemo has links to the current data on the sidebar of his site.
Other euro zone countries’ bond spreads are also elevated during the same period.
Since tightening in early May, the 10-year Greece-to-German bond spread has risen to nearly 300 basis points (bps) (from 4.38% to 7.39%) through June 22. Other European peripherals’ spreads are elevated, with Portugal up 138 bps over the period, Ireland up 111 bps, and Spain 86 bps higher.
The spreads have widened further today: Greece is up sharply to 781 bps today.
 And a market update from Doug Short of dshort.com (financial planner).
Click on graph for interactive version in new window.
The graph has tabs to look at the different bear markets - "now" shows the current market - and there is also a tab for the "four bears".
And here is the quote of the day from BofA (via Bloomberg, ht Bill):
"Given the depth of the nation’s recessionary impacts on homeowners, a considerable number of customers will transition from homeownership over the next two years.""Transition from homeownership ..." Ouch.
Barbara Desoer, president of Bank of America’s home-loan and insurance unit, said in testimony prepared for a congressional hearing June 24, 2010
Lennar: June Home Sales off 20% to 25% from 2009
by Calculated Risk on 6/24/2010 02:43:00 PM
From Bloomberg: Lennar Home Sales Down as Much as 25% in June as Tax Credit Ends, CEO Says (ht Brian)
Lennar Corp.’s home sales are down 20 percent to 25 percent this month compared with a year earlier ... Chief Executive Officer Stuart Miller said.In June 2009, new home sales were at a 396K seasonally adjusted annual rate. This is just one home builder, but a 20% to 25% decline would put sales in June at about the record low level of May. This is almost certain to the worst June sales rate since the Census Bureau started keeping records in 1963.
“The entire market knew there’d be a slowdown as we came off the tax credit,” Miller said on a conference call with investors today. “It’s just that the reality of it doesn’t feel good.”
Hotel Occupancy Rate increases
by Calculated Risk on 6/24/2010 01:12:00 PM
From HotelNewsNow.com: STR: US results for week ending 19 June
In year-over-year measurements, the industry’s occupancy last week increased 5.8 percent to 66.7 percent. Average daily rate rose 1.1 percent to US$98.03—the third time in four weeks that the measurement has risen. Revenue per available room rose 7.0 percent to US$65.36.The following graph shows the four week moving average for the occupancy rate by week for 2008, 2009 and 2010 (and a median for 2000 through 2007).
 Click on graph for larger image in new window.
Notes: the scale doesn't start at zero to better show the change.
On a 4-week basis, occupancy is up 8.1% compared to last year (the worst year since the Great Depression) and still almost 7% below normal. About half way back!
Last year leisure travel (summer) held up better than business travel, now it appears business travel is recovering - and we will soon see if leisure travel will also pick up this year.
Data Source: Smith Travel Research, Courtesy of HotelNewsNow.com
30 Year Mortgage Rates fall to Record Low
by Calculated Risk on 6/24/2010 10:54:00 AM
From Reuters: Mortgage Rates Drop to Lowest Level on Record
Interest rates on U.S. 30-year fixed-rate mortgages, the most widely used loan, averaged 4.69 percent for the week ended June 24, the lowest since Freddie Mac started the survey in April 1971.
 Click on graph for larger image in new window.
This graph shows the 30 year fixed rate mortgage interest rate, and the Ten year Treasury yield since 2002. The 30 year mortgage rate is now at a series low (started in 1971), although the spread between the mortgage rate and the treasury yield has widened about 30 bps recently.
The decline in mortgage rates is related to the weak economy and falling treasury yields.
Weekly Initial Unemployment Claims Decline, Still High
by Calculated Risk on 6/24/2010 08:30:00 AM
The DOL reports on weekly unemployment insurance claims:
In the week ending June 19, the advance figure for seasonally adjusted initial claims was 457,000, a decrease of 19,000 from the previous week's revised figure of 476,000. The 4-week moving average was 462,750, a decrease of 1,500 from the previous week's revised average of 464,250.
...
The advance number for seasonally adjusted insured unemployment during the week ending June 12 was 4,548,000, a decrease of 45,000 from the preceding week's revised level of 4,593,000.
 Click on graph for larger image in new window.
This graph shows the 4-week moving average of weekly claims since January 2000.
The four-week average of weekly unemployment claims decreased this week by 1,500 to 462,750.
The dashed line on the graph is the current 4-week average.
Initial weekly claims have been at about the same level since December 2009. The current level of 457,000 (and 4-week average of 462,750) is still high, and suggests ongoing weakness in the labor market.
Wednesday, June 23, 2010
DOT: Vehicle Miles Driven increase in April
by Calculated Risk on 6/23/2010 11:59:00 PM
Note: on New Home sales, please see: New Home Sales collapse to Record Low in May
The Department of Transportation (DOT) reported that vehicle miles driven in April were up 1.2% from April 2009:
Travel on all roads and streets changed by +1.2% (3.1 billion vehicle miles) for April 2010 as compared with April 2009. Travel for the month is estimated to be 255.9 billion vehicle miles.
Cumulative Travel for 2010 changed by -0.2% (-1.6 billion vehicle miles).
 Click on graph for larger image in new window.
This graph shows the rolling 12 month total vehicle miles driven.
On a rolling 12 month basis, miles driven are still 2.0% below the peak - and only 0.6% above the recent low - suggesting a sluggish recovery.
Home Sales: Distressing Gap
by Calculated Risk on 6/23/2010 08:06:00 PM
This is something I've been tracking for years ... the first graph shows existing home sales (left axis) and new home sales (right axis) through May. This graph starts in 1994, but the relationship has been fairly steady back to the '60s. Then along came the housing bubble, and the "distressing gap" (due partially to distressed sales). Click on graph for larger image in new window.
Initially the gap was caused by the flood of distressed sales. This kept existing home sales elevated, and depressed new home sales since builders couldn't compete with the low prices of all the foreclosed properties.
The two spikes in existing home sales were due primarily to the first time homebuyer tax credit (the initial credit last year, followed by the extension to April 30th / close by June 30th). There were also two smaller bumps for new home sales related to the tax credit. Since new home sales are reported when contracts are signed, the 2nd spike for new home sales was in April and then sales collapsed in May.
The second graph shows the same information as a ratio - new home sales divided by existing home sales - through May 2010. The ratio decreased because the expiration of the tax credit impacts new home sales first. This is the all time low for the ratio (due to timing issues), and the ratio will increase somewhat as existing home sales collapse in July.
I expect that eventually this ratio will return to the historical range of new home sales being around 15% to 20% of existing home sales. However that will only happen after the huge overhang of existing inventory (especially distressed inventory) is significantly reduced.


