 RSS Feed
 by Calculated Risk on 3/01/2011 03:55:00 PM
Showing posts with label auto. Show all posts
Showing posts with label auto. Show all posts
Tuesday, March 01, 2011
U.S. Light Vehicle Sales 13.44 million SAAR in February
Based on an estimate from Autodata Corp, light vehicle sales were at a 13.44 million SAAR in February. That is up 28% from February 2010, and up 6.8% from the sales rate last month (Jan 2011).
 Click on graph for larger image in new window.
This graph shows the historical light vehicle sales (seasonally adjusted annual rate) from the BEA (blue) and an estimate for February (red, light vehicle sales of 13.44 million SAAR from Autodata Corp).
This is the highest sales rate since August 2008, excluding Cash-for-clunkers in August 2009.
 The second graph shows light vehicle sales since the BEA started keeping data in 1967.
Note: dashed line is current estimated sales rate. The current sales rate is finally off the bottom of the '90/'91 recession - and there were fewer registered drivers and a smaller population back then.
This was well above the consensus estimate of 12.7 million SAAR. But, with rising oil prices, the automakers might be under pressure in March.
General Motors: February U.S. sales increase 22% year-over-year
by Calculated Risk on 3/01/2011 11:33:00 AM
Note: The real key is the seasonally adjusted annual sales rate (SAAR) compared to the last few months, not the year-over-year comparison provided by the automakers. But this is a strong increase for GM ...
From MarketWatch: GM U.S. February auto sales surge 45.8% to 207,028
[GM] said January U.S. sales in February surged 45.8% to 207,028 vehicles from 141,951 in February 2010.Once all the reports are released, I'll post a graph of the estimated total February light vehicle sales (SAAR) - usually around 4 PM ET. Most estimates are for an increase to 12.7 million SAAR in February from the 12.6 million SAAR in January. Sales in January 2010 were at a 10.74 million SAAR.
I'll add reports from the other major auto companies as updates to this post.
From MarketWatch: Ford U.S. February auto sales up 13.8% to 156,626
From MarketWatch: Chrysler sales rise 13% in Feb
From MarketWatch: Toyota U.S. February sales soar 41.8% to 141,846
Tuesday, February 01, 2011
U.S. Light Vehicle Sales 12.62 million SAAR in January
by Calculated Risk on 2/01/2011 04:47:00 PM
Please see the previous post for a little color on the economic data.
Based on an estimate from Autodata Corp, light vehicle sales were at a 12.62 million SAAR in January. That is up 17.5% from January 2010, and up 1.0% from the sales rate last month (Dec 2010).
 Click on graph for larger image in new window.
This graph shows the historical light vehicle sales (seasonally adjusted annual rate) from the BEA (blue) and an estimate for January (red, light vehicle sales of 12.62 million SAAR from Autodata Corp).
This is the highest sales rate since August 2008, excluding Cash-for-clunkers in August 2009.
 The second graph shows light vehicle sales since the BEA started keeping data in 1967.
Note: dashed line is current estimated sales rate. The current sales rate is still near the bottom of the '90/'91 recession - when there were fewer registered drivers and a smaller population.
This was at the consensus estimate of 12.6 million SAAR.
General Motors: January U.S. sales increase 22% year-over-year
by Calculated Risk on 2/01/2011 11:09:00 AM
Note: The real key is the seasonally adjusted annual sales rate (SAAR) compared to the last few months, not the year-over-year comparison provided by the automakers. But this is a strong increase for GM ...
From MarketWatch: GM's January U.S. sales jump 21.8%
[GM] said January U.S. sales rose 21.8% to 178,896 cars and trucks. Excluding discontinued brands, sales of GM's four core nameplates rose 23%.Once all the reports are released, I'll post a graph of the estimated total January light vehicle sales (SAAR) - usually around 4 PM ET. Most estimates are for an increase to 12.6 million SAAR in January from the 12.5 million SAAR in December. Sales in December 2009 were at a 10.7 million SAAR.
I'll add reports from the other major auto companies as updates to this post.
Update from MarketWatch: Ford January U.S. sales rise 13.3%
Update from MarketWatch: Chrysler U.S. January sales up 22.7% to 70,118
Monday, January 31, 2011
Auto Sales to Disappoint?
by Calculated Risk on 1/31/2011 09:13:00 PM
Light vehicle sales for January - to be announced tomorrow - are expected to increase to 12.6 million (Seasonally Adjusted Annual Rate), from 12.5 million in December.
There were a couple of articles out today suggesting sales slowed at the end of the month.
From Bloomberg (ht jb):
Ford Motor Co. said the U.S. industrywide auto sales rate may be lower in January than December ...From Reuters: Auto sales seen losing momentum in January
U.S. auto sales lost momentum in the final weeks of January, auto executives and a leading analyst cautioned on Monday ... J.D. Power forecast a January sales rate of between 11.5 million and 12 million vehicles, down sharply from the outlook for 12.2 million it had given just 10 days before.We will know tomorrow. Blame it on the snow?
... on Monday Chrysler Chief Executive Sergio Marchionne said that industry-wide sales had fallen off in the final weeks of the month, which typically account for the bulk of sales.
"We've seen a softening of the U.S. market in the last couple of weeks," Marchionne told reporters ...
Tuesday, January 04, 2011
U.S. Light Vehicle Sales 12.55 million SAAR in December
by Calculated Risk on 1/04/2011 04:00:00 PM
Based on an estimate from Autodata Corp, light vehicle sales were at a 12.55 million SAAR in December. That is up 13.1% from December 2009, and up 2.7% from the November 2010 sales rate.
 Click on graph for larger image in new window.
This graph shows the historical light vehicle sales (seasonally adjusted annual rate) from the BEA (blue) and an estimate for December (red, light vehicle sales of 12.55 million SAAR from Autodata Corp).
This is the highest sales rate since September 2008, excluding Cash-for-clunkers in August 2009.
 The second graph shows light vehicle sales since the BEA started keeping data in 1967.
Note: dashed line is current estimated sales rate. The current sales rate is still near the bottom of the '90/'91 recession - when there were fewer registered drivers and a smaller population.
This was above most forecasts of around 12.3 million SAAR.
General Motors: December U.S. sales increase 7.5% year-over-year
by Calculated Risk on 1/04/2011 11:03:00 AM
Note: The real key is the seasonally adjusted annual sales rate (SAAR) compared to the last few months, not the year-over-year comparison provided by the automakers.
From MarketWatch: GM posts 7.5% gain in December U.S. sales
[GM] reported a 7.5% increase in December U.S. sales to 224,185 cars and trucks.Once all the reports are released, I'll post a graph of the estimated total December light vehicle sales (SAAR) - usually around 4 PM ET. Most estimates are for an increase to 12.3 million SAAR in December from the 12.2 million SAAR in November. Sales in December 2009 were at a 11.1 million SAAR.
I'll add reports from the other major auto companies as updates to this post.
Update: MarketWatch reports: Ford 2010 sales up 19% vs year ago
From CNBC:
Chrysler says its sales for December of 2010 were up 16.4 percent from the same time in 2009. The carmaker sold 100,702 vehicles in December vesus 86,523 in the same month of 2009.
Wednesday, December 01, 2010
U.S. Light Vehicle Sales 12.26 million SAAR in November
by Calculated Risk on 12/01/2010 03:56:00 PM
Based on an estimate from Autodata Corp, light vehicle sales were at a 12.26 million SAAR in November. That is up 13.2% from November 2009, and up slightly from the October 2010 sales rate.
 Click on graph for larger image in new window.
This graph shows the historical light vehicle sales (seasonally adjusted annual rate) from the BEA (blue) and an estimate for November (red, light vehicle sales of 12.26 million SAAR from Autodata Corp).
This is the highest sales rate since September 2008, excluding Cash-for-clunkers in August 2009.
 The second graph shows light vehicle sales since the BEA started keeping data in 1967.
Note: dashed line is current estimated sales rate. The current sales rate is still near the bottom of the '90/'91 recession - when there were fewer registered drivers and a smaller population.
This was above most forecasts of around 12.0 million SAAR.
Wednesday, November 03, 2010
U.S. Light Vehicle Sales 12.26 million SAAR in October
by Calculated Risk on 11/03/2010 03:29:00 PM
Note: I'll posts some comments on the FOMC statement later today.
Based on an estimate from Autodata Corp, light vehicle sales were at a 12.26 million SAAR in October. That is up 17.9% from October 2009, and up 4.7% from the September 2010 sales rate.
 Click on graph for larger image in new window.
This graph shows the historical light vehicle sales (seasonally adjusted annual rate) from the BEA (blue) and an estimate for October (red, light vehicle sales of 12.26 million SAAR from Autodata Corp).
This is the highest sales rate since September 2008, excluding Cash-for-clunkers in August 2009.
 The second graph shows light vehicle sales since the BEA started keeping data in 1967.
Note: dashed line is current estimated sales rate. The current sales rate is still near the bottom of the '90/'91 recession - when there were fewer registered drivers and a smaller population.
This was above most forecasts of around 12.0 million SAAR.
Friday, October 01, 2010
U.S. Light Vehicle Sales 11.76 million SAAR in September
by Calculated Risk on 10/01/2010 04:00:00 PM
Based on an estimate from Autodata Corp, light vehicle sales were at a 11.76 million SAAR in Setpember. That is up 25.8% from September 2009 (the dip following cash-for-clunkers), and up 2.8% from the August 2010 sales rate.
 Click on graph for larger image in new window.
This graph shows the historical light vehicle sales (seasonally adjusted annual rate) from the BEA (blue) and an estimate for August (red, light vehicle sales of 11.76 million SAAR from Autodata Corp).
This is the high for the year - slightly higher than in March.
 The second graph shows light vehicle sales since the BEA started keeping data in 1967.
Note: dashed line is current month sales rate. The current sales rate is about at the bottom of the '90/'91 recession - when there were fewer registered drivers and a smaller population.
This was above most forecasts of around 11.6 million SAAR.
General Motors: September U.S. sales increase 10.5% to 173,155 units
by Calculated Risk on 10/01/2010 10:58:00 AM
Note: in September 2009 U.S. light vehicle sales were 9.3 million (SAAR). There was a sharp decline in sales following the "Cash-for-clunkers" program that ended in August 2009, so the year-over-year comparisons look good. The real key is the seasonally adjusted sales rate compared to the last few months (total U.S. light vehicle sales have been mostly flat since March 2010).
From MarketWatch: GM September U.S. sales up 10.5% to 173,155 units
General Motors Co. said Friday that U.S. sales in September rose 10.5% to 173,155 vehicles from 156,673 in September 2009.I'll add reports from the other major auto companies as updates to this post.
Update1: from MarketWatch: Chrysler U.S. September sales surge 61% to 100,077
Update2: from MarketWatch: Ford U.S. Sept. sales jump 46.3% to 160,873 units
Update3: from MarketWatch: Toyota U.S. Sept. sales rise 16.8% to 147,162
NOTE: Once all the reports are released, I'll post a graph of the estimated total September light vehicle sales (SAAR: seasonally adjusted annual rate) - usually around 4 PM ET. Most estimates are for an increase to 11.6 million SAAR in September from the 11.44 million SAAR in August.
Friday, September 24, 2010
DOT: Vehicle Miles driven increase slightly in July
by Calculated Risk on 9/24/2010 03:23:00 PM
The Department of Transportation (DOT) reported that vehicle miles driven in June were up 0.8% compared to July 2009:
Travel on all roads and streets changed by 0.8% (2.2 billion vehicle miles) for July 2010 as compared with July 2009.
Cumulative Travel for 2010 changed by 0.2% (2.9 billion vehicle miles).
 Click on graph for larger image in new window.
This graph shows the rolling 12 month total vehicle miles driven.
On a rolling 12 month basis, vehicle miles driven are mostly moving sideways. Miles driven are still 1.8% below the peak in 2007.
Back in 2008, vehicle miles turned strongly negative on a "month over the same month of the prior year" basis, and that was one of the pieces of data that helped me correctly predict oil prices would decline sharply in the 2nd half of 2008. So far we haven't seen a sharp decline in vehicle miles - but we also haven't seen a strong increase.
Early next year this will be the longest period with the rolling 12-months miles driven below the previous peak since the DOT started tracking this series. The current longest slump followed the 1979 oil crisis and lasted for 40 months (starting in 1979 and lasting through the recession of the early '80s).
Wednesday, September 01, 2010
U.S. Light Vehicle Sales 11.5 Million SAAR in August
by Calculated Risk on 9/01/2010 04:00:00 PM
Based on an estimate from Autodata Corp, light vehicle sales were at a 11.47 million SAAR in August. That is down 18.9% from August 2009 (cash-for-clunkers), and down 0.5% from the July sales rate. Click on graph for larger image in new window.
This graph shows the historical light vehicle sales (seasonally adjusted annual rate) from the BEA (blue) and an estimate for August (red, light vehicle sales of 11.47 million SAAR from Autodata Corp).
The high for the year was in March, and sales have moved mostly sideways since then. The second graph shows light vehicle sales since the BEA started keeping data in 1967.
Note: dashed line is current month sales rate. The current sales rate is still below the bottom of the '90/'91 recession - when there were fewer registered drivers and a smaller population.
This was below most forecasts of around 11.6 million SAAR.
General Motors: Sales off sharply from August 2009
by Calculated Risk on 9/01/2010 11:18:00 AM
Note: Sales in August 2009 were boosted by "Cash-for-clunkers".
From MarketWatch: GM August U.S. sales down 24.9% to 185,176 units
General Motors Co. said Wednesday that U.S. sales in August slumped 24.9% to 185,176 vehicles from 246,479 in August 2009.Note: in August 2009 U.S. light vehicle sales were 14.1 million (SAAR). This was related to "Cash-for-clunkers" - also General Motors emerged from bankruptcy on July 10, 2009.
I'll add reports from the other major auto companies as updates to this post.
Update1: From MarketWatch: Ford U.S. August sales slide 10.7% to 157,503
From MarketWatch: Chrysler U.S. August sales rise 7% to 99,611 units
NOTE: Once all the reports are released, I'll post a graph of the estimated total August light vehicle sales (SAAR: seasonally adjusted annual rate) - usually around 4 PM ET. Most estimates are for an increase to 11.6 million SAAR in August from the 11.5 million SAAR in July.
Wednesday, August 04, 2010
BEA: July light vehicle sales rate 11.5 million SAAR
by Calculated Risk on 8/04/2010 02:17:00 PM
I usually use the light vehicle estimate from AutoData for the seasonally adjusted annual rate. Their estimate is usually very close, however since the BEA didn't put out the adjustment factors in advance, AutoData estimated sales at 12 million SAAR in July with a notice that this might be revised.
The BEA released the sales numbers this morning, and the sales rate was 11.52 million (below most analyst estimates). This is a significant difference and worth mentioning.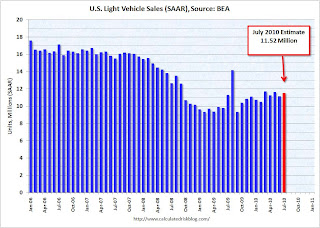 Click on graph for larger image in new window.
This graph shows the historical light vehicle sales (seasonally adjusted annual rate) from the BEA.
This was below most forecasts of around 11.6 to 11.8 million SAAR, and is below the levels of March and May earlier this year.
Tuesday, August 03, 2010
U.S. Light Vehicle Sales 12.1 Million* SAAR in July
by Calculated Risk on 8/03/2010 04:00:00 PM
UPDATE at 5:25 PM ET, 8/3/2010: AutoData revised their estimate to 11.98 million SAAR.
Based on an estimate from Autodata Corp, light vehicle sales were at a 12.06 million SAAR in July. That is up 7.5% from July 2009, and up 9.1% from the June sales rate.
IMPORTANT: AutoData notes: "*The July 2010 SAAR factors have been estimated by averaging the factors from July 2007, July 2008 and July 2009. We will restate the July 2010 SAAR after the Bureau of Economic Analysis publishes the appropriate factors." Click on graph for larger image in new window.
This graph shows the historical light vehicle sales (seasonally adjusted annual rate) from the BEA (blue) and an estimate for July (red, light vehicle sales of 12.06 million SAAR from Autodata Corp).
The second graph shows light vehicle sales since the BEA started keeping data in 1967. Note: dashed line is current month sales rate.
Excluding the surge in sales during August 2009 (cash-for-clunkers), this is the highest sales rate since September 2008.
This was above most forecasts of around 11.6 to 11.8 million SAAR. Light truck sales were up significantly compared to July 2009.
General Motors: Sales up sharply compared to July 2009
by Calculated Risk on 8/03/2010 11:00:00 AM
From General Motors: Chevrolet-Buick-GMC-Cadillac Sales Up 25 Percent in July.
General July sales for Chevrolet, Buick, GMC and Cadillac increased by a combined 25 percent to 199,432 units.There was one more selling day in July 2010, so this increase is overstated a little. Note: this is just these brands too.
Note: in July 2009 U.S. light vehicle sales rose to 11.2 million (SAAR) from 9.7 million (SAAR) in June 2009. This increase was related to "Cash-for-clunkers". General Motors didn't emerge from bankruptcy until July 10, 2009, so GM will probably have the best year-over-year comparison of the major automakers.
I'll add reports from the other major auto companies as updates to this post.
Update 1: From MarketWatch: Ford U.S. July sales up 3.1% to 170,411 vehicles
Update 2: From MarketWatch: Chrysler U.S. July sales rise 5% to 93,313 units
Update 3: From MarketWatch: Toyota U.S. July sales fall 3.2% to 169,224 units
NOTE: Once all the reports are released, I'll post a graph of the estimated total July sales (SAAR: seasonally adjusted annual rate) - usually around 4 PM ET. Most estimates are for an increase to 11.6 to 11.8 million SAAR in July from the 11.1 million SAAR in June.
Thursday, July 22, 2010
DOT: Miles Driven increase slightly in May
by Calculated Risk on 7/22/2010 03:27:00 PM
Note: on Existing Home sales, please see:Existing Home Sales decline in June and Existing Home Inventory increases 4.7% Year-over-Year
The Department of Transportation (DOT) reported that vehicle miles driven in May were up just 0.1% compared to May 2009:
Travel on all roads and streets changed by +0.1% (0.3 billion vehicle miles) for May 2010 as compared with May 2009.
...
Cumulative Travel for 2010 changed by -0.1% (-1.6 billion vehicle miles).
 Click on graph for larger image in new window.
This graph shows the rolling 12 month total vehicle miles driven.
On a rolling 12 month basis, vehicle miles driven are mostly moving sideways. Miles driven are still 2.0% below the peak - and only 0.6% above the recent low.
Back in 2008, vehicle miles turned strongly negative on a "month over the same month of the prior year" basis, and that was one of the pieces of data that helped me correctly predict oil prices would decline sharply in the 2nd half of 2008. So far we haven't seen a sharp decline in vehicle miles - and also not a strong increase.
Thursday, July 01, 2010
U.S. Light Vehicle Sales 11.1 Million SAAR in June
by Calculated Risk on 7/01/2010 03:43:00 PM
Based on an estimate from Autodata Corp, light vehicle sales were at a 11.08 million SAAR in June. That is up 14% from June 2009 (when sales were very low), and down 4.6% from the May sales rate. Click on graph for larger image in new window.
This graph shows the historical light vehicle sales (seasonally adjusted annual rate) from the BEA (blue) and an estimate for June (red, light vehicle sales of 11.08 million SAAR from Autodata Corp).
The second graph shows light vehicle sales since the BEA started keeping data in 1967. Note: dashed line is current month sales rate.
Auto sales have recovered from the low levels of early 2009, but are below the lowest point of the '90/'91 recession (even with a larger number of registered drivers).
This was below most forecasts of around 11.4 million SAAR.
General Motors: Sales up 10.7% compared to June 2009
by Calculated Risk on 7/01/2010 11:00:00 AM
From MarketWatch: General Motors U.S. June sales rise 10.7%.
General Motors Co. said Thursday that June U.S. sales rose 10.7% to 195,380 vehicles from 176,571 in the year-ago period.This seems very weak considering GM was in bankruptcy last June.
This is based on an easy comparison in several ways: in June 2009 U.S. light vehicle sales fell almost 30% to 9.7 million (SAAR) from 13.8 million (SAAR) in June 2008. The sharp decline last year was due to the financial crisis, the recession, and of course the Chrysler and GM bankruptcy filings (Chrysler filed for bankruptcy at the end of April, 2009 and GM filed for bankruptcy on June 1, 2009).
I'll add reports from the other major auto companies as updates to this post.
Update 1: From MarketWatch: Ford total sales rise 13.3% to 175,895 units
Update 2: From MarketWatch: Chrysler U.S. June sales jump 35% to 92,482 units
Update 3: From MarketWatch: Toyota U.S. June sales rise 6.8% to 140,604 units
NOTE: Once all the reports are released, I'll post a graph of the estimated total June sales (SAAR: seasonally adjusted annual rate) - usually around 4 PM ET. Most estimates are for a decrease to 11.4 million in June from the 11.6 million SAAR in May.


