 RSS Feed
 by Calculated Risk on 6/30/2023 07:11:00 PM
Friday, June 30, 2023
June 30th COVID Update: New Pandemic Lows for Deaths and Hospitalizations
 Note: Mortgage rates are from MortgageNewsDaily.com and are for top tier scenarios.
Due to changes at the CDC, weekly cases are no longer updated.
After the first few weeks, the pandemic low for weekly deaths had been the week of July 7, 2021, at 1,690 deaths (until recently).
For COVID hospitalizations, the previous low was 9,821 (until recently).
| COVID Metrics | ||||
|---|---|---|---|---|
| Now | Week Ago | Goal | ||
| Hospitalized2 | 5,758 | 6,233 | ≤3,0001 | |
| Deaths per Week2 | 522 | 624 | ≤3501 | |
| 1my goals to stop weekly posts, 2Weekly for Currently Hospitalized, and Deaths 🚩 Increasing number weekly for Hospitalized and Deaths ✅ Goal met. | ||||
 Click on graph for larger image.
This graph shows the weekly (columns) number of deaths reported.
For deaths, I'm currently using 3 weeks ago for "now", since the most recent two weeks will be revised significantly.
Freddie Mac House Price Index Increased Slightly in May; Up 0.4% Year-over-year
by Calculated Risk on 6/30/2023 12:52:00 PM
Today, in the Calculated Risk Real Estate Newsletter: Freddie Mac House Price Index Increased Slightly in May; Up 0.4% Year-over-year
A brief excerpt:
On a year-over-year basis, the National FMHPI was up 0.4% in May, from up 0.7% YoY in April. The YoY increase peaked at 19.2% in July 2021. ...There is much more in the article. You can subscribe at https://calculatedrisk.substack.com/
In May, 15 states and D.C. were below their 2022 peaks, Seasonally Adjusted. The largest seasonally adjusted declines from the recent peak were in D.C. (-9.1%), Idaho (-7.2%), Nevada (-7.1%), Hawaii (-5.5%), Arizona (-5.2%), Utah (-4.9%), Washington (-4.3%), California (-3.7%), Oregon (-3.6%) and Wyoming (-5.0%).
For cities (Core-based Statistical Areas, CBSA), here are the 30 cities with the largest declines from the peak, seasonally adjusted.
...
The FMHPI is suggesting the YoY change in the Case-Shiller index will be close to unchanged for the next couple of months.
The big question is “Will house prices decline further later this year?” And I’ll post some thoughts on this next week.

Q2 GDP Tracking: Around 2%
by Calculated Risk on 6/30/2023 12:00:00 PM
From BofA:
Personal spending came in slight below expectations and with a downward revision in April. Overall, this decreased our personal consumption expenditure tracking estimate for 2Q. After rounding, it left our 2Q US GDP tracking estimate unchanged at 1.5%. [June 30th estimate]From Goldman:
emphasis added
[W]e left our Q2 GDP tracking estimate unchanged at +2.2% (qoq ar). [June 30th estimate]And from the Altanta Fed: GDPNow
The GDPNow model estimate for real GDP growth (seasonally adjusted annual rate) in the second quarter of 2023 is 2.2 percent on June 30, up from 1.8 percent on June 27. [June 30th estimate]
PCE Measure of Shelter Finally Slowing YoY
by Calculated Risk on 6/30/2023 08:47:00 AM
Here is a graph of the year-over-year change in shelter from the CPI report and housing from the PCE report this morning, both through May 2023.
 CPI Shelter was up 8.0% year-over-year in May, down from 8.1% in April, and down from the cycle peak of 8.2% in March 2023.
Housing (PCE) was up 8.3% YoY in May, down from 8.4% in April (April was the cycle peak).
Since asking rents are soft and Year-over-year Rent Growth Continues to Decelerate these measures will slow further in coming months.
Since asking rents are soft and Year-over-year Rent Growth Continues to Decelerate these measures will slow further in coming months.
Personal Income increased 0.4% in May; Spending increased 0.1%
by Calculated Risk on 6/30/2023 08:37:00 AM
The BEA released the Personal Income and Outlays report for May:
Personal income increased $91.2 billion (0.4 percent at a monthly rate) in May, according to estimates released today by the Bureau of Economic Analysis. Disposable personal income (DPI), personal income less personal current taxes, increased $86.7 billion (0.4 percent) and personal consumption expenditures (PCE) increased $18.9 billion (0.1 percent).The May PCE price index increased 3.8 percent year-over-year (YoY), down from 4.3 percent YoY in April, and down from the recent peak of 7.0 percent in June 2022.
The PCE price index increased 0.1 percent. Excluding food and energy, the PCE price index increased 0.3 percent. Real DPI increased 0.3 percent in May and real PCE decreased by less than 0.1 percent; goods decreased 0.4 percent and services increased 0.2 percent
emphasis added
The PCE price index, excluding food and energy, increased 4.6 percent YoY, down from 4.7 percent in April, and down from the recent peak of 5.4 percent in February 2022.
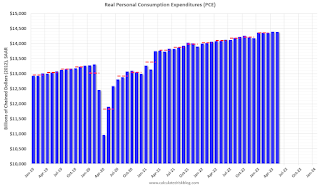
The following graph shows real Personal Consumption Expenditures (PCE) through May 2023 (2012 dollars). Note that the y-axis doesn't start at zero to better show the change.
 Click on graph for larger image.
The dashed red lines are the quarterly levels for real PCE.
Personal income was at expectations, and PCE was slightly below expectations.
Inflation was slightly below expectations.
Using the two-month method to estimate Q2 real PCE growth, real PCE was increasing at a 0.7% annual rate in Q2 2023. (Using the mid-month method, real PCE was increasing at 0.8%). This suggests weak PCE growth in Q2.
Thursday, June 29, 2023
Friday: Personal Income & Outlays
by Calculated Risk on 6/29/2023 08:45:00 PM
 Note: Mortgage rates are from MortgageNewsDaily.com and are for top tier scenarios.
Friday:
• At 8:30 AM ET, Personal Income and Outlays, May 2023. The consensus is for a 0.4% increase in personal income, and for a 0.2% increase in personal spending. And for the Core PCE price index to increase 0.4%. PCE prices are expected to be up 3.8% YoY, and core PCE prices up 4.7% YoY.
• At 9:45 AM, Chicago Purchasing Managers Index for June.
• At 10:00 AM, University of Michigan's Consumer sentiment index (Final for June). The consensus is for a reading of 63.9.
Hotels: Occupancy Rate Down 1.0% Year-over-year
by Calculated Risk on 6/29/2023 03:45:00 PM
U.S. hotel performance remained mostly flat from the previous week, and year-over-year comparisons remained mixed, according to STR‘s latest data through 24 June.The following graph shows the seasonal pattern for the hotel occupancy rate using the four-week average.
18-24 June 2023 (percentage change from comparable week in 2022):
• Occupancy: 71.4% (-1.0%)
• Average daily rate (ADR): US$159.00 (+0.9%)
• Revenue per available room (RevPAR): US$113.58 (-0.1%)
emphasis added
 Click on graph for larger image.
The red line is for 2023, black is 2020, blue is the median, and dashed light blue is for 2022. Dashed purple is for 2018, the record year for hotel occupancy.
The 4-week average of the occupancy rate is at the median rate for the period 2000 through 2022 (Blue).
Note: Y-axis doesn't start at zero to better show the seasonal change.
The 4-week average of the occupancy rate will increase during the summer travel season.
Realtor.com Reports Weekly Active Inventory Down Slightly YoY; New Listings Down 29% YoY
by Calculated Risk on 6/29/2023 12:43:00 PM
Realtor.com has monthly and weekly data on the existing home market. Here is their weekly report from economist Danielle Hale: Weekly Housing Trends View — Data Week Ending June 24, 2023
• Active inventory growth stalled completely, with for-sale homes lagging behind year ago levels for the first time in 59 weeks. As mortgage rates surged in 2022, buyers saw costs soar, and a large number of shoppers reoriented their housing plans. The time it took to sell a home lengthened and the number of homes for sale piled up. Flash forward a little more than a year, and this week, the number of homes actively for sale slipped compared to a year ago. The decline was slight–it actually rounds to zero–but it is notable in that it highlights a key reason why despite high costs home prices have not budged much.
• New listings–a measure of sellers putting homes up for sale–were down again this week, by 29% from one year ago. The number of newly listed homes has been lower than the same time the previous year for the past 51 weeks–nearly a whole year. And this week’s data shows an even larger gap.
 Here is a graph of the year-over-year change in inventory according to realtor.com.
 Inventory is down 0.3% year-over-year - this was the first YoY decrease in 59 weeks (since May 2022).
Inventory is still up from the record lows in the 2nd half of 2021 and early 2022, and it is unlikely we will see new record lows this year.
NAR: Pending Home Sales Down 2.7% in May; Down 22.2% Year-over-year
by Calculated Risk on 6/29/2023 10:04:00 AM
From the NAR: Pending Home Sales Shrunk 2.7% in May
Pending home sales shrunk 2.7% in May from the previous month, according to the National Association of REALTORS®. Three U.S. regions posted monthly losses, while sales in the Northeast surged. All four regions saw year-over-year declines in transactions.This is way below expectations of a 0.3% decrease for this index. Note: Contract signings usually lead sales by about 45 to 60 days, so this would usually be for closed sales in June and July.
“Despite sluggish pending contract signings, the housing market is resilient with approximately three offers for each listing,” said NAR Chief Economist Lawrence Yun, “The lack of housing inventory continues to prevent housing demand from being fully realized.”
The Pending Home Sales Index (PHSI)* – a forward-looking indicator of home sales based on contract signings – dropped 2.7% to 76.5 in May. Year over year, pending transactions fell by 22.2%. An index of 100 is equal to the level of contract activity in 2001.
...
The Northeast PHSI climbed 12.9% from last month to 66.7, a decrease of 21.9% from May 2022. The Midwest index dropped 5.3% to 74.4 in May, down 23.5% from one year ago.
The South PHSI decreased 4.4% to 94.4 in May, reducing 19.6% from the prior year. The West index lessened 6.1% in May to 58.4, falling 26.6% from May 2022.
emphasis added
Weekly Initial Unemployment Claims Decrease to 239,000
by Calculated Risk on 6/29/2023 08:38:00 AM
The DOL reported:
In the week ending June 24, the advance figure for seasonally adjusted initial claims was 239,000, a decrease of 26,000 from the previous week's revised level. The previous week's level was revised up by 1,000 from 264,000 to 265,000. The 4-week moving average was 257,500, an increase of 1,500 from the previous week's revised average. This is the highest level for this average since November 13, 2021 when it was 260,000. The previous week's average was revised up by 250 from 255,750 to 256,000.The following graph shows the 4-week moving average of weekly claims since 1971.
emphasis added
 Click on graph for larger image.
The dashed line on the graph is the current 4-week average. The four-week average of weekly unemployment claims increased to 257,500.
The previous week was revised up.
Weekly claims were lower than the consensus forecast.
Q1 GDP Growth Revised Up to 2.0% Annual Rate
by Calculated Risk on 6/29/2023 08:34:00 AM
From the BEA: Gross Domestic Product (Third Estimate), Corporate Profits (Revised Estimate), and GDP by Industry, First Quarter 2023
Real gross domestic product (GDP) increased at an annual rate of 2.0 percent in the first quarter of 2023, according to the "third" estimate released by the Bureau of Economic Analysis. In the fourth quarter, real GDP increased 2.6 percent.Here is a Comparison of Third and Second Estimates. PCE growth was revised up from 3.8% to 4.2%. Residential investment was revised up from -5.4% to -4.0%.
The GDP estimate released today is based on more complete source data than were available for the "second" estimate issued last month. In the second estimate, the increase in real GDP was 1.3 percent. The updated estimates primarily reflected upward revisions to exports and consumer spending that were partly offset by downward revisions to nonresidential fixed investment and federal government spending. Imports, which are a subtraction in the calculation of GDP, were revised down (refer to "Updates to GDP").
The increase in real GDP in the first quarter reflected increases in consumer spending, exports, state and local government spending, federal government spending, and nonresidential fixed investment that were partly offset by decreases in private inventory investment and residential fixed investment. Imports increased .
emphasis added
Wednesday, June 28, 2023
Thursday: Fed Chair Powell, Unemployment Claims, GDP, Pending Home Sales
by Calculated Risk on 6/28/2023 08:15:00 PM
 Note: Mortgage rates are from MortgageNewsDaily.com and are for top tier scenarios.
Thursday:
• At 2:30 AM ET, Discussion, Fed Chair Jerome Powell, Dialogue with Bank of Spain Governor Pablo Hernández de Cos, At the Banco de España Fourth Conference on Financial Stability, Madrid, Spain
• At 8:30 AM, The initial weekly unemployment claims report will be released. The consensus is for 266 thousand initial claims, up from 264 thousand last week.
• Also at 8:30 AM, Gross Domestic Product, 1st quarter 2023 (Third estimate). The consensus is that real GDP increased 1.4% annualized in Q1, up from the second estimate of a 1.3% increase.
• At 10:00 AM, Pending Home Sales Index for May. The consensus is for a 0.3% decrease in the index.
Las Vegas May 2023: Visitor Traffic Up 1.5% YoY; Convention Traffic up 16% YoY
by Calculated Risk on 6/28/2023 02:55:00 PM
Note: I like using Las Vegas as a measure of recovery for both leisure (visitors) and business (conventions).
From the Las Vegas Visitor Authority: May 2023 Las Vegas Visitor Statistics
Supported by strong demand along with multiple weekend music festivals including the Lovers & Friends festival, Sick New World festival and the recurring Electric Daisy Carnival (EDC) event, Las Vegas hosted approx. 3.5M visitors, 1.5% ahead of last May.
Overall hotel occupancy reached 84.4% for the month (+1.8 pts YoY). Weekend occupancy was healthy at 93.2%, +1.3 pts YoY, and Midweek occupancy approached 81%, surpassing last May by 2.0 pts.
Overall ADR exceeded $183, +4.3% from May 2022 while RevPAR neared $155, +6.6% YoY
 Click on graph for larger image.
 The first graph shows visitor traffic for 2019 (Black), 2020 (light blue), 2021 (purple), 2022 (orange), and 2023 (red).
Visitor traffic was down 5.2% compared to the same month in 2019.
Visitor traffic was up 1.5% compared to last May.
The second graph shows convention traffic.
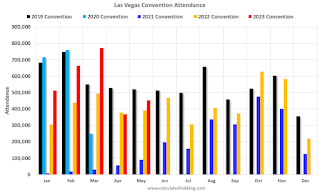
Convention traffic was down 12.8% compared to May 2019, and up 16.1% compared to May 2022.The second graph shows convention traffic.

Note: There was almost no convention traffic from April 2020 through May 2021.
Inflation Adjusted House Prices 3.8% Below Peak; Price-to-rent index is 8.4% below recent peak
by Calculated Risk on 6/28/2023 11:11:00 AM
Today, in the Calculated Risk Real Estate Newsletter: Inflation Adjusted House Prices 3.8% Below Peak; Price-to-rent index is 8.4% below recent peak
Excerpt:
It has been over 17 years since the bubble peak. In the April Case-Shiller house price index released yesterday, the seasonally adjusted National Index (SA), was reported as being 62% above the bubble peak in 2006. However, in real terms, the National index (SA) is about 11% above the bubble peak (and historically there has been an upward slope to real house prices). The composite 20, in real terms, is 1% above the bubble peak.
The inflation adjusted indexes increased in real terms in April using CPI ex-shelter.
People usually graph nominal house prices, but it is also important to look at prices in real terms. As an example, if a house price was $200,000 in January 2000, the price would be $341,000 today adjusted for inflation (70.5% increase). That is why the second graph below is important - this shows "real" prices.
The third graph shows the price-to-rent ratio, and the fourth graph is the affordability index. The last graph shows the 5-year real return based on the Case-Shiller National Index.
There is much more in the article. You can subscribe at https://calculatedrisk.substack.com/
CNBC: Fed Chair "Powell says more ‘restriction’ is coming"
by Calculated Risk on 6/28/2023 09:59:00 AM
Fed Chair Jerome Powell is participating in a panel discussion today at the European Central Bank (ECB) Forum on Central Banking 2023 in Sintra, Portugal.
From Jeff Cox at CNBC: Powell says more ‘restriction’ is coming, including possibility of hikes at consecutive meetings. Excerpt:
“We believe there’s more restriction coming,” Powell said during a monetary policy session in Sintra, Portugal. “What’s really driving it ... is a very strong labor market.”
...
“I wouldn’t take, you know, moving at consecutive meetings off the table,” he said during an exchange moderated by CNBC’s Sara Eisen
MBA: Mortgage Applications Increased in Weekly Survey
by Calculated Risk on 6/28/2023 07:00:00 AM
From the MBA: Mortgage Applications Increase in Latest MBA Weekly Survey
Mortgage applications increased 3.0 percent from one week earlier, according to data from the Mortgage Bankers Association’s (MBA) Weekly Mortgage Applications Survey for the week ending June 23, 2023. This week’s results include an adjustment for Juneteenth holiday.
The Market Composite Index, a measure of mortgage loan application volume, increased 3.0 percent on a seasonally adjusted basis from one week earlier. On an unadjusted basis, the Index decreased 8 percent compared with the previous week. The Refinance Index increased 3 percent from the previous week and was 32 percent lower than the same week one year ago. The seasonally adjusted Purchase Index increased 3 percent from one week earlier. The unadjusted Purchase Index decreased 8 percent compared with the previous week and was 21 percent lower than the same week one year ago.
“Mortgage rate changes varied across loan types last week, with the 30-year fixed rate increasing slightly to 6.75 percent. The spread between the jumbo and conforming rates widened to 16 basis points, the third week in a row that the jumbo rate was higher than the conforming rate. To put this into perspective, from May 2022 to May 2023, the jumbo rate averaged around 30 basis points less than the conforming rate,” said Joel Kan, MBA’s Vice President and Deputy Chief Economist. “Purchase applications increased for the third consecutive week to the highest level of activity since early May but remained more than 20 percent lower than year ago levels. New home sales have been driving purchase activity in recent months as buyers look for options beyond the existing-home market. Existing-home sales continued to be held back by a lack of for-sale inventory as many potential sellers are holding on to their lower-rate mortgages.
...
The average contract interest rate for 30-year fixed-rate mortgages with conforming loan balances ($726,200 or less) increased to 6.75 percent from 6.73 percent, with points remaining at 0.64 (including the origination fee) for 80 percent loan-to-value ratio (LTV) loans.
emphasis added
 Click on graph for larger image.
The first graph shows the MBA mortgage purchase index.
According to the MBA, purchase activity is down 21% year-over-year unadjusted.
Red is a four-week average (blue is weekly). This is at the highest level since early May - but close to the lowest level since the mid-'90s!

The second graph shows the refinance index since 1990.
With higher mortgage rates, the refinance index declined sharply in 2022 - and has mostly flat lined at a low level since then.
Tuesday, June 27, 2023
Wednesday: Fed Chair Powell, Stress Test Results
by Calculated Risk on 6/27/2023 08:27:00 PM
 Note: Mortgage rates are from MortgageNewsDaily.com and are for top tier scenarios.
Wednesday:
• At 7:00 AM ET, The Mortgage Bankers Association (MBA) will release the results for the mortgage purchase applications index.
• At 9:30 AM, Discussion, Fed Chair Jerome Powell, Policy Panel Discussion, At the European Central Bank (ECB) Forum on Central Banking 2023, Sintra, Portugal
• At 4:30 PM, Fed Bank Stress Test Results
New Home Sales increase to 763,000 Annual Rate in May; Median New Home Price is Down 16.2% from the Peak
by Calculated Risk on 6/27/2023 10:46:00 AM
Today, in the Calculated Risk Real Estate Newsletter: New Home Sales increase to 763,000 Annual Rate in May
Brief excerpt:
The next graph shows new home sales for 2022 and 2023 by month (Seasonally Adjusted Annual Rate). Sales in May 2023 were up 20.0% from May 2022. Year-to-date sales are down 4.7% compared to the same period in 2022.You can subscribe at https://calculatedrisk.substack.com/.
As expected, new home sales were up year-over-year in May.
...
As previously discussed, the Census Bureau overestimates sales, and underestimates inventory when cancellation rates are rising, see: New Home Sales and Cancellations: Net vs Gross Sales. This has reversed now since cancellation rates have started to decline. When a previously cancelled home is resold, the home builder counts it as a sale, but the Census Bureau does not (since it was already counted).
[Rick Palacios Jr., Director of Research at John Burns Research and Consulting] told me that the builders have resold most of their previously cancelled homes.Yes on resold question. If that weren’t true we’d be seeing finished standing inventory still high, but it too is quickly falling in our survey & also below what builders (and we) consider normal. All part of why builders started stepping on the starts gas pedal last few months.There are still a large number of homes under construction, but in general, this is another positive report for new home sales.

New Home Sales increase to 763,000 Annual Rate in May
by Calculated Risk on 6/27/2023 10:06:00 AM
The Census Bureau reports New Home Sales in May were at a seasonally adjusted annual rate (SAAR) of 763 thousand.
The previous three months were revised down slightly, combined.
Sales of new single‐family houses in May 2023 were at a seasonally adjusted annual rate of 763,000, according to estimates released jointly today by the U.S. Census Bureau and the Department of Housing and Urban Development. This is 12.2 percent above the revised April rate of 680,000 and is 20.0 percent above the May 2022 estimate of 636,000.
emphasis added
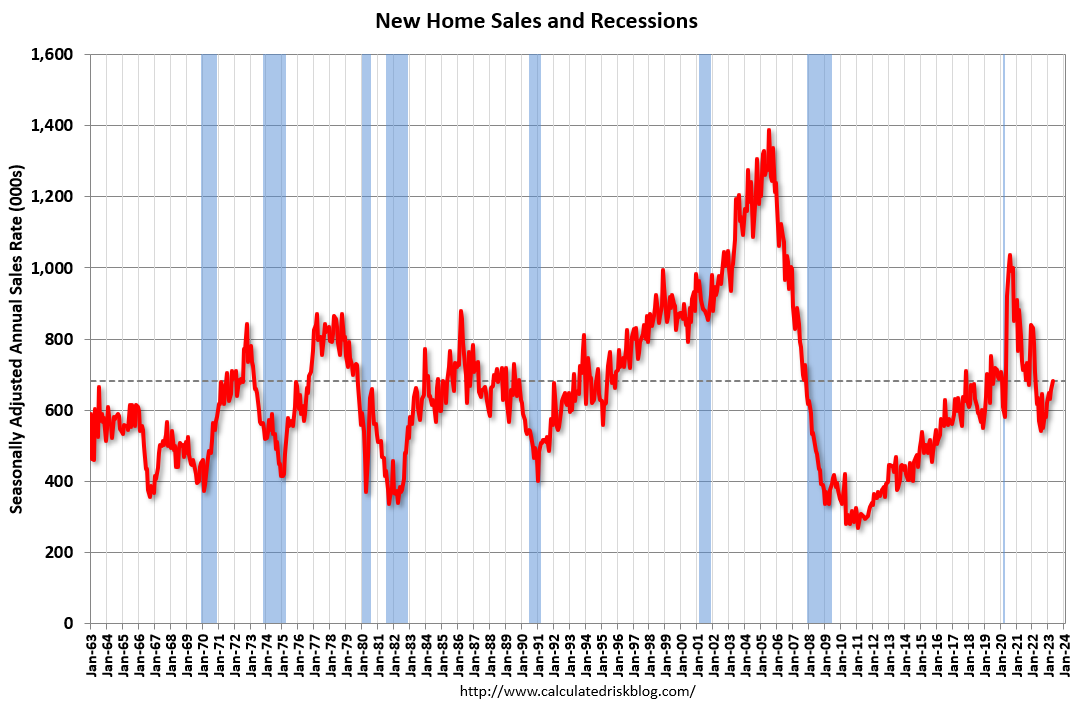
 Click on graph for larger image.
The first graph shows New Home Sales vs. recessions since 1963. The dashed line is the current sales rate.
New home sales are above pre-pandemic levels.
The second graph shows New Home Months of Supply.
 The months of supply decreased in May to 6.7 months from 7.6 months in April.
 The all-time record high was 12.2 months of supply in January 2009. The all-time record low was 3.3 months in August 2020.
This is above the top of the normal range (about 4 to 6 months of supply is normal).
"The seasonally‐adjusted estimate of new houses for sale at the end of May was 428,000. This represents a supply of 6.7 months at the current sales rate."Sales were well above expectations of 657 thousand SAAR, however, sales in the three previous months were revised down slightly, combined. I'll have more later today.
Comments on April Case-Shiller and FHFA House Prices
by Calculated Risk on 6/27/2023 09:41:00 AM
Today, in the Calculated Risk Real Estate Newsletter: Case-Shiller: National House Price Index Decreased 0.2% year-over-year in April
Excerpt:
The recent increase in mortgage rates to near 7% will not impact the Case-Shiller index until reports are released in the Fall.
...
Here is a comparison of year-over-year change in median house prices from the NAR and the year-over-year change in the Case-Shiller index. Median prices are distorted by the mix and repeat sales indexes like Case-Shiller and FHFA are probably better for measuring prices. However, in general, the Case-Shiller index follows the median price.
The median price was down 3.1% year-over-year in May, and, as expected, the Case-Shiller National Index was down year-over-year in the April report.
Note: I’ll have more on real prices, price-to-rent and affordability later this week.
Seasonally adjusted house prices have increased over the last three months, and the big question is “Will house prices decline further later this year?”

There is much more in the article. You can subscribe at https://calculatedrisk.substack.com/
Case-Shiller: National House Price Index Decreased 0.2% year-over-year in April
by Calculated Risk on 6/27/2023 09:10:00 AM
S&P/Case-Shiller released the monthly Home Price Indices for April ("April" is a 3-month average of February, March and April closing prices).
This release includes prices for 20 individual cities, two composite indices (for 10 cities and 20 cities) and the monthly National index.
From S&P S&P CoreLogic Case-Shiller Index Continued Gains in April
The S&P CoreLogic Case-Shiller U.S. National Home Price NSA Index, covering all nine U.S. census divisions, reported a -0.2% annual decrease in April, down from a gain of 0.7% in the previous month. The 10-City Composite showed a decrease of -1.2%, down from the -0.7% decrease in the previous month. The 20-City Composite posted a -1.7% year-over-year loss, down from -1.1% in the previous month.
...
Before seasonal adjustment, the U.S. National Index posted a 1.3% month-over-month increase in April, while the 10-City and 20-City Composites both posted increases of 1.7%.
After seasonal adjustment, the U.S. National Index posted a month-over-month increase of 0.5%, while the 10-City Composite gained 1.0% and 20-City Composites posted an increase of 0.9%.
“The U.S. housing market continued to strengthen in April 2023, says Craig J. Lazzara, Managing Director at S&P DJI. “Home prices peaked in June 2022, declined until January 2023, and then began to recover. The National Composite rose by 1.3% in April (repeating March’s performance), and now stands only 2.4% below its June 2022 peak. Our 10- and 20-City Composites both gained 1.7% in April.
“The ongoing recovery in home prices is broadly based. Before seasonal adjustments, prices rose in all 20 cities in April (as they had also done in March). Seasonally adjusted data showed rising prices in 19 cities in April (versus 14 in March).
emphasis added
 Click on graph for larger image.
 The first graph shows the nominal seasonally adjusted Composite 10, Composite 20 and National indices (the Composite 20 was started in January 2000).
The Composite 10 index is up 0.5% in April (SA) and down 2.7% from the recent peak in June 2022.
The Composite 20 index is up 1.0% (SA) in April and down 3.3% from the recent peak in June 2022.
The National index is up 0.9% (SA) in April and is down 1.8% from the peak in June 2022.
 The second graph shows the year-over-year change in all three indices.
The Composite 10 SA is down 1.2% year-over-year. The Composite 20 SA is down 1.7% year-over-year.
The National index SA is down 0.2% year-over-year.
Annual price changes were below expectations. I'll have more later.
Monday, June 26, 2023
Tuesday: Case-Shiller House Prices, New Home Sales, Durable Goods
by Calculated Risk on 6/26/2023 09:02:00 PM
 From Matthew Graham at Mortgage News Daily: Mortgage Rates Effectively Unchanged Near Recent Highs
The average 30yr fixed mortgage rate has been holding just under 7% for the entire month, making June the least volatile month in well over a year. [30 year fixed 6.91%]Tuesday:
emphasis added
• At 8:30 AM ET, Durable Goods Orders for May from the Census Bureau. The consensus is for a 1.3% decrease in durable goods orders.
• At 9:00 AM, S&P/Case-Shiller House Price Index for April. The consensus is for a 1.1% year-over-year decrease in the Comp 20 index for April.
• Also at 9:00 AM, FHFA House Price Index for April. This was originally a GSE only repeat sales, however there is also an expanded index.
• At 10:00 AM, New Home Sales for May from the Census Bureau. The consensus is for 657 thousand SAAR, down from 683 thousand in April.
• Also at 10:00 AM, Richmond Fed Survey of Manufacturing Activity for June.
Fannie and Freddie Serious Delinquencies in May: Single Family Declined, Multi-Family Increased
by Calculated Risk on 6/26/2023 04:57:00 PM
Today, in the Calculated Risk Real Estate Newsletter: Fannie and Freddie Serious Delinquencies in May: Single Family Declined, Multi-Family Increased
Brief excerpt:
Single-family serious delinquencies continued to decline in May, however, multi-family serious delinquencies are now increasing.You can subscribe at https://calculatedrisk.substack.com/.
...
Freddie Mac reports that multi-family delinquencies increased to 0.20% in May, up from 0.07% in May 2022.
This graph shows the Freddie multi-family serious delinquency rate since 2012. Rates were still high in 2012 following the housing bust and financial crisis.
The multi-family rate increased following the pandemic and has increased recently as rent growth has slowed, vacancy rates have increased, and interest rates have increased sharply. This will be something to watch as rents soften.

Update on Four High Frequency Indicators
by Calculated Risk on 6/26/2023 10:01:00 AM
I stopped the weekly updates of high frequency indicators at the end of 2022.
Here is a mid-year look at four indicators:
The TSA is providing daily travel numbers.
This data is as of June 25th.
 Click on graph for larger image.
This data shows the 7-day average of daily total traveler throughput from the TSA for 2019 (Light Blue), 2020 (Black), 2021 (Blue), 2022 (Orange) and 2023 (Red).
The dashed line is the percent of 2019 for the seven-day average.
The 7-day average is at the same level as the same week in 2019 (100.5% of 2019). (Dashed line)
Air travel - as a percent of 2019 - is tracking pre-pandemic levels.
----- Movie Tickets: Box Office Mojo -----
 This data shows domestic box office for each week and the median for the years 2016 through 2019 (dashed light blue).
 This data shows domestic box office for each week and the median for the years 2016 through 2019 (dashed light blue).
 Black is 2020, Blue is 2021 and Red is 2022.
The data is from BoxOfficeMojo through June 22nd.
Note that the data is usually noisy week-to-week and depends on when blockbusters are released.
Movie ticket sales (dollars) are running close to the pre-pandemic levels.
Note that the data is usually noisy week-to-week and depends on when blockbusters are released.
Movie ticket sales (dollars) are running close to the pre-pandemic levels.
 This graph shows the seasonal pattern for the hotel occupancy rate using the four-week average.
 The red line is for 2023, black is 2020, blue is the median, and dashed light blue is for 2022. Dashed purple is for 2018, the record year for hotel occupancy.
This data is through June 17th. The occupancy rate was down 1,1% compared to the same week in 2022.
The 4-week average of the occupancy rate is at the median rate for the period 2000 through 2022 (Blue).
Notes: Y-axis doesn't start at zero to better show the seasonal change.
Notes: Y-axis doesn't start at zero to better show the seasonal change.

This graph, based on weekly data from the U.S. Energy Information Administration (EIA) shows gasoline supplied compared to the same week of 2019.
Blue is for 2020. Purple is for 2021, and Orange is for 2022, and Red is for 2023.
Gasoline supplied in 2023 is running about 5% below 2019 levels.
Housing June 26th Weekly Update: Inventory Increased 2.0% Week-over-week
by Calculated Risk on 6/26/2023 08:21:00 AM
Altos reports that active single-family inventory was up 2.0% week-over-week.
 Click on graph for larger image.
This inventory graph is courtesy of Altos Research.
As of June 16th, inventory was at 460 thousand (7-day average), compared to 451 thousand the prior week.
Year-to-date, inventory is down 6.3%. And inventory is up 13.4% from the seasonal bottom ten weeks ago.

The red line is for 2023. The black line is for 2019. Note that inventory is up from the previous two years (the record low was in 2022), but still well below normal levels.
Inventory was up 4.3% compared to the same week in 2022 (last week it was up 8.5%), and down 51.8% compared to the same week in 2019 (last week down 52.1%).
It appears likely inventory will be down year-over-year next week.
Mike Simonsen discusses this data regularly on Youtube.
Sunday, June 25, 2023
Sunday Night Futures
by Calculated Risk on 6/25/2023 07:05:00 PM
Weekend:
• Schedule for Week of June 25, 2023
Monday:
• At 10:30 AM ET, Dallas Fed Survey of Manufacturing Activity for June.
From CNBC: Pre-Market Data and Bloomberg futures S&P 500 are up 6 and DOW futures are up 40 (fair value).
Oil prices were down over the last week with WTI futures at $69.16 per barrel and Brent at $73.85 per barrel. A year ago, WTI was at $109, and Brent was at $117 - so WTI oil prices are down about 37% year-over-year.
Here is a graph from Gasbuddy.com for nationwide gasoline prices. Nationally prices are at $3.56 per gallon. A year ago, prices were at $4.90 per gallon, so gasoline prices are down $1.34 per gallon year-over-year.
A Very Early Look at 2024 Cost-Of-Living Adjustments and Maximum Contribution Base
by Calculated Risk on 6/25/2023 08:12:00 AM
The BLS reported on June 13th:
The Consumer Price Index for Urban Wage Earners and Clerical Workers (CPI-W) increased 3.6 percent over the last 12 months to an index level of 298.382 (1982-84=100). For the month, the index increased 0.2 percent prior to seasonal adjustment.CPI-W is the index that is used to calculate the Cost-Of-Living Adjustments (COLA). The calculation dates have changed over time (see Cost-of-Living Adjustments), but the current calculation uses the average CPI-W for the three months in Q3 (July, August, September) and compares to the average for the highest previous average of Q3 months. Note: this is not the headline CPI-U and is not seasonally adjusted (NSA).
• In 2022, the Q3 average of CPI-W was 291.901.
The 2022 Q3 average was the highest Q3 average, so we only have to compare Q3 this year to last year.
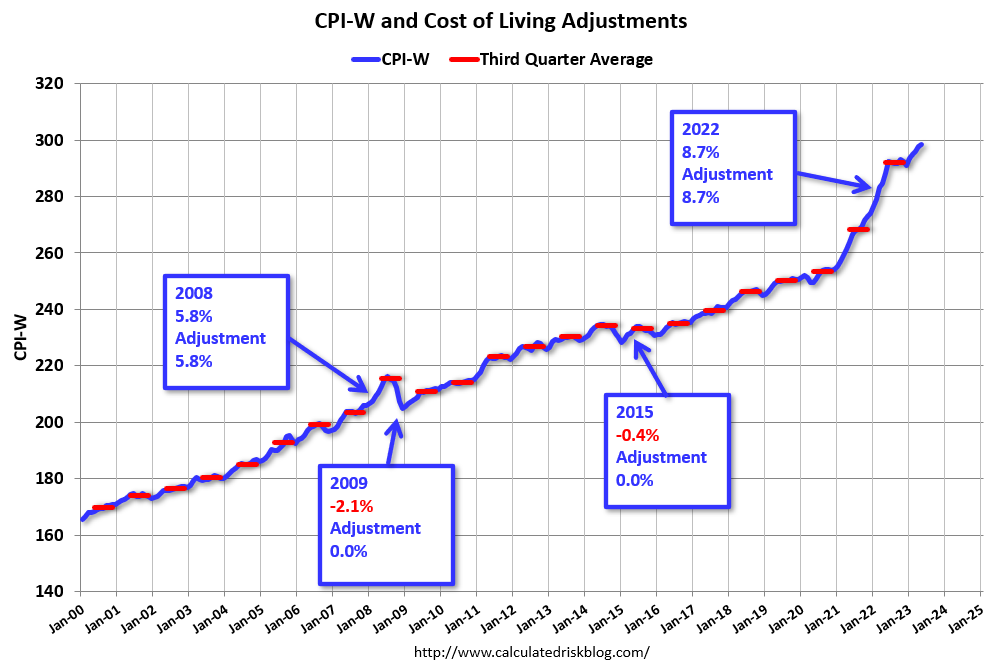 Click on graph for larger image.
This graph shows CPI-W since January 2000. The red lines are the Q3 average of CPI-W for each year.
Note: The year labeled is for the calculation, and the adjustment is effective for December of that year (received by beneficiaries in January of the following year).
CPI-W was up 3.6% year-over-year in May, and although this is very early - we need the data for July, August and September - my very early guess is COLA will probably be close to 3% this year, the smallest increase since 1.3% in 2021.
Contribution and Benefit Base
The contribution base will be adjusted using the National Average Wage Index. This is based on a one-year lag. The National Average Wage Index is not available for 2022 yet, wages increased solidly in 2022. If wages increased 5% in 2022, then the contribution base next year will increase to around $168,200 in 2024, from the current $160,200.
Remember - this is a very early look. What matters is average CPI-W, NSA, for all three months in Q3 (July, August and September).
Saturday, June 24, 2023
Real Estate Newsletter Articles this Week: Record Number of Multi-Family Housing Units Under Construction
by Calculated Risk on 6/24/2023 02:11:00 PM
At the Calculated Risk Real Estate Newsletter this week:
• NAR: Existing-Home Sales Increased to 4.30 million SAAR in May; Median Prices Declined 3.1% YoY in May
• May Housing Starts: Record Number of Multi-Family Housing Units Under Construction
• Some More Good News for Homebuilders
• Final Look at Local Housing Markets in May
• California Home Sales Down 23.6% YoY in May, Median Prices Decline 6.4% YoY
This is usually published 4 to 6 times a week and provides more in-depth analysis of the housing market.
You can subscribe at https://calculatedrisk.substack.com/
Most content is available for free (and no Ads), but please subscribe!
Schedule for Week of June 25, 2023
by Calculated Risk on 6/24/2023 08:11:00 AM
The key reports this week are May New Home sales, the third estimate of Q1 GDP, Personal Income and Outlays for May and April Case-Shiller house prices.
For manufacturing, the June Richmond and Dallas Fed manufacturing surveys will be released.
10:30 AM: Dallas Fed Survey of Manufacturing Activity for June.
8:30 AM: Durable Goods Orders for May from the Census Bureau. The consensus is for a 1.3% decrease in durable goods orders.
 9:00 AM: S&P/Case-Shiller House Price Index for April.
This graph shows the year-over-year change in the seasonally adjusted National Index, Composite 10 and Composite 20 indexes through the most recent report (the Composite 20 was started in January 2000).
The consensus is for a 1.1% year-over-year decrease in the Comp 20 index for April.
9:00 AM: FHFA House Price Index for April. This was originally a GSE only repeat sales, however there is also an expanded index.
 10:00 AM: New Home Sales for May from the Census Bureau.
 This graph shows New Home Sales since 1963. The dashed line is the sales rate for last month.
The consensus is for 657 thousand SAAR, down from 683 thousand in April.
10:00 AM: Richmond Fed Survey of Manufacturing Activity for June.
7:00 AM ET: The Mortgage Bankers Association (MBA) will release the results for the mortgage purchase applications index.
9:30 AM: Discussion, Fed Chair Jerome Powell, Policy Panel Discussion, At the European Central Bank (ECB) Forum on Central Banking 2023, Sintra, Portugal
4:30 PM: Fed Bank Stress Test Results
2:30 AM: Discussion, Fed Chair Jerome Powell, Dialogue with Bank of Spain Governor Pablo Hernández de Cos, At the Banco de España Fourth Conference on Financial Stability, Madrid, Spain
8:30 AM: The initial weekly unemployment claims report will be released. The consensus is for 266 thousand initial claims, up from 264 thousand last week.
8:30 AM: Gross Domestic Product, 1st quarter 2023 (Third estimate). The consensus is that real GDP increased 1.4% annualized in Q1, up from the second estimate of a 1.3% increase.
10:00 AM: Pending Home Sales Index for May. The consensus is for a 0.3% decrease in the index.
8:30 AM ET: Personal Income and Outlays, May 2023. The consensus is for a 0.4% increase in personal income, and for a 0.2% increase in personal spending. And for the Core PCE price index to increase 0.4%. PCE prices are expected to be up 3.8% YoY, and core PCE prices up 4.7% YoY.
9:45 AM: Chicago Purchasing Managers Index for June.
10:00 AM: University of Michigan's Consumer sentiment index (Final for June). The consensus is for a reading of 63.9.
Friday, June 23, 2023
June 23rd COVID Update: New Pandemic Lows for Deaths and Hospitalizations
by Calculated Risk on 6/23/2023 08:01:00 PM
 Note: Mortgage rates are from MortgageNewsDaily.com and are for top tier scenarios.
Due to changes at the CDC, weekly cases are no longer updated.
After the first few weeks, the pandemic low for weekly deaths had been the week of July 7, 2021, at 1,690 deaths (until recently).
For COVID hospitalizations, the previous low was 9,821 (until recently).
| COVID Metrics | ||||
|---|---|---|---|---|
| Now | Week Ago | Goal | ||
| Hospitalized2 | 6,133 | 6,642 | ≤3,0001 | |
| Deaths per Week2 | 653 | 709 | ≤3501 | |
| 1my goals to stop weekly posts, 2Weekly for Currently Hospitalized, and Deaths 🚩 Increasing number weekly for Hospitalized and Deaths ✅ Goal met. | ||||
 Click on graph for larger image.
This graph shows the weekly (columns) number of deaths reported.
For deaths, I'm currently using 3 weeks ago for "now", since the most recent two weeks will be revised significantly.
On Hospitalizations (table data above is from last week):
"COVID-19 hospitalization data will not be updated during the week of June 19, 2023, due to a change in required reporting cadence from daily to weekly, following the expiration of the federal Public Health Emergency (PHE) declaration. COVID-19 hospitalization data will be updated each Monday beginning June 26, 2023."
Philly Fed: State Coincident Indexes Increased in all 50 States in May (3-Month Basis)
by Calculated Risk on 6/23/2023 04:25:00 PM
From the Philly Fed:
The Federal Reserve Bank of Philadelphia has released the coincident indexes for the 50 states for May 2023. Over the past three months, the indexes increased in all 50 states, for a three-month diffusion index of 100. Additionally, in the past month, the indexes increased in 47 states, decreased in one state, and remained stable in two, for a one-month diffusion index of 92. For comparison purposes, the Philadelphia Fed has also developed a similar coincident index for the entire United States. The Philadelphia Fed’s U.S. index increased 0.8 percent over the past three months and 0.1 percent in May.Note: These are coincident indexes constructed from state employment data. An explanation from the Philly Fed:
emphasis added
The coincident indexes combine four state-level indicators to summarize current economic conditions in a single statistic. The four state-level variables in each coincident index are nonfarm payroll employment, average hours worked in manufacturing by production workers, the unemployment rate, and wage and salary disbursements deflated by the consumer price index (U.S. city average). The trend for each state’s index is set to the trend of its gross domestic product (GDP), so long-term growth in the state’s index matches long-term growth in its GDP.
 Click on map for larger image.
Here is a map of the three-month change in the Philly Fed state coincident indicators. This map was all red during the worst of the Pandemic and also at the worst of the Great Recession.
The map is all positive on a three-month basis.
Source: Philly Fed.
 And here is a graph is of the number of states with one month increasing activity according to the Philly Fed.
 This graph includes states with minor increases (the Philly Fed lists as unchanged).
In May, 47 states had increasing activity including minor increases.
In May, 47 states had increasing activity including minor increases.
Q2 GDP Tracking: Around 1.5%
by Calculated Risk on 6/23/2023 01:01:00 PM
From BofA:
Overall, data since our last weekly publication moved up our 2Q GDP tracking estimate from 1.3% q/q saar to 1.4% and our 1Q GDP tracking remained at 1.8% q/q saar. [June 23rd estimate]From Goldman:
emphasis added
[W]e left our Q2 GDP tracking estimate unchanged at +1.8% (qoq ar). [June 22nd estimate]And from the Altanta Fed: GDPNow
The GDPNow model estimate for real GDP growth (seasonally adjusted annual rate) in the second quarter of 2023 is 1.9 percent on June 20, up from 1.8 percent on June 15. [June 20th estimate]
Final Look at Local Housing Markets in May
by Calculated Risk on 6/23/2023 09:52:00 AM
Today, in the Calculated Risk Real Estate Newsletter: Final Look at Local Housing Markets in May
A brief excerpt:
Each month I track closed sales, new listings and active inventory in a sample of local markets around the country (over 40 local housing markets) in the US to get an early sense of changes in the housing market. In addition, we can look for regional differences. For example, listings in Texas and Florida are up more than in most other areas, and sales are down less year-over-year.There is much more in the article. You can subscribe at https://calculatedrisk.substack.com/
...
And a table of May sales.
In May, sales in these markets were down 17.4%. In April, these same markets were down 26.1% YoY Not Seasonally Adjusted (NSA).
My early expectation is we will see a somewhat similar level of sales in June on a seasonally adjusted annual rate basis (SAAR) as in May. 30-year mortgage rates averaged about 6.4% in March and April (for closed sales in May), and 30-year rates averaged close to 6.4% in April and May.
On a Not Seasonally Adjusted (NSA) basis, June is usually the strongest month of the calendar year for closed sales, followed by July and August.
...
More local data coming in July for activity in June!

Black Knight: "Past-Due Mortgages Approach Recent Record Lows" in May
by Calculated Risk on 6/23/2023 08:21:00 AM
From Black Knight: Black Knight: Past-Due Mortgages Approach Recent Record Lows as Serious Delinquencies Continue Improvement; Prepayments See Seasonal Rise
• Reversing much of April’s calendar-driven spike, the national delinquency rate fell 11 basis points (bps) in May to hit 3.10% – the lowest it’s been other than March 2023’s record of 2.92%According to Black Knight's First Look report, the percent of loans delinquent decreased 6% in May compared to April and decreased 3% year-over-year.
• The number of borrowers a single payment past due improved by 94K (-9.5%), erasing nearly half of the prior month’s increase
• Serious delinquencies (loans 90 or more days past due) continued to improve nationally – falling by 18K (-3.7%) from April, putting this loan population down more than 200K (nearly 30%) since May 2022
• Though foreclosure starts increased to 25.4K for the month (+2.2%), they remain near April’s 6-month low and 41% below the same period in 2019, the last comparable May before the pandemic
• Foreclosure actions were started on 5.1% of serious delinquencies in May, up only marginally from April and still more than a full percentage point below the March 2020 rate at the start of the pandemic
• The number of loans in active foreclosure improved by 4K during the month and is now down 41K (-15%) from March 2020, with foreclosure sales (completions) rising 5.5% from April to 6.8K
• Prepayment activity rose to a 0.54% single-month mortality (SMM) rate – the highest level seen since September 2022, despite interest rates in the 6.7% range – but is still down 40% from May 2022
emphasis added
Black Knight reported the U.S. mortgage delinquency rate (loans 30 or more days past due, but not in foreclosure) was 3.10% in May, down from 3.31% the previous month.
The percent of loans in the foreclosure process decreased in May to 0.43%, from 0.44% the previous month.
The number of delinquent properties, but not in foreclosure, is down 20,000 properties year-over-year, and the number of properties in the foreclosure process is up 8,000 properties year-over-year.
| Black Knight: Percent Loans Delinquent and in Foreclosure Process | ||||
|---|---|---|---|---|
| May 2023 | Apr 2023 | |||
| Delinquent | 3.10% | 3.31% | ||
| In Foreclosure | 0.43% | 0.44% | ||
| Number of properties: | ||||
| Number of properties that are delinquent, but not in foreclosure: | 1,639,000 | 1,746,000 | ||
| Number of properties in foreclosure pre-sale inventory: | 234,000 | 229,000 | ||
| Total Properties | 1,868,000 | 1,980,000 | ||
Thursday, June 22, 2023
June Vehicle Sales Forecast: 15.9 million SAAR, Up Sharply YoY
by Calculated Risk on 6/22/2023 06:45:00 PM
From WardsAuto: June U.S. Light-Vehicle Sales Pegged for 21% Gain; Q2 to Roll in at 2-Year-High 15.7 Million SAAR (pay content). Brief excerpt:
Deliveries in the second quarter will total 4.1 million units, 18% above like-2022, and stronger than Q1’s 8% gain. First-half 2023 volume will total 7.67 million units, up 13% from January-June 2022’s 6.78 million.
emphasis added
 Click on graph for larger image.
This graph shows actual sales from the BEA (Blue), and Wards forecast for June (Red).
The Wards forecast of 15.9 million SAAR, would be up 5.7% from last month, and up 21.9% from a year ago.
Vehicle sales are usually a transmission mechanism for Federal Open Market Committee (FOMC) policy, although far behind housing. This time vehicle sales were more suppressed by supply chain issues and have picked up recently.
Realtor.com Reports Weekly Active Inventory Up 5% YoY; New Listings Down 26% YoY
by Calculated Risk on 6/22/2023 03:31:00 PM
Realtor.com has monthly and weekly data on the existing home market. Here is their weekly report from economist Danielle Hale: Weekly Housing Trends View — Data Week Ending June 17, 2023
• Active inventory growth slowed again, with for-sale homes up just 5% above one year ago. The number of homes for sale continues to grow, but the advantage over one year ago is shrinking and likely to slow in the months ahead. As mortgage rates surged in 2022, both buyers and sellers adjusted plans and expectations, and the number of for-sale homes on the market climbed sharply. As we lap the biggest increases in inventory last year, lower interest from homeowners in selling today is eating into the total number of options for buyers, especially with existing home sales largely steadying. This is a contributor to the big shift in expectations we have for inventory in 2023, which will likely decline for the year as a whole.
• New listings–a measure of sellers putting homes up for sale–were down again this week, by 26% from one year ago. The number of newly listed homes has been lower than the same time the previous year for the past 50 weeks. Despite an uptick in seller confidence in May, with an increasing share of consumers saying now is a good time to sell, a smaller number of homeowners are choosing to list homes for sale, limiting the number of cumulative options that home shoppers are likely to see over the course of their search.
 Here is a graph of the year-over-year change in inventory according to realtor.com.
 Inventory is still up year-over-year - from record lows - however, the YoY increase has slowed sharply recently.
This was the smallest YoY increase since May 2022.
The recent trend suggests active inventory will likely be down YoY in the next couple of weeks!
Hotels: Occupancy Rate Down 1.1% Year-over-year
by Calculated Risk on 6/22/2023 02:01:00 PM
U.S. hotel performance increased from the previous week, but year-over-year comparisons were mixed, according to STR‘s latest data through 17 June.The following graph shows the seasonal pattern for the hotel occupancy rate using the four-week average.
11-17 June 2023 (percentage change from comparable week in 2022):
• Occupancy: 70.8% (-1.1%)
• Average daily rate (ADR): US$159.82 (+2.6%)
• Revenue per available room (RevPAR): US$113.17 (+1.5%)
emphasis added
Click on graph for larger image.The red line is for 2023, black is 2020, blue is the median, and dashed light blue is for 2022. Dashed purple is for 2018, the record year for hotel occupancy.
The 4-week average of the occupancy rate is at the median rate for the period 2000 through 2022 (Blue).
Note: Y-axis doesn't start at zero to better show the seasonal change.
The 4-week average of the occupancy rate will increase during the summer travel season.
NAR: Existing-Home Sales Increased to 4.30 million SAAR in May; Median Prices Declined 3.1% YoY
by Calculated Risk on 6/22/2023 10:41:00 AM
Today, in the CalculatedRisk Real Estate Newsletter: NAR: Existing-Home Sales Increased to 4.30 million SAAR in May; Median Prices Declined 3.1% YoY
Excerpt:
On prices, the NAR reported:There is much more in the article. You can subscribe at https://calculatedrisk.substack.com/ Please subscribe!The median existing-home price for all housing types in May was $396,100, a decline of 3.1% from May 2022 ($408,600). Prices grew in the Northeast and Midwest but fell in the South and West.Median prices are distorted by the mix (repeat sales indexes like Case-Shiller and FHFA are probably better for measuring prices).
The YoY change in the median price peaked at 25.2% in May 2021 and prices are now down 3.1% YoY. Median house prices increased 2.6% from April to May and are down 4.3% from the peak in June 2022 (NSA). It is likely the Case-Shiller index will be down soon year-over-year.
Note that closed sales in May were mostly for contracts signed in March and April. Mortgage rates, according to the Freddie Mac PMMS, average around 6.4% in March and April. June sales will be for contracts signed in April and May, when mortgage rates also averaged around 6.4%, so closed sales will likely be similar in June compared to May.

NAR: Existing-Home Sales Increased to 4.30 million SAAR in May
by Calculated Risk on 6/22/2023 10:11:00 AM
From the NAR: Existing-Home Sales Edged Higher by 0.2% in May
Existing-home sales marginally increased in May, according to the National Association of REALTORS®. Sales were mixed among the four major U.S. regions, with the South and West posting improvements and the Northeast and Midwest experiencing pullbacks. All four regions experienced year-over-year sales declines.
Total existing-home sales – completed transactions that include single-family homes, townhomes, condominiums and co-ops – rose 0.2% from April to a seasonally adjusted annual rate of 4.30 million in May. Year-over-year, sales dropped 20.4% (down from 5.40 million in May 2022).
...
Total housing inventory registered at the end of May was 1.08 million units, up 3.8% from April but down 6.1% from one year ago (1.15 million). Unsold inventory sits at a 3.0-month supply at the current sales pace, up from 2.9 months in April and 2.6 months in May 2022.
emphasis added
 Click on graph for larger image.
This graph shows existing home sales, on a Seasonally Adjusted Annual Rate (SAAR) basis since 1994.
Sales in May (4.30 million SAAR) were up 0.2% from the previous month and were 20.4% below the May 2022 sales rate.
The second graph shows nationwide inventory for existing homes.
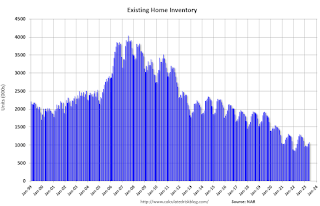 According to the NAR, inventory increased to 1.08 million in May from 1.04 million in April.
 According to the NAR, inventory increased to 1.08 million in May from 1.04 million in April.
Headline inventory is not seasonally adjusted, and inventory usually decreases to the seasonal lows in December and January, and peaks in mid-to-late summer.
The last graph shows the year-over-year (YoY) change in reported existing home inventory and months-of-supply. Since inventory is not seasonally adjusted, it really helps to look at the YoY change. Note: Months-of-supply is based on the seasonally adjusted sales and not seasonally adjusted inventory.
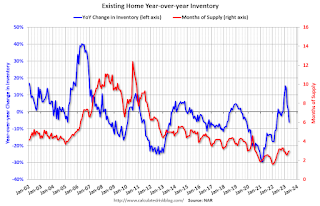 Inventory was down 6.1% year-over-year (blue) in May compared to May 2022.
Months of supply (red) increased to 3.0 months in May from 2.9 months in April.
This was slightly above the consensus forecast. I'll have more later.
The last graph shows the year-over-year (YoY) change in reported existing home inventory and months-of-supply. Since inventory is not seasonally adjusted, it really helps to look at the YoY change. Note: Months-of-supply is based on the seasonally adjusted sales and not seasonally adjusted inventory.
 Inventory was down 6.1% year-over-year (blue) in May compared to May 2022.
 Months of supply (red) increased to 3.0 months in May from 2.9 months in April.
This was slightly above the consensus forecast. I'll have more later.
Weekly Initial Unemployment Claims at 264,000
by Calculated Risk on 6/22/2023 08:34:00 AM
The DOL reported:
In the week ending June 17, the advance figure for seasonally adjusted initial claims was 264,000, unchanged from the previous week's revised level. The previous week's level was revised up by 2,000 from 262,000 to 264,000. The 4-week moving average was 255,750, an increase of 8,500 from the previous week's revised average. This is the highest level for this average since November 13, 2021 when it was 260,000. The previous week's average was revised up by 500 from 246,750 to 247,250.The following graph shows the 4-week moving average of weekly claims since 1971.
emphasis added
 Click on graph for larger image.
The dashed line on the graph is the current 4-week average. The four-week average of weekly unemployment claims increased to 255,750.
The previous week was revised up.
Weekly claims were close to the consensus forecast.
Wednesday, June 21, 2023
Thursday: Unemployment Claims, Existing Home Sales, Fed Chair Powell
by Calculated Risk on 6/21/2023 08:44:00 PM
 Note: Mortgage rates are from MortgageNewsDaily.com and are for top tier scenarios.
Thursday:
• At 8:30 AM ET, The initial weekly unemployment claims report will be released. The consensus is for 266 thousand initial claims, up from 262 thousand last week.
• Also at 8:30 AM, Chicago Fed National Activity Index for May. This is a composite index of other data.
• At 10:00 AM, Existing Home Sales for May from the National Association of Realtors (NAR). The consensus is for 4.24 million SAAR, down from 4.28 million.
• Also at 10:00 AM, Testimony, Fed Chair Jerome Powell, Semiannual Monetary Policy Report to Congress, Before the U.S. Senate Committee on Banking, Housing, and Urban Affairs
• At 11:00 AM, the Kansas City Fed manufacturing survey for June.
AIA: Architecture Billings "Rebound" in May; Multi-family Billings Decline for 11th Consecutive Month
by Calculated Risk on 6/21/2023 12:13:00 PM
Note: This index is a leading indicator primarily for new Commercial Real Estate (CRE) investment.
From the AIA: AAIA/Deltek Architecture Billings Index Indicates Rebound in May Business Conditions
Architecture firms experienced a rebound in billings in May after a downturn in April, according to the latest Architecture Billings Index (ABI) from the American Institute of Architects (AIA) and Deltek. The index score for May was the highest it has been since September 2022. Inquiries into new projects and design contracts also increased this month, reaching their highest levels since February.
The billings score for April increased from 48.5 in April to 51.0 in May (any score above 50 indicates an increase in firm billings). Firms also reported that inquiries into new projects accelerated to 57.2 from 53.9 the previous month. Further, the value of new design contracts also moved up to 52.3 in May from 49.8 in April.
“The modest improvement in overall demand for architectural services that we saw last month is encouraging news", said AIA Chief Economist Kermit Baker Hon. AIA, Ph.D., “However, there continues to be variation in the performance of firms by regional location and building specialization. This suggests that overall business conditions for the profession likely will continue to be variable."
Despite growth in the overall ABI this month, business conditions remain variable in different regions of the country. Billings improved at firms located in the South for the second consecutive month in May, while they were essentially flat at firms located in the Midwest, following six months of growth. However, billings continued to decline at firms located in both the West and Northeast, where scores have been below 50 since last fall.
By firm specialization, business conditions softened further at firms with a multifamily residential specialization in May, falling to the lowest level in two years. Billings also declined for the ninth consecutive month at firms with a commercial/industrial specialization. On the other hand, business conditions improved for the second month in a row at firms with an institutional specialization, as they reported their strongest growth since last year.
...
• Regional averages: South (52.3); Midwest (49.6); Northeast (48.7); West (47.7)
• Sector index breakdown: institutional (53.4); mixed practice (firms that do not have at least half of their billings in any one other category) (52.7); commercial/industrial (47.5); multi-family residential (43.0)
emphasis added
 Click on graph for larger image.
This graph shows the Architecture Billings Index since 1996. The index was at 51.0 in May, up from 48.5 in April. Anything above 50 indicates an increase in demand for architects' services.
Note: This includes commercial and industrial facilities like hotels and office buildings, multi-family residential, as well as schools, hospitals and other institutions.
This index has declined in 6 of the last 8 months. This index usually leads CRE investment by 9 to 12 months, so this index suggests a slowdown in CRE investment later in 2023 and into 2024.
Note that multi-family billing turned down in July 2022 and has been negative for ELEVEN consecutive months. This suggests we will see a downturn in multi-family starts this year.


