 RSS Feed
 by Calculated Risk on 1/31/2023 09:00:00 PM
Tuesday, January 31, 2023
Wednesday: FOMC Statement, Job Openings, ADP Employment, Construction Spending, ISM Mfg
 Note: Mortgage rates are from MortgageNewsDaily.com and are for top tier scenarios.
Wednesday:
• At 7:00 AM ET, The Mortgage Bankers Association (MBA) will release the results for the mortgage purchase applications index.
• At 8:15 AM, The ADP Employment Report for January. This report is for private payrolls only (no government). The consensus is for 170,000 payroll jobs added in January, down from 235,000 added in December.
• At 10:00 AM, Construction Spending for December. The consensus is for a 0.1% decrease in construction spending.
• Also, at 10:00 AM, Job Openings and Labor Turnover Survey for December from the BLS.
• Also, at 10:00 AM, ISM Manufacturing Index for January. The consensus is for the ISM to be at 48.0, down from 48.4 in December.
• At 2:00 PM, FOMC Meeting Announcement. The FOMC is expected to announce a 25 bp hike in the Fed Funds rate.
• At 2:30 PM, Fed Chair Jerome Powell holds a press briefing following the FOMC announcement.
• Late, Light vehicle sales for January. The consensus is for light vehicle sales to be 14.3 million SAAR in January, up from 13.3 million in December (Seasonally Adjusted Annual Rate).
Las Vegas December 2022: Visitor Traffic Down 4.6% Compared to 2019; Convention Traffic Down 38.2%
by Calculated Risk on 1/31/2023 04:00:00 PM
Note: I like using Las Vegas as a measure of recovery for both leisure (visitors) and business (conventions).
From the Las Vegas Visitor Authority: December 2022 Las Vegas Visitor Statistics
From the initial shadow of the omicron variant to record‐shattering room rates later in the year, Las Vegas enjoyed a robust recovery trajectory across core tourism indicators in 2022. With December 2022 visitation just 4.6% shy of December 2019, the year closed out with 38.8M annual visitors, 20.5% ahead of 2021 and ‐8.7% under 2019's tally.
Convention attendance for the year approached 5.0M attendees, dramatically ahead of pandemic‐suppressed volumes of 2021 and recovering to about three‐quarters of 2019's tally of 6.6M convention attendees.
Overall hotel occupancy reached 79.2% for the year , +12.4 pts YoY and down ‐9.7 pts vs. 2019. For the year, Weekend occupancy reached 89.3%, +8.0 pts over 2021 and ‐5.6 pts vs. 2019, while Midweek occupancy reached 74.7%, up 14.2 pts vs. 2021 but down ‐11.6 pts vs. 2019.
Strong room rates continued throughout 2022 as annual ADR reached $171, +24.5% higher than 2021 and +28.9% ahead of 2019 while RevPAR reached approx. $135 for the year, +47.6% YoY and +14.9% over 2019.
 Click on graph for larger image.
 The first graph shows visitor traffic for 2019 (dark blue), 2020 (light blue), 2021 (yellow) and 2022 (red)
Visitor traffic was down 4.6% compared to the same month in 2019.
Visitor traffic was up 10.1% compared to last December.
The second graph shows convention traffic.

Convention traffic was down 38.2% compared to December 2019.The second graph shows convention traffic.

Note: There was almost no convention traffic from April 2020 through May 2021.
HVS: Q4 2022 Homeownership and Vacancy Rates
by Calculated Risk on 1/31/2023 01:31:00 PM
The Census Bureau released the Residential Vacancies and Homeownership report for Q4 2022.
The results of this survey were significantly distorted by the pandemic in 2020.
This report is frequently mentioned by analysts and the media to track household formation, the homeownership rate, and the homeowner and rental vacancy rates. However, there are serious questions about the accuracy of this survey.
This survey might show the trend, but I wouldn't rely on the absolute numbers. Analysts probably shouldn't use the HVS to estimate the excess vacant supply or household formation, or rely on the homeownership rate, except as a guide to the trend.
National vacancy rates in the fourth quarter 2022 were 5.8 percent for rental housing and 0.8 percent for homeowner housing. The rental vacancy rate was not statistically different from the rate in the fourth quarter 2021 (5.6 percent) and not statistically different from the rate in the third quarter 2022 (6.0 percent).
The homeowner vacancy rate of 0.8 percent was not statistically different from the rate in the fourth quarter 2021 (0.9 percent) and not statistically different from the rate in the third quarter 2022 (0.9 percent).
The homeownership rate of 65.9 percent was not statistically different from the rate in the fourth quarter 2021 (65.5 percent) and not statistically different from the rate in the third quarter 2022 (66.0 percent).
emphasis added
 Click on graph for larger image.
The HVS homeownership rate decreased to 65.9% in Q4, from 66.0% in Q3.
The results in Q2 and Q3 2020 were distorted by the pandemic and should be ignored.
 The HVS homeowner vacancy decreased to 0.8% in Q4 from 0.9% in Q3.
 Once again - this probably shows the general trend, but I wouldn't rely on the absolute numbers.
 The rental vacancy rate decreased to 5.8% in Q4 from 6.0% in Q3.
 The HVS also has a series on asking rents. This surged following the early stages of the pandemic - like other measures - and is up 9.5% year-over-year in Q4 2022. This was down 0.9% in Q4 compared to Q3.
The quarterly HVS is the timeliest survey on households, but there are many questions about the accuracy of this survey.
Comments on November Case-Shiller and FHFA House Prices
by Calculated Risk on 1/31/2023 11:22:00 AM
Today, in the Calculated Risk Real Estate Newsletter: Case-Shiller: National House Price Index "Continued to Decline" to 7.7% year-over-year increase in November
Excerpt:
Both the Case-Shiller House Price Index (HPI) and the Federal Housing Finance Agency (FHFA) HPI for November were released today. Here is a graph of the month-over-month (MoM) change in the Case-Shiller National Index Seasonally Adjusted (SA).
The Case-Shiller Home Price Indices for “November” is a 3-month average of September, October and November closing prices. September closing prices include some contracts signed in July, so there is a significant lag to this data.
The MoM decrease in the Case-Shiller National Index was at -0.26% seasonally adjusted. This was the fifth consecutive MoM decrease, and a slightly larger decrease than in October.
On a seasonally adjusted basis, prices declined in 19 of the 20 Case-Shiller cities on a month-to-month basis (Detroit increased 0.1%). The largest monthly declines seasonally adjusted were in San Francisco (-1.4%), Phoenix (-1.4%) and Las Vegas (-1.2%). San Francisco has fallen 11.9% from the peak in May 2022 and is the first Case-Shiller city with a year-over-year decline (-1.6% year-over-year).
...
The November report was mostly for contracts signed in the July through October period - and was likely impacted slightly by the surge in rates in October.
The impact from higher rates in October and November will really show up in the Case-Shiller index over the next several months.

There is much more in the article. You can subscribe at https://calculatedrisk.substack.com/
Case-Shiller: National House Price Index "Continued to Decline" to 7.7% year-over-year increase in November
by Calculated Risk on 1/31/2023 09:09:00 AM
S&P/Case-Shiller released the monthly Home Price Indices for November ("November" is a 3-month average of September, October and November closing prices).
This release includes prices for 20 individual cities, two composite indices (for 10 cities and 20 cities) and the monthly National index.
From S&P: S&P Corelogic Case-Shiller Index Continued to Decline in November
The S&P CoreLogic Case-Shiller U.S. National Home Price NSA Index, covering all nine U.S. census divisions, reported a [7.7%] annual gain in November, down from [9.3%] in the previous month. The 10- City Composite annual increase came in at [6.3%], down from [8.0%] in the previous month. The 20-City Composite posted a [6.8%] year-over-year gain, down from [8.7%] in the previous month.
[Case-Shiller had an error in their text - corrected in brackets]
Miami, Tampa, and Atlanta reported the highest year-over-year gains among the 20 cities in November. Miami led the way with a 18.4% year-over-year price increase, followed by Tampa in second with a 16.9% increase, and Atlanta in third with a 12.7% increase. All 20 cities reported lower price increases in the year ending November 2022 versus the year ending October 2022.
...
Before seasonal adjustment, the U.S. National Index posted a -0.6% month-over-month decrease in November, while the 10-City and 20-City Composites posted decreases of -0.7% and -0.8%, respectively.
After seasonal adjustment, the U.S. National Index posted a month-over-month decrease of -0.3%, and the 10-City and 20-City Composites both posted decreases of -0.5%.
In November, all 20 cities reported declines before seasonal adjustments. After seasonal adjustments, 19 cities reported declines, with only Detroit increasing 0.1%.
“November 2022 marked the fifth consecutive month of declining home prices in the U.S.,” says Craig J. Lazzara, Managing Director at S&P DJI. “For example, the National Composite Index fell -0.6% for the month, reflecting a -3.6% decline since the market peaked in June 2022. We saw comparable patterns in our 10- and 20-City Composites, both of which stand more than -5.0% below their June peaks. These declines, of course, came after very strong price increases in late 2021 and the first half of 2022. Despite its recent weakness, on a year-over-year basis the National Composite gained 7.7%, which is in the 74th percentile of historical performance levels.
“All 20 cities in our November report showed price declines on a month-over-month basis, with a median decline of -0.8%. Moreover, for all 20 cities, year-over-year gains in November were lower than those of October, with a median year-over-year increase of 6.4%. Interestingly, home prices in San Francisco were down by -1.6% year-over-year, the first negative result for any city since San Francisco’s -0.4% decline in October 2019. This is the worst year-over-year result for San Francisco in more than 10 years (since a -3.0% result in March 2012). West coast weakness was not limited to California, as San Francisco was followed by Seattle (+1.5%) and Portland (+3.9%) at the bottom of the league table.
emphasis added
 Click on graph for larger image.
 The first graph shows the nominal seasonally adjusted Composite 10, Composite 20 and National indices (the Composite 20 was started in January 2000).
The Composite 10 index is down 0.5% in November (SA) and down 4.1% from the recent peak in June 2022.
The Composite 20 index is down 0.5% (SA) in November and down 4.1% from the recent peak in June 2022.
The National index is down 0.3% (SA) in November and is down 2.5% from the peak in June 2022.
 The second graph shows the year-over-year change in all three indices.
The Composite 10 SA is up 6.3% year-over-year. The Composite 20 SA is up 6.8% year-over-year.
The National index SA is up 7.7% year-over-year.
Annual price increases were close to expectations. I'll have more later.
Monday, January 30, 2023
Tuesday: Case-Shiller House Prices
by Calculated Risk on 1/30/2023 08:47:00 PM
 From Matthew Graham at Mortgage News Daily: Busy Week With Big Ticket Data And The Fed
Unlike last week, the present example offers multiple scheduled economic reports that have consistent track records of causing market movement. Key examples include both ISM reports, ECI, JOLTS, and of course the jobs report on Friday. The Fed announcement lies smack dab in the middle on Wednesday afternoon where it is all but guaranteed that we'll see another downshift in the pace of rate hikes (25bps). [30 year fixed 6.21%]Tuesday:
emphasis added
• At 9:00 AM ET, FHFA House Price Index for November. This was originally a GSE only repeat sales, however there is also an expanded index.
• Also at 9:00 AM, S&P/Case-Shiller House Price Index for November. The consensus is for a 6.9% year-over-year increase in the Comp 20 index.
• At 9:45 AM, Chicago Purchasing Managers Index for January. The consensus is for a reading of 44.9, down from 45.1 in December.
• At 10:00 AM, The Q4 Housing Vacancies and Homeownership report from the Census Bureau.
Fannie Mae: Mortgage Serious Delinquency Rate Increased Slightly in December
by Calculated Risk on 1/30/2023 02:13:00 PM
Fannie Mae reported that the Single-Family Serious Delinquency increased to 0.65% in December from 0.64% in November. The serious delinquency rate is down from 1.25% in December 2021. This is at the pre-pandemic lows.
These are mortgage loans that are "three monthly payments or more past due or in foreclosure".
The Fannie Mae serious delinquency rate peaked in February 2010 at 5.59% following the housing bubble and peaked at 3.32% in August 2020 during the pandemic.
 Click on graph for larger image
By vintage, for loans made in 2004 or earlier (1% of portfolio), 2.16% are seriously delinquent (down from 2.15% in November).
For loans made in 2005 through 2008 (1% of portfolio), 3.49% are seriously delinquent (unchanged from 3.49%),
For recent loans, originated in 2009 through 2021 (98% of portfolio), 0.53% are seriously delinquent (up from 0.52%). So, Fannie is still working through a handful of poor performing loans from the bubble years.
Mortgages in forbearance were counted as delinquent in this monthly report, but they were not reported to the credit bureaus.
Freddie Mac reported earlier.
Mortgages in forbearance were counted as delinquent in this monthly report, but they were not reported to the credit bureaus.
Freddie Mac reported earlier.
Lawler: D.R. Horton (DHI) Net Order Price Declined "Roughly" 10% from Peak
by Calculated Risk on 1/30/2023 10:04:00 AM
Today, in the Calculated Risk Real Estate Newsletter: Lawler: D.R. Horton (DHI) Net Order Price Declined "Roughly" 10% from Peak
Brief excerpt:
From housing economist Tom Lawler:You can subscribe at https://calculatedrisk.substack.com/.
DHI’s average net order price last quarter was actually DOWN 4.1% from the comparable quarter of 2021, and was down 7.9% from the previous quarter. While some of this decline may have been related to the mix of sales, it’s worth noting that the average net order price was down YOY in all but one of the regions DHI reports on (the “East” saw no change, while the Southwest saw a 10% drop). In addition, the company on the conference call seemed to suggest that most of the recent price declines have reflected decreased prices and/or increased concessions (see below).

Housing January 30th Weekly Update: Inventory Decreased 1.4% Week-over-week
by Calculated Risk on 1/30/2023 08:41:00 AM
Altos reports inventory was down 1.4% week-over-week. Usually inventory bottoms in February; in 2022, inventory bottomed in early March.
Here are the same week inventory changes for the last five years:
2023: -6.5K
2022: -5.3K
2021: -8.3K
2020: -3.7K
2019: +2.7K
 Click on graph for larger image.
This inventory graph is courtesy of Altos Research.
As of January 27th, inventory was at 466 thousand (7-day average), compared to 472 thousand the prior week.

The red line is for 2023. The black line is for 2019. Note that inventory is up from the previous two years (the record low was in 2022), but still well below normal levels.
Inventory was up 71.5% compared to the same week in 2022, and down 43.7% compared to the same week in 2019.
A key will be when inventory starts increasing in 2023 - so far inventory has declined slightly over the first four weeks of 2023.
Mike Simonsen discusses this data regularly on Youtube.
Sunday, January 29, 2023
Sunday Night Futures
by Calculated Risk on 1/29/2023 06:31:00 PM
Weekend:
• Schedule for Week of January 29, 2023
Monday:
• At 10:30 AM ET, Dallas Fed Survey of Manufacturing Activity for January. This is the last of the regional Fed manufacturing surveys for January.
From CNBC: Pre-Market Data and Bloomberg futures S&P 500 futures are down 5 and DOW futures are down 46 (fair value).
Oil prices were down over the last week with WTI futures at $79.68 per barrel and Brent at $86.66 per barrel. A year ago, WTI was at $88, and Brent was at $92 - so WTI oil prices are DOWN 10% year-over-year.
Here is a graph from Gasbuddy.com for nationwide gasoline prices. Nationally prices are at $3.50 per gallon. A year ago, prices were at $3.31 per gallon, so gasoline prices are up $0.19 per gallon year-over-year.
FOMC Preview: 25bp Hike
by Calculated Risk on 1/29/2023 08:11:00 AM
Expectations are the FOMC will announce a 25bp rate increase in the federal funds rate and analysts will be looking for any mention of a possible pause in rate hikes at the March FOMC meeting.
From Merrill Lynch:
1 Projections of change in real GDP and inflation are from the fourth quarter of the previous year to the fourth quarter of the year indicated.
The unemployment rate was at 3.5% in December. This put the Q4 rate at 3.6%, slightly lower than the FOMC projection.
2 Projections for the unemployment rate are for the average civilian unemployment rate in the fourth quarter of the year indicated.
As of December 2022, PCE inflation was up 5.0% from December 2021. On a Q4-over-Q4 basis PCE inflation was up 5.5% in Q4 2022. This was below the FOMC projection.
PCE core inflation was up 4.4% in December year-over-year. On a Q4-over-Q4 basis core PCE inflation was up 4.7% in Q4 2022. This was at the bottom of the FOMC projection range.
"At the February FOMC meeting, we look for the Fed to raise the target range for the federal funds rate by 25bp to 4.50-4.75%. ... incoming data that points to a broadening of the slowdown and further signs of decelerating price pressures appear to have tipped the balance within the FOMC toward another downshift in the pace of rate hikes next week."
...
We expect Chair Powell to continue to emphasize that a slower pace of rate hikes does not signal the Fed’s job is over. ... the decision may be for a smaller 25bp hike, but the Fed will want to avoid the interpretation that this implies a lower terminal rate or an earlier onset of rate cuts than the committee viewed as appropriate when it last met in December. That means no change in policy rate guidance in the FOMC statement. We think the statement will continue to say that “ongoing increases in the target range [for the federal funds rate] will be appropriate.” A softening in this language could lead to an undesired easing in financial conditions."
emphasis added
No projections will be released at this meeting. For review, here are the December projections. Since the last meeting, the economy has performed better than the FOMC expected, and inflation was lower than expected.
The BEA reported real GDP increased at a 2.9% annual rate in Q4 and was up 1.0% on a Q4-over-Q4 basis. This was above the December projections for 2022.
| GDP projections of Federal Reserve Governors and Reserve Bank presidents, Change in Real GDP1 | ||||
|---|---|---|---|---|
| Projection Date | 2022 | 2023 | 2024 | 2025 |
| Dec 2022 | 0.4 to 0.5 | 0.4 to 1.0 | 1.3 to 2.0 | 1.6 to 2.0 |
The unemployment rate was at 3.5% in December. This put the Q4 rate at 3.6%, slightly lower than the FOMC projection.
| Unemployment projections of Federal Reserve Governors and Reserve Bank presidents, Unemployment Rate2 | ||||
|---|---|---|---|---|
| Projection Date | 2022 | 2023 | 2024 | 2025 |
| Dec 2022 | 3.7 | 4.4 to 4.7 | 4.3 to 4.8 | 4.0 to 4.7 |
As of December 2022, PCE inflation was up 5.0% from December 2021. On a Q4-over-Q4 basis PCE inflation was up 5.5% in Q4 2022. This was below the FOMC projection.
| Inflation projections of Federal Reserve Governors and Reserve Bank presidents, PCE Inflation1 | ||||
|---|---|---|---|---|
| Projection Date | 2022 | 2023 | 2024 | 2025 |
| Dec 2022 | 5.6 to 5.8 | 2.9 to 3.5 | 2.3 to 2.7 | 2.0 to 2.2 |
PCE core inflation was up 4.4% in December year-over-year. On a Q4-over-Q4 basis core PCE inflation was up 4.7% in Q4 2022. This was at the bottom of the FOMC projection range.
| Core Inflation projections of Federal Reserve Governors and Reserve Bank presidents, Core Inflation1 | ||||
|---|---|---|---|---|
| Projection Date | 2022 | 2023 | 2024 | 2025 |
| Dec 2022 | 4.7 to 4.8 | 3.2 to 3.7 | 2.3 to 2.7 | 2.0 to 2.2 |
Saturday, January 28, 2023
Real Estate Newsletter Articles this Week: New Home Sales at 616,000 Annual Rate in December; Previous 3 Months Revised Down Sharply
by Calculated Risk on 1/28/2023 02:11:00 PM
At the Calculated Risk Real Estate Newsletter this week:
• New Home Sales at 616,000 Annual Rate in December; Previous 3 Months Revised Down Sharply
• Final Look at Local Housing Markets in December
• 1.51 million Total Housing Completions in 2022 including Manufactured Homes; Most Since 2007
• Has Housing "Bottomed"?
This is usually published 4 to 6 times a week and provides more in-depth analysis of the housing market.
You can subscribe at https://calculatedrisk.substack.com/
Most content is available for free (and no Ads), but please subscribe!
Schedule for Week of January 29, 2023
by Calculated Risk on 1/28/2023 10:11:00 AM
The key reports scheduled for this week are the January employment report and November Case-Shiller house prices.
Other key indicators include January ISM manufacturing and services surveys, and January vehicle sales.
The FOMC meets this week, and the FOMC is expected to announce a 25 bp hike in the Fed Funds rate.
10:30 AM: Dallas Fed Survey of Manufacturing Activity for January. This is the last of the regional Fed manufacturing surveys for January.
9:00 AM: FHFA House Price Index for November. This was originally a GSE only repeat sales, however there is also an expanded index.
 9:00 AM ET: S&P/Case-Shiller House Price Index for November.
This graph shows the Year over year change in the nominal seasonally adjusted National Index, Composite 10 and Composite 20 indexes through the most recent report (the Composite 20 was started in January 2000).
The consensus is for a 6.9% year-over-year increase in the Comp 20 index.
9:45 AM: Chicago Purchasing Managers Index for January. The consensus is for a reading of 44.9, down from 45.1 in December.
10:00 AM: The Q4 Housing Vacancies and Homeownership report from the Census Bureau.
7:00 AM ET: The Mortgage Bankers Association (MBA) will release the results for the mortgage purchase applications index.
8:15 AM: The ADP Employment Report for January. This report is for private payrolls only (no government). The consensus is for 170,000 payroll jobs added in January, down from 235,000 added in December.
10:00 AM: Construction Spending for December. The consensus is for a 0.1% decrease in construction spending.
 10:00 AM ET: Job Openings and Labor Turnover Survey for December from the BLS.
 This graph shows job openings (black line), hires (purple), Layoff, Discharges and other (red column), and Quits (light blue column) from the JOLTS.
Job openings decreased in November to 10.458 million from 10.512 million in October
10:00 AM: ISM Manufacturing Index for January. The consensus is for the ISM to be at 48.0, down from 48.4 in December.
2:00 PM: FOMC Meeting Announcement. The FOMC is expected to announce a 25 bp hike in the Fed Funds rate.
2:30 PM: Fed Chair Jerome Powell holds a press briefing following the FOMC announcement.
 All day: Light vehicle sales for January. The consensus is for light vehicle sales to be 14.3 million SAAR in January, up from 13.3 million in December (Seasonally Adjusted Annual Rate).
This graph shows light vehicle sales since the BEA started keeping data in 1967. The dashed line is the December sales rate.
8:30 AM: The initial weekly unemployment claims report will be released. The consensus is for 200 thousand initial claims, up from 186 thousand last week.
 8:30 AM: Employment Report for December. The consensus is for 185,000 jobs added, and for the unemployment rate to increase to 3.6%.
There were 223,000 jobs added in December, and the unemployment rate was at 3.5%.
This graph shows the job losses from the start of the employment recession, in percentage terms.
The pandemic employment recession was by far the worst recession since WWII in percentage terms. However, as of August 2022, the total number of jobs had returned and are now 1.24 million above pre-pandemic levels.
10:00 AM: ISM Services Index for January.
Friday, January 27, 2023
COVID Jan 27, 2023: Update on Cases, Hospitalizations and Deaths
by Calculated Risk on 1/27/2023 09:58:00 PM
On COVID (focus on hospitalizations and deaths). Data is now weekly.
| COVID Metrics | ||||
|---|---|---|---|---|
| Now | Week Ago | Goal | ||
| New Cases per Week2 | 295,140 | 332,606 | ≤35,0001 | |
| Hospitalized2 | 29,411 | 34,723 | ≤3,0001 | |
| Deaths per Week2 | 3,756 | 3,948 | ≤3501 | |
| 1my goals to stop weekly posts, 2Weekly for Cases, Currently Hospitalized, and Deaths 🚩 Increasing number weekly for Cases, Hospitalized, and Deaths ✅ Goal met. | ||||
 Click on graph for larger image.
This graph shows the weekly (columns) number of deaths reported.
January was the worst month for the previous two years, and this January has seen a much smaller increase in deaths.
Hotels: Occupancy Rate Down 6.2% Compared to Same Week in 2019
by Calculated Risk on 1/27/2023 04:09:00 PM
With the Martin Luther King Jr. holiday, U.S. hotel performance came in slightly lower than the previous week, according to STR‘s latest data through Jan. 21.The following graph shows the seasonal pattern for the hotel occupancy rate using the four-week average.
Jan. 15-21, 2023 (percentage change from comparable week in 2019*):
• Occupancy: 54.2% (-6.2%)
• Average daily rate (ADR): $140.16 (+11.3%)
• evenue per available room (RevPAR): $75.97 (+4.4%)
*Due to the pandemic impact, STR is measuring recovery against comparable time periods from 2019. Year-over-year comparisons will once again become standard after Q1.
emphasis added
 Click on graph for larger image.
The red line is for 2023, black is 2020, blue is the median, and dashed light blue is for 2022. Dashed purple is 2019 (STR is comparing to a strong year for hotels).
The 4-week average of the occupancy rate is below the median rate for the previous 20 years (Blue), but this is the slow season - and some of the early year weakness might be related to the timing of the report.
Note: Y-axis doesn't start at zero to better show the seasonal change.
The 4-week average of the occupancy rate will increase seasonally over the next few months.
Realtor.com Reports Weekly Active Inventory Up 69% YoY; New Listings Down 5% YoY
by Calculated Risk on 1/27/2023 03:12:00 PM
Realtor.com has monthly and weekly data on the existing home market. Here is their weekly report released today from Chief Economist Danielle Hale: Weekly Housing Trends View — Data Week Ending Jan 21, 2023. Note: They have data on list prices, new listings and more, but this focus is on inventory.
• Active inventory growth continued to climb with for-sale homes up 69% above one year ago. In January, the housing market built further on the impressive growth seen in late 2022. But there is still room for more. Even after surging more than 50% in December 2022, the number of homes on the market trailed pre-pandemic counts by nearly 40%.
...
• New listings–a measure of sellers putting homes up for sale–were again down, this week by 5% from one year ago. This marks the twenty-ninth consecutive week of year-over-year declines in homeowners listing their homes for sale, but this week’s decline was not only smaller than dip, the average decline in new listings so far this year is about half what we saw in the fourth quarter of 2022. As mortgage rates rose and the market shifted from a distinct seller’s market to one that might better be described as a nobody’s market, we saw homeowners retrench, and the number of new listings fell. Although the number of new listings is still declining, at the current pace we could see a reversal of that trend or more new listings than one year ago as soon as February.
 Here is a graph of the year-over-year change in inventory according to realtor.com.
 In early 2022, inventory was declining rapidly, so the year-over-year change is up sharply.
An interesting note this week is that new listings were only down 5% from a year ago. This is a significant change from December when new listings were down 21% year-over-year according to Realtor.com, and down 21.5% in the local markets I track. Something to watch!
Has Housing "Bottomed"?
by Calculated Risk on 1/27/2023 12:18:00 PM
Today, in the Calculated Risk Real Estate Newsletter: Has Housing "Bottomed"?
Brief excerpt:
I’ve heard some positive comments from a number of real estate agents in the last week about the existing home market.You can subscribe at https://calculatedrisk.substack.com/.
...
Activity is still down sharply year-over-year (YoY), but the YoY decline is getting smaller.
And some upbeat comments on new home sales ...
Way back in 2009, I pointed out that there are usually two bottoms for housing.There will probably be two bottoms for Residential Real Estate.The first bottom is for activity, and the second is for prices.
The first will be for new home sales, housing starts and residential investment. The second bottom will be for prices. Sometimes these bottoms can happen years apart.
NAR: Pending Home Sales Increased 2.5% in December, Year-over-year Down 33.8%
by Calculated Risk on 1/27/2023 10:03:00 AM
From the NAR: Pending Home Sales Increased 2.5% in December, Ending Six-Month Slide
Pending home sales increased in December for the first time since May 2022 — following six consecutive months of declines — according to the National Association of Realtors®. The Northeast and Midwest recorded month-over-month reductions, while the South and West posted monthly gains. All four U.S. regions saw year-over-year decreases in transactions, with the West experiencing the largest decline at 37.5%.Expectations had been for a 1.0% decline for this index. Note: Contract signings usually lead sales by about 45 to 60 days, so this would usually be for closed sales in January and February.
The Pending Home Sales Index (PHSI) — a forward-looking indicator of home sales based on contract signings — improved 2.5% to 76.9 in December. Year-over-year, pending transactions dropped by 33.8%. An index of 100 is equal to the level of contract activity in 2001.
“This recent low point in home sales activity is likely over,” said NAR Chief Economist Lawrence Yun. “Mortgage rates are the dominant factor driving home sales, and recent declines in rates are clearly helping to stabilize the market.”
...
The Northeast PHSI dropped 6.5% from last month to 64.7, a decrease of 32.5% from December 2021. The Midwest index shrank 0.3% to 77.6 in December, a decline of 30.1% from one year ago.
The South PHSI rose 6.1% to 94.1 in December, dropping 34.5% from the prior year. The West index advanced 6.4% in December to 58.6, decreasing 37.5% from December 2021.
emphasis added
Personal Income increased 0.2% in December; Spending decreased 0.2%
by Calculated Risk on 1/27/2023 08:41:00 AM
The BEA released the Personal Income and Outlays report for December:
Personal income increased $49.5 billion (0.2 percent) in December, according to estimates released today by the Bureau of Economic Analysis. Disposable personal income (DPI) increased $49.2 billion (0.3 percent) and personal consumption expenditures (PCE) decreased $41.6 billion (0.2 percent).The December PCE price index increased 5.0 percent year-over-year (YoY), down from 5.5 percent YoY in November, and down from the recent peak of 7.0 percent in June 2022.
The PCE price index increased 0.1 percent. Excluding food and energy, the PCE price index increased 0.3 percent. Real DPI increased 0.2 percent in December and Real PCE decreased 0.3 percent; goods decreased 0.9 percent and services were unchanged.
emphasis added
The PCE price index, excluding food and energy, increased 4.4 percent YoY, down from 4.7 percent in November, and down from the recent peak of 5.4 percent in February 2022.
The following graph shows real Personal Consumption Expenditures (PCE) through December 2022 (2012 dollars). Note that the y-axis doesn't start at zero to better show the change.
 Click on graph for larger image.
The dashed red lines are the quarterly levels for real PCE.
Personal income was at expectations, and the decrease in PCE was slightly below expectations.
Inflation was close to expectations.
Thursday, January 26, 2023
Friday: Personal Income and Outlays, Pending Home Sales
by Calculated Risk on 1/26/2023 08:49:00 PM
 Note: Mortgage rates are from MortgageNewsDaily.com and are for top tier scenarios.
Friday:
• At 8:30 AM ET, Personal Income and Outlays for December. The consensus is for a 0.2% increase in personal income, and for a 0.1% decrease in personal spending. And for the Core PCE price index to increase 0.3%. PCE prices are expected to be up 5.0% YoY, and core PCE prices up 4.4% YoY.
• At 10:00 AM, Pending Home Sales Index for December. The consensus is for a -1.0% decrease in the index.
• Also at 10:00 AM, University of Michigan's Consumer sentiment index (Final for January). The consensus is for a reading of 64.6.
A Few Comments on Q4 GDP and Investment
by Calculated Risk on 1/26/2023 01:47:00 PM
Note: The first two graphs - Investment Contributions and Residential Investment as a percent of GDP - are useful in predicting Fed induced recessions. RI as a percent of GDP usually turns down well in advance of a recession. This is something I'm watching.
Earlier from the BEA: Gross Domestic Product, Fourth Quarter 2022 (Advance Estimate)
Real gross domestic product (GDP) increased at an annual rate of 2.9 percent in the fourth quarter of 2022, according to the "advance" estimate released by the Bureau of Economic Analysis. In the third quarter, real GDP increased 3.2 percent. ...The advance Q4 GDP report, at 2.9% annualized, was above expectations, partly due to a positive impact from an increase in inventories.
The increase in real GDP reflected increases in private inventory investment, consumer spending, federal government spending, state and local government spending, and nonresidential fixed investment that were partly offset by decreases in residential fixed investment and exports. Imports, which are a subtraction in the calculation of GDP, decreased.
emphasis added
Personal consumption expenditures (PCE) increased at a 2.1% annualized rate in Q4.
The graph below shows the contribution to GDP from residential investment, equipment and software, and nonresidential structures (3 quarter trailing average). This is important to follow because residential investment tends to lead the economy, equipment and software is generally coincident, and nonresidential structure investment trails the economy.
In the graph, red is residential, green is equipment and software, and blue is investment in non-residential structures. So, the usual pattern - both into and out of recessions is - red, green, blue.
Of course - with the sudden economic stop due to COVID-19 - the usual pattern didn't apply.
The dashed gray line is the contribution from the change in private inventories.
 Click on graph for larger image.
Residential investment (RI) decreased at a 26.7% annual rate in Q4. Equipment investment decreased at a 3.7% annual rate, and investment in non-residential structures increased at a 0.4% annual rate.
The contribution to Q4 GDP from investment in private inventories was 1.46 percentage points.
On a 3-quarter trailing average basis, RI (red) is down, equipment (green) is up, and nonresidential structures (blue) is still down.
On a 3-quarter trailing average basis, RI (red) is down, equipment (green) is up, and nonresidential structures (blue) is still down.
I'll post more on the components of non-residential investment once the supplemental data is released.
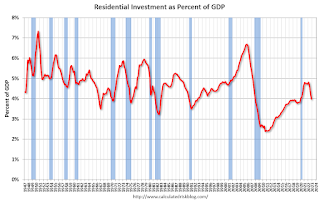 The second graph shows residential investment as a percent of GDP.
Residential Investment as a percent of GDP decreased in Q4.
I'll break down Residential Investment into components after the GDP details are released.
Note: Residential investment (RI) includes new single-family structures, multifamily structures, home improvement, broker's commissions, and a few minor categories.
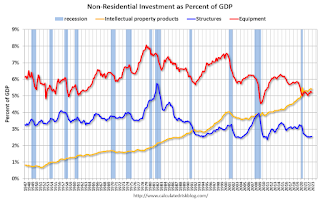 The third graph shows non-residential investment in
structures, equipment and "intellectual property products".
The third graph shows non-residential investment in
structures, equipment and "intellectual property products".
Investment in non-residential structures increased slightly in Q4 as a percent GDP.
New Home Sales at 616,000 Annual Rate in December; Previous 3 Months Revised Down Sharply
by Calculated Risk on 1/26/2023 10:47:00 AM
Today, in the Calculated Risk Real Estate Newsletter: New Home Sales at 616,000 Annual Rate in December; Previous 3 Months Revised Down Sharply
Brief excerpt:
The next graph shows the months of supply by stage of construction. “Months of supply” is inventory at each stage, divided by the sales rate.You can subscribe at https://calculatedrisk.substack.com/.
There are 1.4 months of completed supply (red line). This is close to the normal level.
The inventory of new homes under construction is at 5.7 months (blue line). This elevated level of homes under construction is due to supply chain constraints.
And about 1.9 months of potential inventory have not been started (grey line) - about double the normal level. Homebuilders are probably waiting to start some homes until they have a firmer grasp on prices and demand.
...
As previously discussed, the Census Bureau overestimates sales, and underestimates inventory when cancellation rates are rising, see: New Home Sales and Cancellations: Net vs Gross Sales. So, take the headline sales number with a large grain of salt - the actual negative impact on the homebuilders is far greater than the headline number suggests!
This will reverse when cancellation rates start declining. When a previously cancelled home is resold, the home builder counts it as a sale, but the Census Bureau does not (since it was already counted).
There are a large number of homes under construction, and this suggests we will see a further sharp increase in completed inventory over the next several months - and that will keep pressure on new home prices.

New Home Sales at 616,000 Annual Rate in December; Annual Sales down 16.4% in 2022
by Calculated Risk on 1/26/2023 10:09:00 AM
The Census Bureau reports New Home Sales in December were at a seasonally adjusted annual rate (SAAR) of 616 thousand.
The previous three months were revised down sharply.
Sales of new single‐family houses in December 2022 were at a seasonally adjusted annual rate of 616,000, according to estimates released jointly today by the U.S. Census Bureau and the Department of Housing and Urban Development. This is 2.3 percent above the revised November rate of 602,000, but is 26.6 percent below the December 2021 estimate of 839,000.
An estimated 644,000 new homes were sold in 2022. This is 16.4 percent below the 2021 figure of 771,000.
emphasis added
 Click on graph for larger image.
The first graph shows New Home Sales vs. recessions since 1963. The dashed line is the current sales rate.
New home sales are below pre-pandemic levels.
The second graph shows New Home Months of Supply.
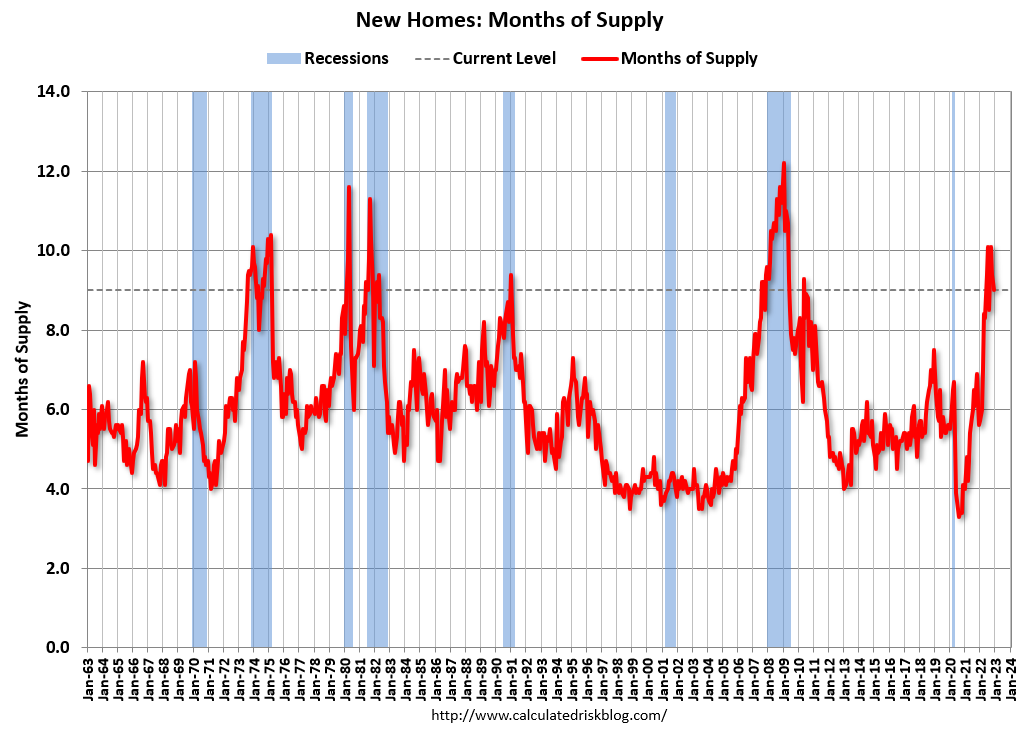 The months of supply decreased in December to 9.0 months from 9.2 months in November.
 The all-time record high was 12.1 months of supply in January 2009. The all-time record low was 3.5 months, most recently in October 2020.
This is well above the top of the normal range (about 4 to 6 months of supply is normal).
"The seasonally‐adjusted estimate of new houses for sale at the end of December was 461,000. This represents a supply of 9.0 months at the current sales rate."
 The last graph shows sales NSA (monthly sales, not seasonally adjusted annual rate).
In December 2022 (red column), 47 thousand new homes were sold (NSA). Last year, 61 thousand homes were sold in November.
The all-time high for December was 87 thousand in 2005, and the all-time low for December was 23 thousand in 2010.
This was at expectations of 614 thousand SAAR, however sales in the three previous months were revised down sharply. I'll have more later today.
Weekly Initial Unemployment Claims decrease to 186,000
by Calculated Risk on 1/26/2023 08:37:00 AM
The DOL reported:
In the week ending January 21, the advance figure for seasonally adjusted initial claims was 186,000, a decrease of 6,000 from the previous week's revised level. The previous week's level was revised up by 2,000 from 190,000 to 192,000. The 4-week moving average was 197,500, a decrease of 9,250 from the previous week's revised average. The previous week's average was revised up by 750 from 206,000 to 206,750.The following graph shows the 4-week moving average of weekly claims since 1971.
emphasis added
 Click on graph for larger image.
The dashed line on the graph is the current 4-week average. The four-week average of weekly unemployment claims decreased to 197,500.
The previous week was revised up.
Weekly claims were below the consensus forecast.
BEA: Real GDP increased at 2.9% Annualized Rate in Q4
by Calculated Risk on 1/26/2023 08:32:00 AM
From the BEA: Gross Domestic Product, Fourth Quarter 2022 (Advance Estimate)
Real gross domestic product (GDP) increased at an annual rate of 2.9 percent in the fourth quarter of 2022, according to the "advance" estimate released by the Bureau of Economic Analysis. In the third quarter, real GDP increased 3.2 percent. ...PCE increased at a 2.1% rate, and residential investment decreased at a 26.7% rate. The advance Q4 GDP report, with 2.9% annualized increase, was above expectations.
The increase in real GDP reflected increases in private inventory investment, consumer spending, federal government spending, state and local government spending, and nonresidential fixed investment that were partly offset by decreases in residential fixed investment and exports. Imports, which are a subtraction in the calculation of GDP, decreased.
The increase in private inventory investment was led by manufacturing (mainly petroleum and coal products as well as chemicals) as well as mining, utilities, and construction industries (led by utilities). The increase in consumer spending reflected increases in both services and goods. Within services, the increase was led by health care, housing and utilities, and "other" services (notably, personal care services). Within goods, the leading contributor was motor vehicles and parts. Within federal government spending, the increase was led by nondefense spending. The increase in state and local government spending primarily reflected an increase in compensation of state and local government employees. Within nonresidential fixed investment, an increase in intellectual property products was partly offset by a decrease in equipment.
Within residential fixed investment, the leading contributors to the decrease were new single-family construction as well as brokers' commissions. Within exports, a decrease in goods (led by nondurable goods excluding petroleum) was partly offset by an increase in services (led by travel as well as transport). Within imports, the decrease primarily reflected a decrease in goods (led by durable consumer goods).
Compared to the third quarter, the deceleration in real GDP in the fourth quarter primarily reflected a downturn in exports and decelerations in nonresidential fixed investment, state and local government spending, and consumer spending. These movements were partly offset by an upturn in private inventory investment, an acceleration in federal government spending, and a smaller decrease in residential fixed investment. Imports decreased less in the fourth quarter than in the third quarter.
emphasis added
I'll have more later ...
Wednesday, January 25, 2023
Thursday: GDP, New Home Sales, Durable Goods, Unemployment Claims
by Calculated Risk on 1/25/2023 09:00:00 PM
 Note: Mortgage rates are from MortgageNewsDaily.com and are for top tier scenarios.
Thursday:
• At 8:30 AM ET, Gross Domestic Product, 4th quarter and Year 2022 (Advance estimate). The consensus is that real GDP increased 2.6% annualized in Q4.
• Also at 8:30 AM, The initial weekly unemployment claims report will be released. The consensus is for 205 thousand initial claims, up from 190 thousand last week.
• Also at 8:30 AM, Durable Goods Orders for December. The consensus is for a 2.6% increase in durable goods.
• Also at 8:30 AM, Chicago Fed National Activity Index for December. This is a composite index of other data.
• At 10:00 AM, New Home Sales for December from the Census Bureau. The consensus is for 614 thousand SAAR, down from 640 thousand in November.
• At 11:00 AM, the Kansas City Fed manufacturing survey for January.
Freddie Mac: Mortgage Serious Delinquency Rate unchanged in December
by Calculated Risk on 1/25/2023 04:52:00 PM
Freddie Mac reported that the Single-Family serious delinquency rate in December was 0.66%, unchanged from 0.66% November. Freddie's rate is down year-over-year from 1.12% in December 2021.
Freddie's serious delinquency rate peaked in February 2010 at 4.20% following the housing bubble and peaked at 3.17% in August 2020 during the pandemic.
These are mortgage loans that are "three monthly payments or more past due or in foreclosure".
 Click on graph for larger image
Mortgages in forbearance are being counted as delinquent in this monthly report but are not reported to the credit bureaus.
The serious delinquency rate was at 0.60% just prior to the pandemic; this is almost back to that level.
Note that multi-family delinquencies have been increasing and were at 0.12% in December, up from 0.08% in December 2021.
Vehicle Sales Forecast: Vehicle Sales to Increase in January
by Calculated Risk on 1/25/2023 02:48:00 PM
From WardsAuto: U.S. Light-Vehicle Sales to Rise 5th Straight Month in January; Q1 Forecast for 4% Gain (pay content). Brief excerpt:
The bottom line is raw volume is growing, albeit slowly, with a forecast year-over-year gain in January, as well as the entire first quarter. Because of the chaos of the past three years, January’s upward spike to a 15.6 million-unit seasonally adjusted annual rate from December’s 13.4 million is more a result of disruption to typical year-end seasonal trends than a sudden surge in demand.
emphasis added
 Click on graph for larger image.
This graph shows actual sales from the BEA (Blue), and Wards forecast for January (Red).
The Wards forecast of 15.6 million SAAR, would be up 17% from last month, and up 3% from a year ago.
Vehicle sales are usually a transmission mechanism for Federal Open Market Committee (FOMC) policy, far behind housing. This time vehicle sales have been more suppressed by supply chain issues, but sales are probably now also being impacted by higher interest rates.
Black Knight: Mortgage Delinquency Rate Increased in December; Prepayments at Record Low
by Calculated Risk on 1/25/2023 12:20:00 PM
From Black Knight: Black Knight’s First Look: Mortgage Delinquencies Closed 2022 Down 9% for the Year, While Prepayments Hit Third Consecutive Record Low
• The national delinquency rate inched up 7 basis points in the month to 3.08%, but finished the year 30 basis points (-9%) below its December 2021 levelAccording to Black Knight's First Look report, the percent of loans delinquent increased 2.3% in December compared to November and decreased 9% year-over-year.
• Prepayment activity fell to 0.39% – with single month mortality (SMM) hitting its third consecutive record low dating back to 2000 when Black Knight began reporting the metric
• Serious delinquencies (90+ days past due) continued to improve nationally despite an 8.7K rise in Florida in the wake of Hurricane Ian, with 44 other states seeing seriously past-due volumes decline in the month
• Borrowers 30 days late increased by 40K, up 4.8%, while 60-day delinquencies stayed flat
• Foreclosure starts increased by 15% in the month to 26,900 – the third consecutive increase, but still 30% below pre-pandemic levels
• Foreclosure was started on 4.9% of serious delinquencies in December, up from November, but still 46% below the start rate seen in December 2019 prior to the pandemic
• Active foreclosure inventory rose by 2.3% in the month, though volumes remained subdued throughout 2022 after the record lows of 2021 due to widespread moratoriums and forbearance protections
emphasis added
Black Knight reported the U.S. mortgage delinquency rate (loans 30 or more days past due, but not in foreclosure) was 3.08% in December, up from 3.01% in November.
The percent of loans in the foreclosure process increased slightly in December to 0.37%, from 0.37% in November.
The number of delinquent properties, but not in foreclosure, is down 146,000 properties year-over-year, and the number of properties in the foreclosure process is up 70,000 properties year-over-year.
| Black Knight: Percent Loans Delinquent and in Foreclosure Process | ||||
|---|---|---|---|---|
| Dec 2022 | Nov 2022 | Dec 2021 | Dec 2020 | |
| Delinquent | 3.08% | 3.01% | 3.38% | 6.08% |
| In Foreclosure | 0.37% | 0.37% | 0.24% | 0.33% |
| Number of properties: | ||||
| Number of properties that are delinquent, but not in foreclosure: | 1,653,000 | 1,612,000 | 1,799,000 | 3,251,000 |
| Number of properties in foreclosure pre-sale inventory: | 198,000 | 196,000 | 128,000 | 178,000 |
| Total Properties | 1,850,000 | 1,808,000 | 1,927,000 | 3,429,000 |
AIA: Architecture Billings "Continue to Decline" in December
by Calculated Risk on 1/25/2023 10:06:00 AM
Note: This index is a leading indicator primarily for new Commercial Real Estate (CRE) investment.
From the AIA: Architecture billings continue to decline
Demand for design services from U.S. architecture firms continued to contract in December, according to a new report from the American Institute of Architects (AIA).
The pace of decline during December slowed from November, posting an Architecture Billings Index (ABI) score of 47.5 from 46.6 (any score below 50 indicates a decline in firm billings). Inquiries into new projects posted a positive score of 52.3, however new design contracts remained in negative territory with a score of 49.4.
“Despite strong revenue growth last year, architecture firms have modest expectations regarding business conditions this coming year,” said AIA Chief Economist Kermit Baker, PhD, Hon. AIA. “With ABI scores for the entire fourth quarter of 2022 in negative territory, a slowdown in construction activity is expected later this year, though the depth of the downturn remains unclear.”
...
• Regional averages: Midwest (49.4); South (48.6); Northeast (46.5); West (45.5)
• Sector index breakdown: mixed practice (54.8); institutional (47.3); commercial/industrial (45.2); multi-family residential (44.3)
emphasis added
 Click on graph for larger image.
This graph shows the Architecture Billings Index since 1996. The index was at 47.5 in December, up from 46.6 in November. Anything below 50 indicates contraction in demand for architects' services.
Note: This includes commercial and industrial facilities like hotels and office buildings, multi-family residential, as well as schools, hospitals and other institutions.
This index had been positive for 20 consecutive months but indicated a decline the last three months. This index usually leads CRE investment by 9 to 12 months, so this index suggests a pickup in CRE investment in early 2023, but a slowdown in CRE investment later in 2023.
Note that multi-family billing turned down in September and has been negative for four consecutive months and is at the lowest level since May 2020. This suggests we will see a downturn in multi-family starts sometime in 2023 (multi-family starts probably have already peaked).
MBA: Mortgage Applications Increase in Latest Weekly Survey
by Calculated Risk on 1/25/2023 07:00:00 AM
From the MBA: Mortgage Applications Increase in Latest MBA Weekly Survey
Mortgage applications increased 7.0 percent from one week earlier, according to data from the Mortgage Bankers Association’s (MBA) Weekly Mortgage Applications Survey for the week ending January 20, 2023. This week’s results include an adjustment for the observance of Martin Luther King, Jr. Day.
... The Refinance Index increased 15 percent from the previous week and was 77 percent lower than the same week one year ago. The seasonally adjusted Purchase Index increased 3 percent from one week earlier. The unadjusted Purchase Index decreased 1 percent compared with the previous week and was 39 percent lower than the same week one year ago.
“Mortgage rates declined for the third straight week, which is good news for potential homebuyers looking ahead to the spring homebuying season. Mortgage rates on most loan types decreased last week and the 30-year fixed rate reached its lowest level since September 2022 at 6.2 percent,” said Joel Kan, MBA’s Vice President and Deputy Chief Economist. “Overall applications increased with both gains in purchase and refinance activity, but purchase applications remained almost 39 percent lower than a year ago. Homebuying activity remains tepid, but if rates continue to fall and home prices cool further, we expect to see potential buyers come back into the market. Many have been waiting for affordability challenges to subside.”
Added Kan, “Despite a 15 percent increase in refinances, they were still 77 percent behind last year’s pace, as rates remained more than two percentage points higher, thus providing very little refinance incentive for most borrowers who are locked into lower rates.”
...
The average contract interest rate for 30-year fixed-rate mortgages with conforming loan balances ($726,200 or less) decreased to 6.20 percent from 6.23 percent, with points increasing to 0.69 from 0.67 (including the origination fee) for 80 percent loan-to-value ratio (LTV) loans.
emphasis added
 Click on graph for larger image.
The first graph shows the refinance index since 1990.
With higher mortgage rates, the refinance index declined sharply in 2022.
Three weeks ago, the refinance index was at the lowest level since the year 2000, but it has rebounded a little as rates declined.
The second graph shows the MBA mortgage purchase index.
 According to the MBA, purchase activity is down 39% year-over-year unadjusted.
Note: Red is a four-week average (blue is weekly).
Tuesday, January 24, 2023
Wednesday: MBA Mortgage Applications, Architecture Billings
by Calculated Risk on 1/24/2023 08:33:00 PM
 Note: Mortgage rates are from MortgageNewsDaily.com and are for top tier scenarios.
Wednesday:
• At 7:00 AM ET, The Mortgage Bankers Association (MBA) will release the results for the mortgage purchase applications index.
• During the day, The AIA's Architecture Billings Index for December (a leading indicator for commercial real estate).
BLS: Alaska and Pennsylvania Set New Record Series Low Unemployment rates in December
by Calculated Risk on 1/24/2023 11:07:00 AM
From the BLS: Regional and State Employment and Unemployment Summary
Unemployment rates were higher in December in 7 states, lower in 5 states, and stable in 38 states and the District of Columbia, the U.S. Bureau of Labor Statistics reported today. Thirty-five states and the District had jobless rate decreases from a year earlier, 4 states had increases, and 11 states had little change.Two states set new series record low unemployment rates in December.
...
Utah had the lowest jobless rate in December, 2.2 percent. The next lowest rates were in North Dakota and South Dakota, 2.3 percent each. The rates in Alaska (4.3 percent) and Pennsylvania (3.9 percent) set new series lows. (All state series begin in 1976.) Nevada had the highest unemployment rate, 5.2 percent.
emphasis added
Final Look at Local Housing Markets in December
by Calculated Risk on 1/24/2023 08:48:00 AM
Today, in the Calculated Risk Real Estate Newsletter: Final Look at Local Housing Markets in December
A brief excerpt:
The big story for December existing home sales was the sharp year-over-year (YoY) decline in sales. Another key story was that new listings were down further YoY in December as many potential sellers are locked into their current home (low mortgage rate). And active inventory increased sharply YoY.There is much more in the article. You can subscribe at https://calculatedrisk.substack.com/
This is the final look at local markets in December. I’m tracking about 40 local housing markets in the US. Some of the 40 markets are states, and some are metropolitan areas. I update these tables throughout each month as additional data is released.
NOTE: Hopefully I’ll be adding more markets next month!
First, here is a table comparing the year-over-year Not Seasonally Adjusted (NSA) declines in sales this year from the National Association of Realtors® (NAR) with the local markets I track. So far, these measures have tracked closely. The NAR reported sales were down 36.3% NSA YoY in December.
...
More local data coming in February for activity in January!
My early expectation is we will see a somewhat smaller YoY sales decline in January, than in December, due to the decrease in mortgage rates in December (January sales are mostly for contracts signed in November and December).

Monday, January 23, 2023
Tuesday: Richmond Fed Mfg
by Calculated Risk on 1/23/2023 09:05:00 PM
 From Matthew Graham at Mortgage News Daily: Mortgage Rates Drift Slightly Higher
After hitting the lowest levels in 4 months at times over the past week, rates have drifted up a bit. There hasn't been much rhyme or reason behind the bounce. ... The week ahead is a bit of a wild card as there are no hotly anticipated events on tap. Some market participants might make a case that the first look at Q4 GDP on Thursday or the PCE inflation on Friday are exceptions to that claim, but they pale in comparison to next week's Fed announcement and Friday's jobs report. [30 year fixed 6.20%]Tuesday:
emphasis added
• At 10:00 AM ET, Richmond Fed Survey of Manufacturing Activity for January.
• Also at 10:00 AM, State Employment and Unemployment (Monthly) for December 2022.
MBA Survey: "Share of Mortgage Loans in Forbearance Remains Flat at 0.70% in December"
by Calculated Risk on 1/23/2023 04:00:00 PM
Note: This is as of December 31st.
From the MBA: Share of Mortgage Loans in Forbearance Remains Flat at 0.70% in December
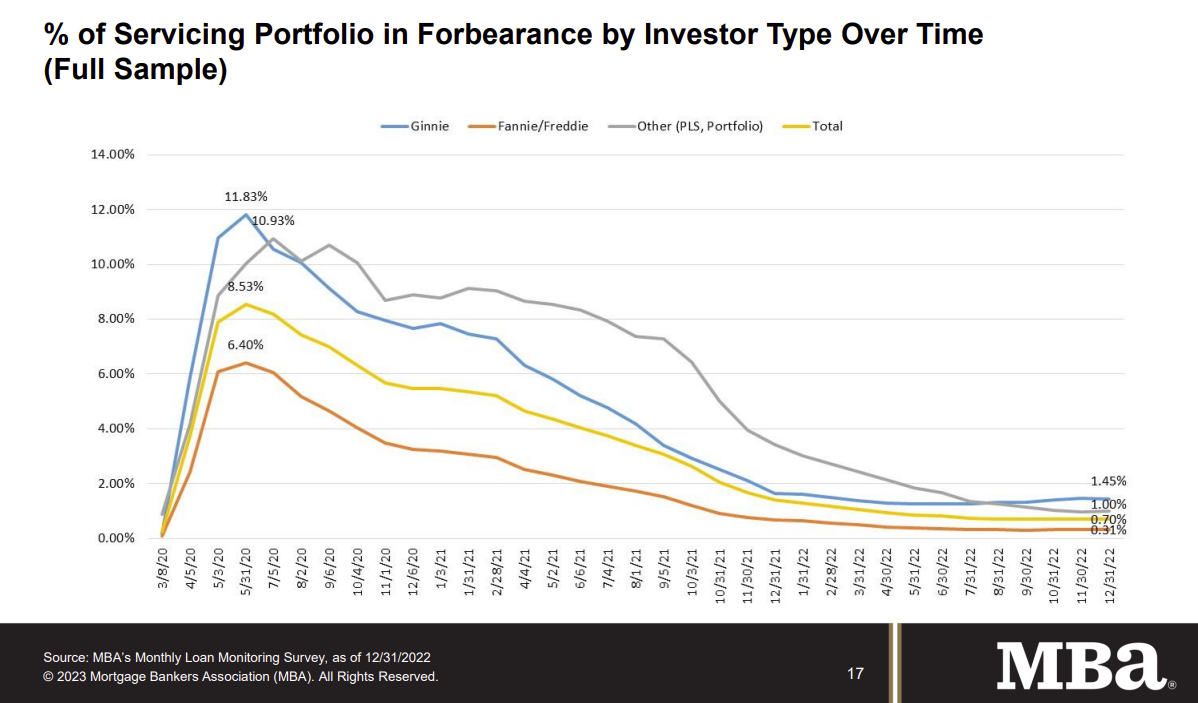
The Mortgage Bankers Association’s (MBA) monthly Loan Monitoring Survey revealed that the total number of loans now in forbearance remained flat relative to the prior month at 0.70% as of December 31, 2022. According to MBA’s estimate, 350,000 homeowners are in forbearance plans.
The share of Fannie Mae and Freddie Mac loans in forbearance decreased 1 basis point to 0.31%. Ginnie Mae loans in forbearance decreased 1 basis point to 1.45%, and the forbearance share for portfolio loans and private-label securities (PLS) increased 3 basis points to 1.00%.
“For three consecutive months, the forbearance rate has remained flat — an indicator that we may have reached a floor on further improvements,” said Marina Walsh, CMB, MBA’s Vice President of Industry Analysis. “New forbearance requests and re-entries continue to trickle in at about the same pace as forbearance exits. The overall performance of servicing portfolios was also flat compared to the previous month, but there was some deterioration in the performance of Ginnie Mae loans.”
Added Walsh, “Forbearance remains an option for struggling homeowners and its usage may continue, especially if unemployment increases as expected. MBA is forecasting for the unemployment rate to reach 5.2 percent in the second half of 2023, up from its current level of 3.5 percent.”
emphasis added
 Click on graph for larger image.
This graph shows the percent of portfolio in forbearance by investor type over time.
The share of forbearance plans had been decreasing, although the percent in forbearance was unchanged in November and December.
At the end of December, there were about 350,000 homeowners in forbearance plans.
LA Port Inbound Traffic Down 20% YoY in December
by Calculated Risk on 1/23/2023 01:18:00 PM
Notes: The expansion to the Panama Canal was completed in 2016 (As I noted several years ago), and some of the traffic that used the ports of Los Angeles and Long Beach is probably going through the canal. This might be impacting TEUs on the West Coast.
Container traffic gives us an idea about the volume of goods being exported and imported - and usually some hints about the trade report since LA area ports handle about 40% of the nation's container port traffic.
The following graphs are for inbound and outbound traffic at the ports of Los Angeles and Long Beach in TEUs (TEUs: 20-foot equivalent units or 20-foot-long cargo container).
To remove the strong seasonal component for inbound traffic, the first graph shows the rolling 12-month average.
 Click on graph for larger image.
On a rolling 12-month basis, inbound traffic decreased 1.6% in December compared to the rolling 12 months ending in November. Outbound traffic increased 1.1% compared to the rolling 12 months ending the previous month.
The 2nd graph is the monthly data (with a strong seasonal pattern for imports).
 Usually imports peak in the July to October period as retailers import goods for the Christmas holiday, and then decline sharply and bottom in February or March depending on the timing of the Chinese New Year.
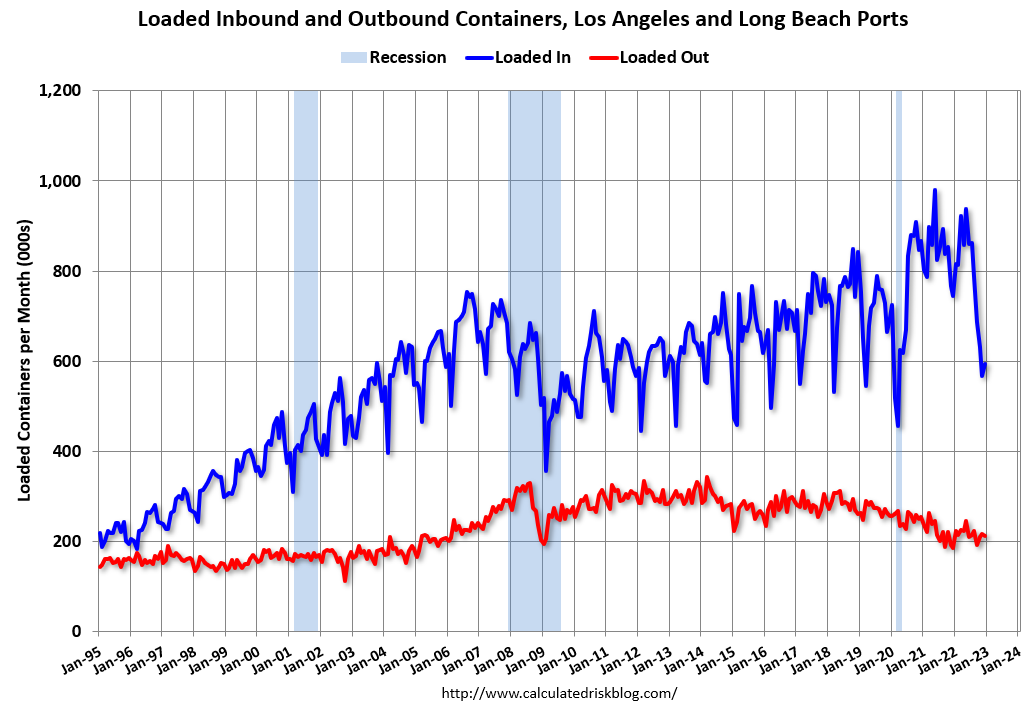 Usually imports peak in the July to October period as retailers import goods for the Christmas holiday, and then decline sharply and bottom in February or March depending on the timing of the Chinese New Year.
Imports were down 20% YoY in December, and exports were up 15% YoY.
It is possible that exports have bottomed after declining for several years (even prior to the pandemic).


