 RSS Feed
 by Calculated Risk on 11/04/2022 09:24:00 AM
Friday, November 04, 2022
Comments on October Employment Report
The headline jobs number in the October employment report was above expectations, and employment for the previous two months was revised up by 29,000, combined. The participation rate decreased, and the unemployment rate increased to 3.7%.
Leisure and hospitality gained 35 thousand jobs in October. At the beginning of the pandemic, in March and April of 2020, leisure and hospitality lost 8.2 million jobs, and are now down 1.1 million jobs since February 2020. So, leisure and hospitality has now added back about 87% all of the jobs lost in March and April 2020.
Construction employment increased 1 thousand and is now 97 thousand above the pre-pandemic level.
Manufacturing added 32 thousand jobs and is now 137 thousand above the pre-pandemic level.
In October, the year-over-year employment change was 5.30 million jobs.
Seasonal Retail Hiring
Typically, retail companies start hiring for the holiday season in October, and really increase hiring in November. Here is a graph that shows the historical net retail jobs added for October, November and December by year.
 This graph really shows the collapse in retail hiring in 2008. Since then, seasonal hiring had increased back close to more normal levels. Note: I expect the long-term trend will be down with more and more internet holiday shopping.
Retailers hired 163 thousand workers Not Seasonally Adjusted (NSA) net in October. This was down from the previous two years and suggests lower increase in real retail sales this holiday season than the previous two years.
This was seasonally adjusted (SA) to a gain of 7 thousand jobs in October.
Prime (25 to 54 Years Old) Participation
 Since the overall participation rate is impacted by both cyclical (recession) and demographic (aging population, younger people staying in school) reasons, here is the employment-population ratio for the key working age group: 25 to 54 years old.
The 25 to 54 participation rate decreased in October to 82.5% from 82.7% in September, and the 25 to 54 employment population ratio decreased to 79.8% from 80.2% the previous month.
Both are close to the pre-pandemic levels and indicate almost all of the prime age workers have returned to the labor force.
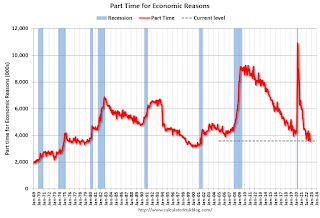
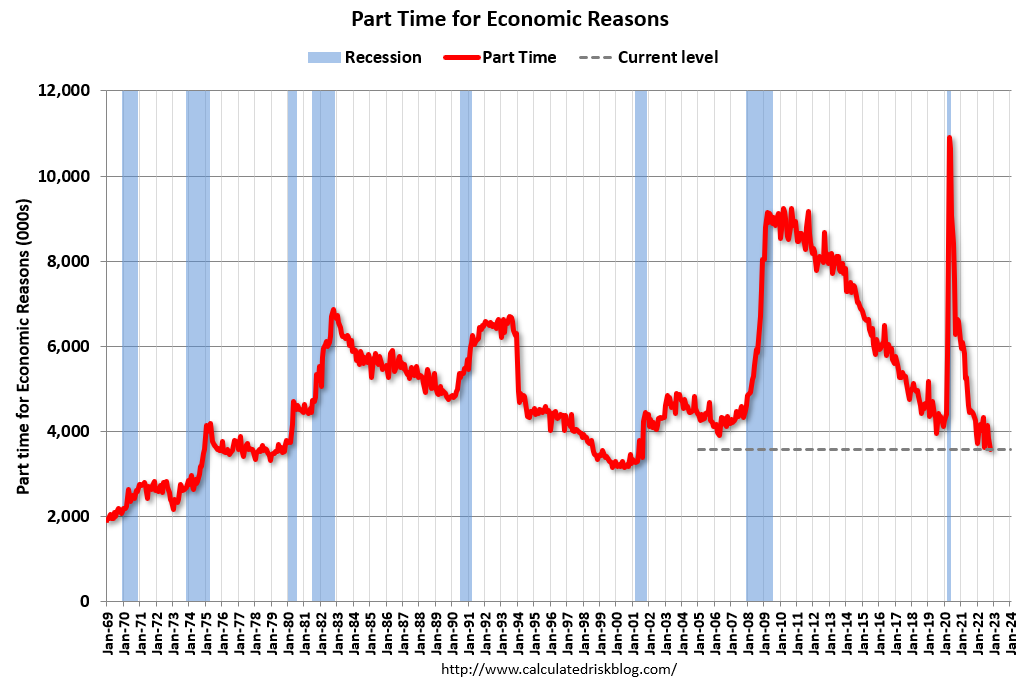
Part Time for Economic Reasons
 From the BLS report:
These workers are included in the alternate measure of labor underutilization (U-6) that increased to 6.8% from 6.7% in the previous month. This is down from the record high in April 22.9%, and is close to the lowest level on record for this measure since 1994. This measure is below the level in February 2020 (pre-pandemic).
Unemployed over 26 Weeks
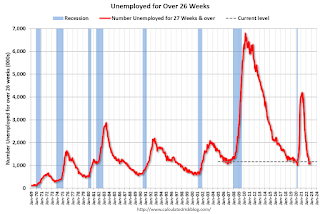 This graph shows the number of workers unemployed for 27 weeks or more.
According to the BLS, there are 1.165 million workers who have been unemployed for more than 26 weeks and still want a job, up from 1.067 million the previous month.
This is back to pre-pandemic levels.
Summary:
The headline monthly jobs number was above expectations and employment for the previous two months was revised up by 29,000, combined.
Part Time for Economic Reasons
 From the BLS report:
"The number of persons employed part time for economic reasons was little changed at 3.7 million in October. These individuals, who would have preferred full-time employment, were working part time because their hours had been reduced or they were unable to find full-time jobs."The number of persons working part time for economic reasons decreased in October to 3.577 million from 3.843 million in September. This is below pre-recession levels and the fewest part time workers (for economic reasons) in over 20 years.
These workers are included in the alternate measure of labor underutilization (U-6) that increased to 6.8% from 6.7% in the previous month. This is down from the record high in April 22.9%, and is close to the lowest level on record for this measure since 1994. This measure is below the level in February 2020 (pre-pandemic).
Unemployed over 26 Weeks
 This graph shows the number of workers unemployed for 27 weeks or more.
 According to the BLS, there are 1.165 million workers who have been unemployed for more than 26 weeks and still want a job, up from 1.067 million the previous month.
This is back to pre-pandemic levels.
Summary:
The headline monthly jobs number was above expectations and employment for the previous two months was revised up by 29,000, combined.
The headline unemployment rate increased to 3.7%.
Overall, this was another solid employment report.


