 RSS Feed
 by Calculated Risk on 12/31/2021 05:15:00 PM
Friday, December 31, 2021
"Highest Mortgage Rates in a Month, But Just Barely"
From Matthew Graham at MortgageNewsDaily: Highest Rates in a Month, But Just Barely
Mortgage rates began the week in decent shape, but moved higher somewhat abruptly yesterday. Context is important though. The smallest increment of adjustment for mortgages is typically 0.125%, and we haven't seen a move that big since early November. In fact, the overall range in 30yr fixed rates hasn't even been 0.125% during that time!
In other words, we're only able to say "highest rates in a month" because they finally trickled to just slightly higher levels. On that note, we might as well prepare for the next technicality. Specifically, if things get just a bit worse, we'll soon be able to say "highest rates in 9 months," even though they won't be too terribly different from today's.
 Click on graph for larger image.
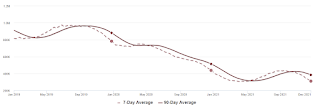
This is a graph from Mortgage News Daily (MND) showing 30-year fixed rates from three sources (MND, MBA, Freddie Mac) since 2010.
The 30-year fixed rate for top tier scenarios was 3.27% yesterday, up from 3.26% on Wednesday. This is still historically very low.
If rates rise to 3.30% that will be highest since March 2021. And 3.46% would be the highest since rates spiked briefly at the beginning of the pandemic.
Go to MND and you can adjust the graph for different time periods.
Question #7 for 2022: How about housing starts and new home sales in 2022?
by Calculated Risk on 12/31/2021 12:23:00 PM
Today, in the Real Estate Newsletter: Question #7 for 2022: How much will Residential investment change in 2022? How about housing starts and new home sales in 2022?
A brief excerpt:
Earlier I posted some questions on my blog for next year: Ten Economic Questions for 2022. Some of these questions concern real estate (inventory, house prices, housing credit, housing starts, new home sales), and I’ll post those in the newsletter (others like GDP and employment will be on my blog).There is much more in the article. You can subscribe at https://calculatedrisk.substack.com/
I'm adding some thoughts, and maybe some predictions for each question.
...
Most analysts are looking for new home sales to increase in 2022. For example, the NAHB expects new home sales to increase to 840 thousand in 2022, and Fannie Mae expects 897 thousand, and the MBA is forecasting 922 thousand in 2022.
And for housing starts, Fannie Mae is forecasting starts will be mostly unchanged at 1.6 million, and the NAHB is forecasting a decline to 1.55 million.
My guess is starts will be down low-to-mid single digits year-over-year in 2022. New home sales could pick up solidly if existing home inventory stays low, supply issues are resolved, and mortgage rates stay low, but my guess is new home sales will be mostly unchanged year-over-year.
Lawler: More on the CoreLogic Home Investor Activity Report
by Calculated Risk on 12/31/2021 08:33:00 AM
From housing economist Tom Lawler:
Below is a table showing quarterly home sales based on CoreLogic’s property records database for “non-investors” and for “investors” based on size of investors. For fun I also included the YOY % change in the S&P/Case-Shiller National Home Price Index., As a reminder, here is how CoreLogic defines an investor purchase:
Using CoreLogic’s public records data, we define an investor as an entity (individual or corporate) who retained three or more properties simultaneously within the past 10 years or has a corporate or non-individual identifier on the deed. Examples include LLCs, CORPs, and INCs, to name a few.”CoreLogic’s “size” categories fir investors are as follows: small 3-10 properties, mid-sized 11-99 properties, and large 100+ properties.
 Click on table for larger image.
What is striking is that investor home purchases by investors in all three size categories exploded upward beginning in the second quarter.
Note that while total home purchases in the third quarter of this year were up 7.5% from the third quarter of 2019, non-investor home purchases were DOWN 5.2%.
I’ll have even more on this topic later. WRT the above chart, however, here are some questions to consider:
Did investor purchases surge BECAUSE home prices were accelerating? Or was the surge in investor purchases behind the surge in home prices? Or … was it a combination of both?
Thursday, December 30, 2021
COVID December 30, 2021: Record Cases; Focus on Hospitalizations and Deaths
by Calculated Risk on 12/30/2021 09:21:00 PM
There will be no COVID updates until January 3rd. Have a safe New Year.
The CDC is the source for all data.
| COVID Metrics | ||||
|---|---|---|---|---|
| Today | Week Ago | Goal | ||
| Percent fully Vaccinated | 62.0% | --- | ≥70.0%1 | |
| Fully Vaccinated (millions) | 205.8 | --- | ≥2321 | |
| New Cases per Day3🚩 | 316,277 | 176,457 | ≤5,0002 | |
| Hospitalized3🚩 | 67,324 | 61,699 | ≤3,0002 | |
| Deaths per Day3 | 1,100 | 1,216 | ≤502 | |
| 1 Minimum to achieve "herd immunity" (estimated between 70% and 85%). 2my goals to stop daily posts, 37-day average for Cases, Currently Hospitalized, and Deaths 🚩 Increasing 7-day average week-over-week for Cases, Hospitalized, and Deaths ✅ Goal met. | ||||
 Click on graph for larger image.
This graph shows the daily (columns) and 7-day average (line) of hospitalizations reported.
Hospitalizations have turned up sharply over the last few days.
 The second graph shows the daily (columns) and 7-day average (line) of new cases reported.
Fannie Mae: Mortgage Serious Delinquency Rate Decreased in November
by Calculated Risk on 12/30/2021 04:18:00 PM
Fannie Mae reported that the Single-Family Serious Delinquency decreased to 1.46% in November, from 1.33% in October. The serious delinquency rate is down from 2.96% in November 2020.
These are mortgage loans that are "three monthly payments or more past due or in foreclosure".
The Fannie Mae serious delinquency rate peaked in February 2010 at 5.59% following the housing bubble and peaked at 3.32% in August 2020 during the pandemic.

By vintage, for loans made in 2004 or earlier (1% of portfolio), 3.61% are seriously delinquent (down from 4.02% in October).
For loans made in 2005 through 2008 (2% of portfolio), 6.05% are seriously delinquent (down from 6.90%),
For recent loans, originated in 2009 through 2021 (97% of portfolio), 1.08% are seriously delinquent (down from 1.17%). So, Fannie is still working through a few poor performing loans from the bubble years.
Mortgages in forbearance are counted as delinquent in this monthly report, but they will not be reported to the credit bureaus.
This is very different from the increase in delinquencies following the housing bubble. Lending standards have been fairly solid over the last decade, and most of these homeowners have equity in their homes - and they will be able to restructure their loans once they are employed.
Freddie Mac reported earlier.
Question #8 for 2022: Housing Credit: Will we see easier mortgage lending in 2022?
by Calculated Risk on 12/30/2021 03:12:00 PM
Today, in the Real Estate Newsletter: Question #8 for 2022: Housing Credit: Will we see easier mortgage lending in 2022?
A brief excerpt:
Earlier I posted some questions on my blog for next year: Ten Economic Questions for 2022. Some of these questions concern real estate (inventory, house prices, housing credit, housing starts, new home sales), and I’ll post those in the newsletter (others like GDP and employment will be on my blog).There is much more in the article. You can subscribe at https://calculatedrisk.substack.com/
I'm adding some thoughts, and maybe some predictions for each question.
...
...
Mortgage equity withdrawal will probably decline in 2022, since fewer homeowners will refinance their mortgages. However, there is some concern about banks easing lending standards, and the rapid increase in non-QM loans.
This will be something to watch in 2022, but overall lending is still solid (unlike during the housing bubble).
Question #9 for 2022: What will happen with house prices in 2022?
by Calculated Risk on 12/30/2021 10:16:00 AM
Today, in the Real Estate Newsletter: Question #9 for 2022: What will happen with house prices in 2022?
A brief excerpt:
Earlier I posted some questions on my blog for next year: Ten Economic Questions for 2022. Some of these questions concern real estate (inventory, house prices, housing credit, housing starts, new home sales), and I’ll post those in the newsletter (others like GDP and employment will be on my blog).There is much more in the article. You can subscribe at https://calculatedrisk.substack.com/
I'm adding some thoughts, and maybe some predictions for each question.
...
If inventory doesn’t increase in 2022, house prices will continue to increase at a double-digit pace. There are several possible reasons for an increase in inventory in 2022. Here are a few:
1. A sharp increase in mortgage rates.
2. Economic problems overseas that spillover into the US.
3. Unregulated areas of finance causing economic problems.
4.Affordability (a combination of higher mortgage rates and higher prices).
A sharp increase in mortgage rates is possible, especially if inflation stays elevated and the pandemic subsides (each wave of the pandemic has pushed down interest rates). And at some point, affordability will start to matter, but in general - with low mortgage rates - houses are still somewhat affordable (see the bottom of this post on affordability).
Weekly Initial Unemployment Claims Decrease to 198,000
by Calculated Risk on 12/30/2021 08:34:00 AM
The DOL reported:
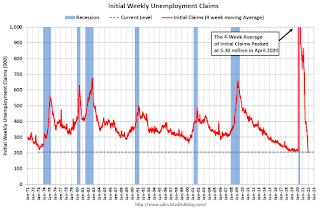
In the week ending December 25, the advance figure for seasonally adjusted initial claims was 198,000, a decrease of 8,000 from the previous week's revised level. The previous week's level was revised up by 1,000 from 205,000 to 206,000. The 4-week moving average was 199,250, a decrease of 7,250 from the previous week's revised average. This is the lowest level for this average since October 25, 1969 when it was 199,250. The previous week's average was revised up by 250 from 206,250 to 206,500.The following graph shows the 4-week moving average of weekly claims since 1971.
emphasis added
 Click on graph for larger image.
The dashed line on the graph is the current 4-week average. The four-week average of weekly unemployment claims increased to 206,000.
The previous week was revised up.
Regular state continued claims decreased to 1,716,000 (SA) from 1,856,000 (SA) the previous week.
Weekly claims were below the consensus forecast.
Wednesday, December 29, 2021
Thursday: Unemployment Claims, Chicago PMI
by Calculated Risk on 12/29/2021 08:18:00 PM
Thursday:
• At 8:30 AM ET, The initial weekly unemployment claims report will be released. Initial claims were 205 thousand last week.
• At 9:45 AM: Chicago Purchasing Managers Index for December.
And on COVID (focus on hospitalizations and deaths):
| COVID Metrics | ||||
|---|---|---|---|---|
| Today | Week Ago | Goal | ||
| Percent fully Vaccinated | 61.9% | --- | ≥70.0%1 | |
| Fully Vaccinated (millions) | 205.6 | --- | ≥2321 | |
| New Cases per Day3🚩 | 277,241 | 162,133 | ≤5,0002 | |
| Hospitalized3🚩 | 64,756 | 61,570 | ≤3,0002 | |
| Deaths per Day3 | 1,085 | 1,227 | ≤502 | |
| 1 Minimum to achieve "herd immunity" (estimated between 70% and 85%). 2my goals to stop daily posts, 37-day average for Cases, Currently Hospitalized, and Deaths 🚩 Increasing 7-day average week-over-week for Cases, Hospitalized, and Deaths ✅ Goal met. | ||||
 Click on graph for larger image.
This graph shows the daily (columns) and 7-day average (line) of positive tests reported.
Las Vegas Visitor Authority for November: Visitor Traffic Down 11.3% Compared to 2019
by Calculated Risk on 12/29/2021 02:16:00 PM
From the Las Vegas Visitor Authority: November 2021 Las Vegas Visitor Statistics
With traditional seasonal decreases after seeing annual peaks in October, November visitation exceeded 3.1M visitors (down ‐8.2% MoM and down ‐11.3% vs. Nov 2019.)
Overall hotel occupancy reached 77.6% for the month (‐4.0 pts MoM) as weekends saw continued strong levels at 90.7% (+0.3 pts MoM) while midweek occupancy ebbed MoM to 71.9% from 77.5% in October.
November room rates approached $156, surpassing Nov 2019 levels by 15.5%, while RevPAR reached $121, up 1.7% vs. Nov 2019.
 Click on graph for larger image.
 Thist graph shows visitor traffic for 2019 (blue), 2020 (orange) and 2021 (red).
Visitor traffic was down 11.3% compared to the same month in 2019.
There was no convention traffic from March 2020 until June 2021 (data still N/A).
I'll add a graph of convention traffic once convention data is available.
Real House Prices, Price-to-Rent Ratio and Price-to-Median Income in October
by Calculated Risk on 12/29/2021 11:36:00 AM
Today, in the CalculatedRisk Real Estate Newsletter: Real House Prices, Price-to-Rent Ratio and Price-to-Median Income in October
Excerpt:
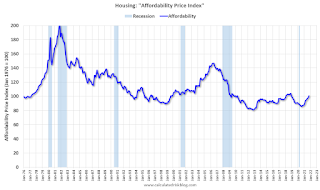
I’ve put together my own affordability index - since 1976 - that is similar to the FirstAm approach (more of a house price index adjusted by mortgage rates and the median household income).
I used median income from the Census Bureau (estimated 2021), assumed a 15% down payment, and used a 2% estimate for property taxes, insurance and maintenance. This is probably low for high property tax states like New Jersey and Texas, and too high for lower property tax states. If we were including condos, we’d also include HOA fees too (this is excluded).
For house prices, I used the Case-Shiller National Index, Seasonally Adjusted (SA). Also, for the down payment - there wasn’t a significant difference between 15% and 20%. For mortgage rates, I used the Freddie Mac PMMS (30-year fixed rates).
So here is what the index looks like (lower is more affordable like the FirstAm index)
...
In general, this would suggest houses are somewhat affordable right now (due to low mortgage rates). But this says nothing about if “now is a good time to buy” (see the bottom of my post Housing: A Look at "Affordability" Indexes).
Also, in October, the average 30-year mortgage rates were around 3.1%, and currently mortgage rates are close to 3.27% - so we already know the “Affordability Price Index” will increase over the next couple of months (meaning houses are less affordable).
emphasis added
NAR: Pending Home Sales Decreased 2.2% in November
by Calculated Risk on 12/29/2021 10:03:00 AM
From the NAR: Pending Home Sales Subside 2.2% in November
Pending home sales slipped in November, receding slightly after a previous month of gains, according to the National Association of Realtors®. Each of the four major U.S. regions witnessed contract transactions decline month-over-month. Year-over-year activity mostly retreated too, as three regions reported drops and only the Midwest saw an increase.This was well below expectations of a 0.6% increase for this index. Note: Contract signings usually lead sales by about 45 to 60 days, so this would usually be for closed sales in December and January.
The Pending Home Sales Index (PHSI), a forward-looking indicator of home sales based on contract signings, fell 2.2.% to 122.4 in November. Year-over-year, signings slid 2.7%. An index of 100 is equal to the level of contract activity in 2001.
...
Month-over-month, the Northeast PHSI declined 0.1% to 99.4 in November, an 8.5% drop from a year ago. In the Midwest, the index fell 6.3% to 116.8 last month, up 0.2% from November 2020.
Pending home sales transactions in the South ticked down 0.7% to an index of 148.2 in November, down 1.3% from November 2020. The index in the West slipped 2.2% in November to 105.5, down 4.6% from a year prior.
emphasis added
Tuesday, December 28, 2021
Wednesday: Pending Home Sales
by Calculated Risk on 12/28/2021 08:20:00 PM
Wednesday:
• At 7:00 AM ET, The Mortgage Bankers Association (MBA) will release the results for the mortgage purchase applications index.
• At 10:00 AM, Pending Home Sales Index for November. The consensus is for a 0.6% increase in the index.
And on COVID (focus on hospitalizations and deaths):
| COVID Metrics | ||||
|---|---|---|---|---|
| Today | Week Ago | Goal | ||
| Percent fully Vaccinated | 61.8% | --- | ≥70.0%1 | |
| Fully Vaccinated (millions) | 205.2 | --- | ≥2321 | |
| New Cases per Day3🚩 | 240,408 | 150,575 | ≤5,0002 | |
| Hospitalized3🚩 | 63,106 | 61,471 | ≤3,0002 | |
| Deaths per Day3 | 1,096 | 1,181 | ≤502 | |
| 1 Minimum to achieve "herd immunity" (estimated between 70% and 85%). 2my goals to stop daily posts, 37-day average for Cases, Currently Hospitalized, and Deaths 🚩 Increasing 7-day average week-over-week for Cases, Hospitalized, and Deaths ✅ Goal met. | ||||
 Click on graph for larger image.
This graph shows the daily (columns) and 7-day average (line) of positive tests reported.
A few comments on the Seasonal Pattern for House Prices
by Calculated Risk on 12/28/2021 03:19:00 PM
A few key points:
1) There is a clear seasonal pattern for house prices.
2) The surge in distressed sales during the housing bust distorted the seasonal pattern.
3) Even though distressed sales are down significantly, the seasonal factor is based on several years of data - and the factor is now closer to normal (second graph below).
4) Still the seasonal index is probably a better indicator of actual price movements than the Not Seasonally Adjusted (NSA) index.
For in depth description of these issues, see Jed Kolko's article from 2014 (currently Chief Economist at Indeed) "Let’s Improve, Not Ignore, Seasonal Adjustment of Housing Data"
Note: I was one of several people to question the change in the seasonal factor (here is a post in 2009) - and this led to S&P Case-Shiller questioning the seasonal factor too (from April 2010). I still use the seasonal factor (I think it is better than using the NSA data).

This graph shows the month-to-month change in the NSA Case-Shiller National index since 1987 (through October 2021). The seasonal pattern was smaller back in the '90s and early '00s and increased once the bubble burst.
The seasonal swings declined following the bubble, however the recent price surge changed the month-over-month pattern.
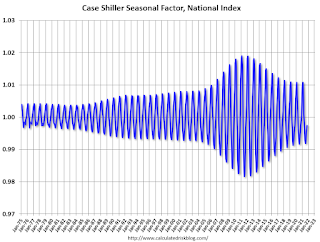
The swings in the seasonal factors have decreased, and the seasonal factors has been moving back towards more normal levels.
Note that the recent price surge hasn't distorted the seasonal factors.
Comments on Case-Shiller and FHFA House Price Increases
by Calculated Risk on 12/28/2021 10:39:00 AM
Today, in the CalculatedRisk Real Estate Newsletter: Case-Shiller National Index up 19.1% Year-over-year in October
Excerpt:
Both the Case-Shiller House Price Index (HPI) and the Federal Housing Finance Agency (FHFA) HPI for October were released today. Here is a graph of the month-over-month (MoM) change in the Case-Shiller National Index Seasonally Adjusted (SA).
The MoM increase in Case-Shiller was at 1.03%; still historically high, but lower than the previous 14 months. House prices started increasing sharply in the Case-Shiller index in August 2020, so the last 15 months have all been historically very strong, but the peak MoM growth is behind us - and the year-over-price growth is starting to decelerate.
...
We are seeing the expected deceleration in house price growth, and this trend will probably continue for at least a few more months (more on this tomorrow). My sense is the Case-Shiller National annual growth rate of 19.99% in August was probably the peak YoY growth rate, however, since the normal level of inventory is probably in the 4 to 6 months range - we’d have to see a significant increase in inventory to sharply slow price increases, and that is why I’m focused on inventory!
emphasis added

Case-Shiller: National House Price Index increased 19.1% year-over-year in October
by Calculated Risk on 12/28/2021 09:11:00 AM
S&P/Case-Shiller released the monthly Home Price Indices for October ("October" is a 3-month average of August, September and October prices).
This release includes prices for 20 individual cities, two composite indices (for 10 cities and 20 cities) and the monthly National index.
From S&P: S&P Corelogic Case-Shiller Index Reports 19.1% Annual Home Price Gain in October
The S&P CoreLogic Case-Shiller U.S. National Home Price NSA Index, covering all nine U.S. census divisions, reported a 19.1% annual gain in October, down from 19.7% in the previous month. The 10- City Composite annual increase came in at 17.1%, down from 17.9% in the previous month. The 20- City Composite posted an 18.4% year-over-year gain, down from 19.1% in the previous month.
Phoenix, Tampa, and Miami reported the highest year-over-year gains among the 20 cities in October. Phoenix led the way with a 32.3% year-over-year price increase, followed by Tampa with a 28.1% increase and Miami with a 25.7% increase. Six of the 20 cities reported higher price increases in the year ending October 2021 versus the year ending September 2021.
...
Before seasonal adjustment, the U.S. National Index posted a 0.8% month-over-month increase in October, while the 10-City and 20-City Composites both posted increases of 0.8%.
After seasonal adjustment, the U.S. National Index posted a month-over-month increase of 1.0%, and the 10-City and 20-City Composites posted increases of 0.8% and 0.9%, respectively.
In October, 18 of the 20 cities reported increases before seasonal adjustments while all 20 cities reported increases after seasonal adjustments
““In October 2021, U.S. home prices moved substantially higher, but at a decelerating rate,” says Craig J. Lazzara, Managing Director at S&P DJI. “The National Composite Index rose 19.1% from year-ago levels, and the 10- and 20-City Composites gained 17.1% and 18.4%, respectively. In all three cases, October’s gains were below September’s, and September’s gains were below August’s. That said, October’s 19.1% gain in the National Composite is the fourth-highest reading in the 34 years covered by our data. (The top three were the three months immediately preceding October.)”
emphasis added
 Click on graph for larger image.
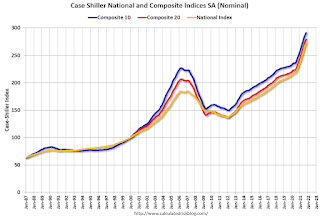
 The first graph shows the nominal seasonally adjusted Composite 10, Composite 20 and National indices (the Composite 20 was started in January 2000).
The Composite 10 index is up 0.8% in October (SA).
The Composite 20 index is up 0.9% (SA) in October.
The National index is 48% above the bubble peak (SA), and up 1.0% (SA) in October. The National index is up 100% from the post-bubble low set in February 2012 (SA).
The second graph shows the year-over-year change in all three indices.The Composite 10 SA is up 17.1% year-over-year. The Composite 20 SA is up 18.4% year-over-year.
The National index SA is up 19.1% year-over-year.
Price increases were close to expectations. I'll have more later.
Monday, December 27, 2021
Tuesday: Case-Shiller and FHFA House Prices, Richmond Fed Mfg
by Calculated Risk on 12/27/2021 07:25:00 PM
From Matthew Graham at Mortgage News Daily: MBS RECAP: Bonds Sticking to Uneventful Script
Domestic traders were slightly better buyers despite another run to record highs in stocks. 10yr yields hit the 3pm close down just over 1bp (1.482). MBS were sideways at modestly stronger levels as well. [30 year fixed 3.27%]Tuesday:
emphasis added
• At 9:00 AM ET, FHFA House Price Index for October. This was originally a GSE only repeat sales, however there is also an expanded index.
• At 9:00 AM, S&P/Case-Shiller House Price Index for October. The consensus is for a 18.5% year-over-year increase in the Composite 20 index for October.
• At 10:00 AM, Richmond Fed Survey of Manufacturing Activity for December. This is the last of regional manufacturing surveys for December.
And on COVID:
| COVID Metrics | ||||
|---|---|---|---|---|
| Today | Week Ago | Goal | ||
| Percent fully Vaccinated | 60.9% | --- | ≥70.0%1 | |
| Fully Vaccinated (millions) | 202.2 | --- | ≥2321 | |
| New Cases per Day3🚩 | 206,577 | 136,450 | ≤5,0002 | |
| Hospitalized3 | 56,466 | 61,362 | ≤3,0002 | |
| Deaths per Day3 | 1,041 | 1,164 | ≤502 | |
| 1 Minimum to achieve "herd immunity" (estimated between 70% and 85%). 2my goals to stop daily posts, 37-day average for Cases, Currently Hospitalized, and Deaths 🚩 Increasing 7-day average week-over-week for Cases, Hospitalized, and Deaths ✅ Goal met. | ||||
 Click on graph for larger image.
This graph shows the daily (columns) and 7-day average (line) of positive tests reported.
Final Look at Local Housing Markets in November
by Calculated Risk on 12/27/2021 12:00:00 PM
Today, in the CalculatedRisk Real Estate Newsletter: Final Look at Local Housing Markets in November
Excerpt:
This update adds Charlotte, Columbus, Miami, New York, and Phoenix.You can subscribe at https://calculatedrisk.substack.com/ (Currently all content is available for free, but please subscribe).
...
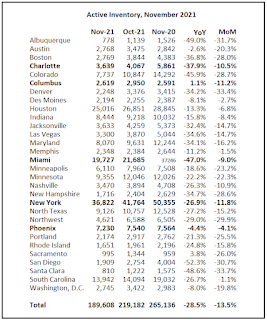
Here is a summary of active listings for these housing markets in November. Inventory was down 13.5% in November month-over-month (MoM) from October, and down 28.5% year-over-year (YoY).
Inventory almost always declines seasonally in November, so the MoM decline is not a surprise. Last month, these markets were down 25.5% YoY, so the YoY decline in November is larger than in October. This isn’t indicating a slowing market and suggests we will see new record low inventory levels this Winter.
Housing Inventory December 27th Update: Inventory Down 4.8% Week-over-week; Near Record Low
by Calculated Risk on 12/27/2021 09:49:00 AM
Tracking existing home inventory is very important in 2022.
Inventory usually declines sharply over the holidays - so we will likely see new record lows next week.
This inventory graph is courtesy of Altos Research.
As of December 24th, inventory was at 310 thousand (7-day average), compared to 437 thousand for the same week a year ago. That is a decline of 29.0%. Inventory is down 4.8% from last week.
Compared to the same week in 2019, inventory is down 60.3% from 783 thousand. A week ago, inventory was at 326 thousand, and was down 28.2% YoY.
Seasonally, inventory bottomed in April (usually inventory bottoms in January or February). Inventory last week was about 1.3% above the record low set-in early April.
Inventory peaked for the year in early September, when inventory was at 437 thousand (the peak for the year), so inventory is currently off about 29.0% from the peak for the year.
Mike Simonsen discusses this data regularly on Youtube.
Seven High Frequency Indicators for the Economy
by Calculated Risk on 12/27/2021 08:23:00 AM
These indicators are mostly for travel and entertainment. It is interesting to watch these sectors recover as the pandemic subsides.
The TSA is providing daily travel numbers.
This data is as of December 25th.
 Click on graph for larger image.
This data shows the 7-day average of daily total traveler throughput from the TSA for 2019 (Light Blue), 2020 (Blue) and 2021 (Red).
The dashed line is the percent of 2019 for the seven-day average.
The 7-day average is down 17.1% from the same day in 2019 (82.9% of 2019). (Dashed line)
Air travel had been off about 20% relative to 2019 for the last four months (with some ups and downs) - but picked up over the Thanksgiving and Christmas holidays.
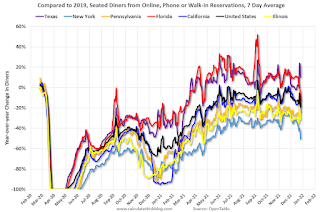
The second graph shows the 7-day average of the year-over-year change in diners as tabulated by OpenTable for the US and several selected cities.
IMPORTANT: OpenTable notes: "we’ve updated the data including downloadable dataset from January 1, 2021 onward to compare seated diners from 2021 to 2019, as opposed to year over year." Thanks!
 Thanks to OpenTable for providing this restaurant data:
This data is updated through December 25, 2021.
This data is "a sample of restaurants on the OpenTable network across all channels: online reservations, phone reservations, and walk-ins. For year-over-year comparisons by day, we compare to the same day of the week from the same week in the previous year."
Note that this data is for "only the restaurants that have chosen to reopen in a given market". Since some restaurants have not reopened, the actual year-over-year decline is worse than shown.
Dining was mostly moving sideways, but there has been a significant decline recently, probably due to the winter wave of COVID. The 7-day average for the US is down 19% compared to 2019.
Thanks to OpenTable for providing this restaurant data:This data is updated through December 25, 2021.
This data is "a sample of restaurants on the OpenTable network across all channels: online reservations, phone reservations, and walk-ins. For year-over-year comparisons by day, we compare to the same day of the week from the same week in the previous year."
Note that this data is for "only the restaurants that have chosen to reopen in a given market". Since some restaurants have not reopened, the actual year-over-year decline is worse than shown.
Dining was mostly moving sideways, but there has been a significant decline recently, probably due to the winter wave of COVID. The 7-day average for the US is down 19% compared to 2019.
 This data shows domestic box office for each week and the median for the years 2016 through 2019 (dashed light blue).
 Blue is 2020 and Red is 2021.
The data is from BoxOfficeMojo through December 23rd.
Note that the data is usually noisy week-to-week and depends on when blockbusters are released.
Movie ticket sales were at $418 million last week, down about 5% from the median for the week.
Note that the data is usually noisy week-to-week and depends on when blockbusters are released.
Movie ticket sales were at $418 million last week, down about 5% from the median for the week.
The numbers this week included the newest Spider Man.
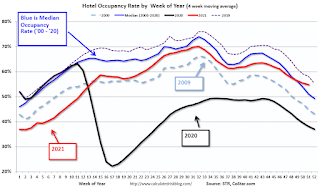 This graph shows the seasonal pattern for the hotel occupancy rate using the four-week average.
 The red line is for 2021, black is 2020, blue is the median, dashed purple is 2019, and dashed light blue is for 2009 (the worst year on record for hotels prior to 2020).
This data is through December 18th. The occupancy rate was up 8.0% compared to the same week in 2019. Although down compared to 2019, the 4-week average of the occupancy rate is now above the median rate for the previous 20 years (Blue).
Notes: Y-axis doesn't start at zero to better show the seasonal change.
The 4-week average of the occupancy rate will bottom seasonally over the next few weeks.
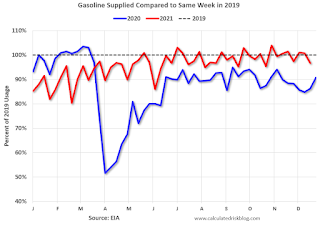 This graph, based on weekly data from the U.S. Energy Information Administration (EIA), shows gasoline supplied compared to the same week of 2019.
Blue is for 2020. Red is for 2021.
As of December 17th, gasoline supplied was down 3.4% compared to the same week in 2019.
There have been 12 weeks this year that gasoline supplied was up compared to the same week in 2019 - so consumption is running close to 2019 levels now.
This graph is from Apple mobility. From Apple: "This data is generated by counting the number of requests made to Apple Maps for directions in select countries/regions, sub-regions, and cities." This is just a general guide - people that regularly commute probably don't ask for directions.
There is also some great data on mobility from the Dallas Fed Mobility and Engagement Index. However the index is set "relative to its weekday-specific average over January–February", and is not seasonally adjusted, so we can't tell if an increase in mobility is due to recovery or just the normal increase in the Spring and Summer.
 This data is through December 25th
 for the United States and several selected cities.
The graph is the running 7-day average to remove the impact of weekends.
IMPORTANT: All data is relative to January 13, 2020. This data is NOT Seasonally Adjusted. People walk and drive more when the weather is nice, so I'm just using the transit data.
According to the Apple data directions requests, public transit in the 7-day average for the US is at 83% of the January 2020 level.
New York City is doing OK by this metric, but subway usage in NYC is down significantly (next graph).
----- New York City Subway Usage -----
Here is some interesting data on New York subway usage (HT BR).
 This graph is from Todd W Schneider.
Here is some interesting data on New York subway usage (HT BR).
This graph is from Todd W Schneider. This graph shows how much MTA traffic has recovered in each borough (Graph starts at first week in January 2020 and 100 = 2019 average).
Manhattan is at about 33% of normal (impacted by holidays too).
This data is through Friday, December 24th.
He notes: "Data updates weekly from the MTA’s public turnstile data, usually on Saturday mornings".
Sunday, December 26, 2021
Sunday Night Futures
by Calculated Risk on 12/26/2021 06:13:00 PM
Weekend:
• Schedule for Week of December 26, 2021
Monday:
• At 10:30 AM ET, Dallas Fed Survey of Manufacturing Activity for December.
From CNBC: Pre-Market Data and Bloomberg futures S&P 500 and DOW futures are up slightly (fair value).
Oil prices were up over the last week with WTI futures at $73.79 per barrel and Brent at $76.14 per barrel. A year ago, WTI was at $48, and Brent was at $51 - so WTI oil prices are up 50% year-over-year.
Here is a graph from Gasbuddy.com for nationwide gasoline prices. Nationally prices are at $3.25 per gallon. A year ago prices were at $2.24 per gallon, so gasoline prices are up $1.01 per gallon year-over-year.
Question #10 for 2022: Will inventory increase as the pandemic subsides, or will inventory decrease further in 2022?
by Calculated Risk on 12/26/2021 11:59:00 AM
Today, in the Real Estate Newsletter: Question #10 for 2022: Will inventory increase as the pandemic subsides, or will inventory decrease further in 2022?
Brief excerpt:
Earlier I posted some questions on my blog for next year: Ten Economic Questions for 2022. Some of these questions concern real estate (inventory, house prices, housing credit, housing starts, new home sales), and I’ll post those in the newsletter (others like GDP and employment will be on my blog).There is much more in the article. You can subscribe at https://calculatedrisk.substack.com/
I'm adding some thoughts, and maybe some predictions for each question.
...
And the sharp decline in inventory during the pandemic (green arrow) was an indicator that price appreciation would increase. Inventory declined due to a combination of potential sellers keeping their properties off the market during a pandemic, and a pickup in buying due to record low mortgage rates, a move away from multi-family rentals and strong second home buying (to escape the high-density cities). And at the same time, demographics were favorable for home buying (a large cohort has moved into the peak home buying years).
...
First, it appears we will see record low inventories over the next few months. This suggests we will see further strong price gains over the next several months (with low inventories).
In 2021, the NAR showed inventory bottomed in January and (inventory bottoms in December), however the local MLS data, and the Altos Research data, showed inventory bottomed even later than usual - in March or early April 2021. If 2022 follows the normal seasonal pattern, we will see inventory increasing by February (and maybe even in January).
The timing of the seasonal bottom will be important this year. If inventory bottoms seasonally in December, we might see inventory increase YoY later in 2022. However, if inventory doesn't bottom until March or April, we will probably see another crazy year with little inventory.
Saturday, December 25, 2021
Real Estate Newsletter Articles this Week
by Calculated Risk on 12/25/2021 02:11:00 PM
At the Calculated Risk Real Estate Newsletter this week:
• Lawler: More on Investor Purchases of Residential Homes: Pretium
• New Home Sales: Record 110 thousand homes have not been started New Home Prices Are Up 20% Year-over-year
• Existing-Home Sales Increased to 6.46 million in November Inventory down 13.3% year-over-year
• 5th Look at Local Housing Markets in November
• Supply Chain Disruptions and Housing Inventory
This is usually published several times a week, and provides more in-depth analysis of the housing market.
The blog will continue as always!
You can subscribe at https://calculatedrisk.substack.com/ Currently all content is available for free - and some will always be free - but please subscribe!.
You can subscribe at https://calculatedrisk.substack.com/ Currently all content is available for free - and some will always be free - but please subscribe!.
Schedule for Week of December 26, 2021
by Calculated Risk on 12/25/2021 08:11:00 AM
Merry Christmas and Happy New Year! Wishing you all the best in 2022.
The key indicator this week is Case-Shiller House Prices for October.
10:30 AM: Dallas Fed Survey of Manufacturing Activity for December.
9:00 AM: FHFA House Price Index for October. This was originally a GSE only repeat sales, however there is also an expanded index.
 9:00 AM ET: S&P/Case-Shiller House Price Index for October.
This graph shows graph shows the Year over year change in the seasonally adjusted National Index, Composite 10 and Composite 20 indexes through the most recent report (the Composite 20 was started in January 2000).
The consensus is for a 18.5% year-over-year increase in the Composite 20 index for October.
10:00 AM: Richmond Fed Survey of Manufacturing Activity for December. This is the last of regional manufacturing surveys for December.
7:00 AM ET: The Mortgage Bankers Association (MBA) will release the results for the mortgage purchase applications index.
10:00 AM: Pending Home Sales Index for November. The consensus is for a 0.6% increase in the index.
8:30 AM: The initial weekly unemployment claims report will be released. Initial claims were 205 thousand last week.
9:45 AM: Chicago Purchasing Managers Index for December.
No major economic releases scheduled. Markets will be open.
Friday, December 24, 2021
Lawler: More on Investor Purchases of Residential Homes: Pretium
by Calculated Risk on 12/24/2021 01:33:00 PM
Today, in the Real Estate Newsletter: Lawler: More on Investor Purchases of Residential Homes: Pretium
Brief excerpt:
“In a report last month, I wrote about how data from Redfin and CoreLogic indicated that there had been a surge in investor buying of SF homes in the second and third quarters of this year, with some of the biggest increases coming from “large” investors.You can subscribe at https://calculatedrisk.substack.com/
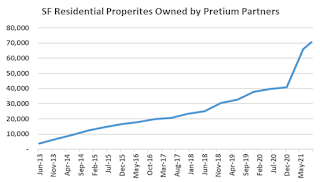
One private company that has massively increased its holdings of SF residential properties is Pretium Partners, a “specialized investment manager” with a huge portfolio of SF residential properties for rent. (Pretium owns Progress Residential, which has recently gotten some negative press.)
According to Pretium’s website, Pretium has increased the number of SF properties it owns from 41,000 at the end of 2020 to 70,700 at the end of September 2021.
Ten Economic Questions for 2022
by Calculated Risk on 12/24/2021 10:32:00 AM
Here is a review of the Ten Economic Questions for 2021
Below are my ten questions for 2022. These are just questions; I'll follow up with some thoughts on each of these questions.
The purpose of these questions is to provide a framework to think about how the U.S. economy will perform in 2022, and if there are surprises - like in 2020 - to adjust my thinking.
A key question is when will the pandemic subside significantly? This will have a huge economic impact but is a question for infectious disease experts. The good news is a large percentage of the population is vaccinated, and there are effective drugs on the way. Science should continue to make progress against the virus.
1) Economic growth: Economic growth was probably around 5.5% in 2021 as the economy rebounded from 2020. There will be a drag from fiscal policy in 2022, and monetary policy will be less accommodative. The FOMC is expecting growth of 3.6% to 4.5% Q4-over-Q4 in 2022. How much will the economy grow in 2022?
2) Employment: Through November 2021, the economy added 6.1 million jobs in 2021. This makes 2021 the best year for job growth ever - by far. However, there are still 3.9 million fewer jobs than in February 2020 (pre-pandemic). Will the remaining jobs lost in 2020 return in 2022, or will job growth be sluggish?
3) Unemployment Rate: The unemployment rate was at 4.2% in November, down 2.5 percentage points year-over-year. Currently the FOMC is forecasting the unemployment rate will be in the 3.4% to 3.7% range in Q4 2022. What will the unemployment rate be in December 2022?
4) Participation Rate: In November 2021, the overall participation rate was at 61.8%, up year-over-year from 61.5% in November 2020. Long term, the BLS is projecting the overall participation rate will decline to 60.4% by 2030 due to demographics. Will the overall participation rate increase to pre-pandemic levels (63.4% in February 2020)? What will be the participation rate in December 2022?
5) Inflation: Core PCE was up 4.7% YoY through November. This was the highest YoY increase in core PCE since 1989. The FOMC is forecasting the YoY change in core PCE will be in the 2.5% to 3.0% range in Q4 2022. Will the core inflation rate increase or decrease by December 2022?
6) Monetary Policy: In response to the pandemic, the FOMC cut rates to zero, and initiated an asset purchase program in March 2020. The FOMC is currently on pace to stop the asset purchase program in March 2022. A majority of FOMC participants expect three rate hikes in 2022. Will the Fed raise rates in 2022? If so, how many times?
7) Residential Investment: Residential investment (RI) was a slight drag on growth in 2021, because investment was so strong in the 2nd half of 2020. Through November, starts were up 16.3% year-to-date compared to the same period in 2020. New home sales were down 6.5% year-to-date through November. Note: RI is mostly investment in new single-family structures, multifamily structures, home improvement and commissions on existing home sales. How much will RI change in 2022? How about housing starts and new home sales in 2022?
8) Housing Credit: Will we see easier mortgage lending in 2022? Will we see a further sharp increase in mortgage equity withdrawal (MEW)?
9) House Prices: It appears house prices - as measured by the national repeat sales index (Case-Shiller, FHFA, and CoreLogic) - will be up around 18% to 20% in 2021. What will happen with house prices in 2022?
10) Housing Inventory: Housing inventory decreased sharply during the pandemic to record lows in early 2021. Will inventory increase as the pandemic subsides, or will inventory decrease further in 2022?
Some thoughts:
• Question #1 for 2022: How much will the economy grow in 2022?
• Question #2 for 2022: Will the remaining jobs lost in 2020 return in 2022, or will job growth be sluggish?
• Question #3 for 2022: What will the unemployment rate be in December 2022?
• Question #4 for 2022: Will the overall participation rate increase to pre-pandemic levels (63.4% in February 2020)?
• Question #5 for 2022: Will the core inflation rate increase or decrease by December 2022?
• Question #6 for 2022: Will the Fed raise rates in 2022? If so, how many times?
• Question #7 for 2022: How about housing starts and new home sales in 2022?
• Question #8 for 2022: Housing Credit: Will we see easier mortgage lending in 2022?
• Question #9 for 2022: What will happen with house prices in 2022?
• Question #10 for 2022: Will inventory increase as the pandemic subsides, or will inventory decrease further in 2022?
Black Knight: National Mortgage Delinquency Rate Decreased in November; Foreclosures at Record Low
by Calculated Risk on 12/24/2021 08:11:00 AM
Note: At the beginning of the pandemic, the delinquency rate increased sharply (see table below). Loans in forbearance are counted as delinquent in this survey, but those loans are not reported as delinquent to the credit bureaus.
From Black Knight: Mortgage Delinquencies Continue Steady Improvement; Active Foreclosures Fall to Yet Another Record Low Entering Final Month of 2021
• The national delinquency rate saw yet another month of steady improvement, with November’s 4.1% monthly decline matching the 18-month average rate of reductionAccording to Black Knight's First Look report, the percent of loans delinquent decreased 4.1% in November compared to October and decreased 43% year-over-year.
• Despite serious delinquencies (loans 90+ days past due but not in foreclosure) falling another 80,000 from October, over 1 million such delinquencies remain, 2.5 times more than at the start of the pandemic
• Both foreclosure starts (3,700) and active foreclosure inventory (132,000) hit new record lows in November as borrowers continue to work through available forbearance and loss mitigation options
• More than 800,000 forbearance exits have occurred over the past 60 days, with nearly 560,000 homeowners remaining in post-forbearance loss mitigation
• Given the size of this population, both serious delinquency and foreclosure metrics demand close attention as we enter 2022
• Prepayment activity (SMM) fell by 8.9% in November to hit its lowest level in 22 months, as rising 30-year rates continue to put downward pressure on refinance volumes
emphasis added
The percent of loans in the foreclosure process decreased 4.3% in November and were down 24% over the last year.
Black Knight reported the U.S. mortgage delinquency rate (loans 30 or more days past due, but not in foreclosure) was 3.59% in November, down from 3.74% in October.
The percent of loans in the foreclosure process decreased in November to 0.25%, from 0.26% in October.
The number of delinquent properties, but not in foreclosure, is down 1,475,000 properties year-over-year, and the number of properties in the foreclosure process is down 44,000 properties year-over-year.
| Black Knight: Percent Loans Delinquent and in Foreclosure Process | ||||
|---|---|---|---|---|
| Nov 2021 | Oct 2021 | Nov 2020 | Nov 2019 | |
| Delinquent | 3.59% | 3.74% | 6.33% | 3.53% |
| In Foreclosure | 0.25% | 0.26% | 0.33% | 0.47% |
| Number of properties: | ||||
| Number of properties that are delinquent, but not in foreclosure: | 1,906,000 | 1,986,000 | 3,381,000 | 1,868,000 |
| Number of properties in foreclosure pre-sale inventory: | 132,000 | 138,000 | 176,000 | 248,000 |
| Total Properties | 2,039,000 | 2,125,000 | 3,557,000 | 2,116,000 |
Thursday, December 23, 2021
COVID December 23, 2021: Average Cases Exceeds Delta Peak
by Calculated Risk on 12/23/2021 08:58:00 PM
There will be no COVID updates over the 3-day Christmas weekend. Stay safe.
The CDC is the source for all data.
| COVID Metrics | ||||
|---|---|---|---|---|
| Today | Week Ago | Goal | ||
| Percent fully Vaccinated | 61.7% | --- | ≥70.0%1 | |
| Fully Vaccinated (millions) | 204.7 | --- | ≥2321 | |
| New Cases per Day3🚩 | 176,097 | 121,154 | ≤5,0002 | |
| Hospitalized3🚩 | 60,871 | 60,043 | ≤3,0002 | |
| Deaths per Day3🚩 | 1,213 | 1,170 | ≤502 | |
| 1 Minimum to achieve "herd immunity" (estimated between 70% and 85%). 2my goals to stop daily posts, 37-day average for Cases, Currently Hospitalized, and Deaths 🚩 Increasing 7-day average week-over-week for Cases, Hospitalized, and Deaths ✅ Goal met. | ||||
 Click on graph for larger image.
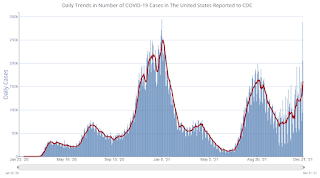
This graph shows the daily (columns) and 7-day average (line) of cases reported.
The scale might change soon (almost record number of new cases reported recently).
Freddie Mac: Mortgage Serious Delinquency Rate decreased in November
by Calculated Risk on 12/23/2021 04:42:00 PM
Freddie Mac reported that the Single-Family serious delinquency rate in November was 1.24%, down from 1.32% in October. Freddie's rate is down year-over-year from 2.75% in November 2020.
Freddie's serious delinquency rate peaked in February 2010 at 4.20% following the housing bubble, and peaked at 3.17% in August 2020 during the pandemic.
These are mortgage loans that are "three monthly payments or more past due or in foreclosure".

Mortgages in forbearance are being counted as delinquent in this monthly report, but are not reported to the credit bureaus.
This is very different from the increase in delinquencies following the housing bubble. Lending standards have been fairly solid over the last decade, and most of these homeowners have equity in their homes - and they will be able to restructure their loans once (if) they are employed.
Also - for multifamily - delinquencies were at 0.09%, down from the peak of 0.20% in April 2021.
Hotels: Occupancy Rate Up 8% Compared to Same Week in 2019
by Calculated Risk on 12/23/2021 02:15:00 PM
Note: Since occupancy declined sharply at the onset of the pandemic, CoStar is comparing to 2019.
U.S. hotel performance surpassed the levels seen during the comparable week of 2019, according to STR‘s latest data through December 18.The following graph shows the seasonal pattern for the hotel occupancy rate using the four week average.
December 12-18, 2021 (percentage change from comparable week in 2019*):
• Occupancy: 53.8% (+7.7%)
• Average daily rate (ADR): US$121.87 (+11.6%)
• Revenue per available room (RevPAR): US$65.61 (+20.2%)
Percentage changes were in part lifted by the comparable week of 2019 (ending 21 December) being closer to Christmas.
*Due to the steep, pandemic-driven performance declines of 2020, STR is measuring recovery against comparable time periods from 2019.
emphasis added
Click on graph for larger image.The red line is for 2021, black is 2020, blue is the median, dashed purple is 2019, and dashed light blue is for 2009 (the worst year on record for hotels prior to 2020).
Although down compared to 2019, the 4-week average of the occupancy rate is now above the median rate for the previous 20 years (Blue).
Note: Y-axis doesn't start at zero to better show the seasonal change.
The 4-week average of the occupancy rate will bottom seasonally over the next few weeks.
New Home Sales: Record 110 thousand homes have not been started
by Calculated Risk on 12/23/2021 12:35:00 PM
Today, in the Real Estate Newsletter: New Home Sales: Record 110 thousand homes have not been started
Brief excerpt:
Sales, year to date in 2021, are 6.5% below sales in 2020, and new home sales in 2021 will finish solidly below sales in 2020 - since sales in 2020 finished strong.You can subscribe at https://calculatedrisk.substack.com/ (Currently all content is available for free, but please subscribe).
This graph shows new home sales for 2020 and 2021 by month (Seasonally Adjusted Annual Rate).
The year-over-year comparisons were easy in the first half of 2021 - especially in March and April. However, sales will be down year-over-year again in December - since the selling season was delayed in 2020.
...
The next graph shows the months of supply by stage of construction. “Months of supply” is inventory at each stage, divided by the sales rate.
The inventory of completed homes for sale was at 39 thousand in November, up from the record low of 33 thousand in March, April, May and July 2021. That is about 0.6 months of completed supply (red line). This is about half the normal level.
The inventory of new homes under construction is at 4.1 months (blue line) - well above the normal level. This elevated level of homes under construction is due to supply chain constraints.
And a record 110 thousand homes have not been started - about 1.8 months of supply (grey line) - almost double the normal level. Homebuilders are probably waiting to start some homes until they have a firmer grasp on prices.
New Home Sales at 744,000 Annual Rate in November
by Calculated Risk on 12/23/2021 10:08:00 AM
The Census Bureau reports New Home Sales in November were at a seasonally adjusted annual rate (SAAR) of 744 thousand.
The previous three months were revised down significantly.
Sales of new single‐family houses in November 2021 were at a seasonally adjusted annual rate of 744,000, according to estimates released jointly today by the U.S. Census Bureau and the Department of Housing and Urban Development. This is 12.4 percent above the revised October rate of 662,000, but is 14.0 percent below the November 2020 estimate of 865,000.
emphasis added
 Click on graph for larger image.
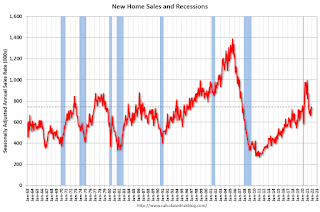
The first graph shows New Home Sales vs. recessions since 1963. The dashed line is the current sales rate.
New home sales are now declining year-over-year since sales soared following the first few months of the pandemic.
The second graph shows New Home Months of Supply.
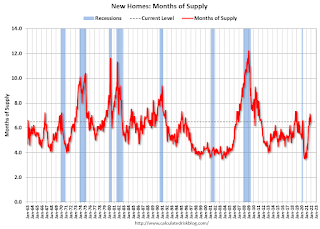 The months of supply decreased in November to 6.5 months from 7.1 months in October.
 The all-time record high was 12.1 months of supply in January 2009. The all-time record low was 3.5 months, most recently in October 2020.
This is above the normal range (about 4 to 6 months of supply is normal).
"The seasonally‐adjusted estimate of new houses for sale at the end of November was 402,000. This represents a supply of 6.5 months at the current sales rate."
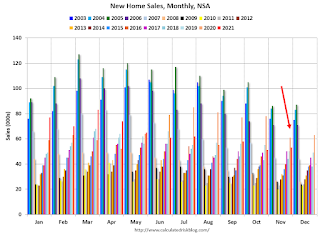 The last graph shows sales NSA (monthly sales, not seasonally adjusted annual rate).
In November 2021 (red column), 53 thousand new homes were sold (NSA). Last year, 61 thousand homes were sold in November.
The all-time high for November was 86 thousand in 2005, and the all-time low for November was 20 thousand in 2010.
This was below expectations of 766 thousand SAAR, and sales in the three previous months were revised down significantly. I'll have more later today.
Personal Income increased 0.4% in November; Spending increased 0.6%
by Calculated Risk on 12/23/2021 08:41:00 AM
The BEA released the Personal Income and Outlays report for November:
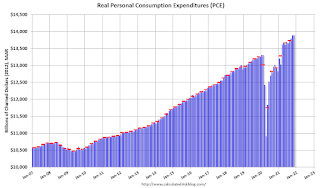
Personal income increased $90.4 billion (0.4 percent) in November according to estimates released today by the Bureau of Economic Analysis. Disposable personal income (DPI) increased $70.4 billion (0.4 percent) and personal consumption expenditures (PCE) increased $104.7 billion (0.6 percent).The November PCE price index increased 5.7 percent year-over-year and the November PCE price index, excluding food and energy, increased 4.7 percent year-over-year.
Real DPI decreased 0.2 percent in November and Real PCE increased less than 0.1 percent; spending on services increased 0.5 percent and spending on goods decreased 0.8 percent. The PCE price index increased 0.6 percent. Excluding food and energy, the PCE price index increased 0.5 percent
emphasis added
The following graph shows real Personal Consumption Expenditures (PCE) through November 2021 (2012 dollars). Note that the y-axis doesn't start at zero to better show the change.
 Click on graph for larger image.
The dashed red lines are the quarterly levels for real PCE.
Personal income was above expectations, and the increase in PCE was below expectations.
Using the two-month method to estimate Q4 PCE growth, PCE was increasing at a 5.7% annual rate in Q4 2021. (Using the mid-month method, PCE was increasing at 4.2%).
Weekly Initial Unemployment Claims Unchanged at 205,000
by Calculated Risk on 12/23/2021 08:34:00 AM
The DOL reported:
In the week ending December 18, the advance figure for seasonally adjusted initial claims was 205,000, unchanged from the previous week's revised level. The previous week's level was revised down by 1,000 from 206,000 to 205,000. The 4- week moving average was 206,250, an increase of 2,750 from the previous week's revised average. The previous week's average was revised down by 250 from 203,750 to 203,500.The following graph shows the 4-week moving average of weekly claims since 1971.
emphasis added
 Click on graph for larger image.
The dashed line on the graph is the current 4-week average. The four-week average of weekly unemployment claims increased to 206,000.
The previous week was revised down.
Regular state continued claims decreased to 1,859,000 (SA) from 1,867,000 (SA) the previous week.
Weekly claims were at the consensus forecast.
Wednesday, December 22, 2021
Thursday: Unemployment Claims, Durable Goods, Personal Income and Outlays, New Home Sales
by Calculated Risk on 12/22/2021 07:34:00 PM
Thursday:
• At 8:30 AM ET, the initial weekly unemployment claims report will be released. Initial claims were 206 thousand last week.
• Also, at 8:30 AM, Durable Goods Orders for November.
• Also, at 8:30 AM, Personal Income and Outlays for November. The consensus is for a 0.2% increase in personal income, and for a 1.0% increase in personal spending.
• At 10:00 AM, New Home Sales for November from the Census Bureau. The consensus is 766 thousand sales SAAR.
• Also, at 10:00 AM, University of Michigan's Consumer sentiment index (Final for December).
From CR on COVID (mostly focus on hospitalizations and deaths, although new cases are rising rapidly):
The CDC is the source for all data.
| COVID Metrics | ||||
|---|---|---|---|---|
| Today | Week Ago | Goal | ||
| Percent fully Vaccinated | 61.7% | --- | ≥70.0%1 | |
| Fully Vaccinated (millions) | 204.8 | --- | ≥2321 | |
| New Cases per Day3🚩 | 161,261 | 118,855 | ≤5,0002 | |
| Hospitalized3🚩 | 61,290 | 59,405 | ≤3,0002 | |
| Deaths per Day3🚩 | 1,223 | 1,112 | ≤502 | |
| 1 Minimum to achieve "herd immunity" (estimated between 70% and 85%). 2my goals to stop daily posts, 37-day average for Cases, Currently Hospitalized, and Deaths 🚩 Increasing 7-day average week-over-week for Cases, Hospitalized, and Deaths ✅ Goal met. | ||||
 Click on graph for larger image.
This graph shows the daily (columns) and 7-day average (line) of cases reported.
The scale might change soon (almost record number of new cases reported yesterday).


