 RSS Feed
 by Calculated Risk on 12/31/2020 06:51:00 PM
Thursday, December 31, 2020
December 31 COVID-19 Test Results; Record Hospitalizations
Wishing everyone a safe, healthy and Happy New Year!
Note: Expect a dip in the data over the holidays. The week-over-week growth in positive cases slowed prior to the holidays. Hopefully that continues after the holidays.
The US is now averaging close to 2 million tests per day. Based on the experience of other countries, for adequate test-and-trace (and isolation) to reduce infections, the percent positive needs to be under 5% (probably close to 1%), so the US has far too many daily cases - and percent positive - to do effective test-and-trace.
There were 1,719,181 test results reported over the last 24 hours.
There were 221,444 positive tests.
Over 77,000 US deaths were reported in December, far surpassing April as the deadliest month. See the graph on US Daily Deaths here.
 Click on graph for larger image.
This data is from the COVID Tracking Project.
The percent positive over the last 24 hours was 12.9% (red line is 7 day average). The percent positive is calculated by dividing positive results by total tests (including pending).
And check out COVID Act Now to see how each state is doing. (updated link to new site)
 The second graph shows the 7 day average of positive tests reported and daily hospitalizations.
• Record Hospitalizations
Question #4 for 2021: Will the overall participation rate increase to pre-pandemic levels (63.4% in February 2020) , or will it will only partially recover in 2021?
by Calculated Risk on 12/31/2020 02:31:00 PM
Earlier I posted some questions for next year: Ten Economic Questions for 2021. I'm adding some thoughts, and maybe some predictions for each question.
4) Participation Rate: In November 2020, the overall participation rate was at 61.5%, down year-over-year from 63.2% in November 2019. Long term, the BLS has been projecting the overall participation rate will decline to 61.2% by 2029 due to demographics. Will the overall participation rate increase to pre-pandemic levels (63.4% in February 2020) , or will it will only partially recover in 2021?
The overall labor force participation rate is the percentage of the working age population (16 + years old) in the labor force. A large portion of the decline in the participation rate since 2000 was due to demographics and long term trends.
 Click on graph for larger image.
The Labor Force Participation Rate in November 2020 was at 61.5% (red), down from the pre-pandemic level of 63.4% in February, and up from the pandemic low of 60.2% in April 2020. (Blue is the employment population ratio).
In April, 8.1 million people had left the labor force due to the pandemic. By November, about half of these people had returned to the labor force, and there were 4.1 million fewer people in the labor force than at the beginning of the year.
When we look at the age groups that haven't returned to the workforce, a large number are younger (the largest number are in the 25 to 29 age cohort), and mostly prime age workers. This suggests most of these people will eventually return to the labor force.
My guess, based on the pandemic ending around mid-year, is that most of these people will return to the labor force. I don't expect that participation rate to increase to pre-pandemic levels (63.4%), but it seems reason the participation rate will increase to the mid-to-high 62s by year end.
Here are the Ten Economic Questions for 2021 and a few predictions:
• Question #1 for 2021: How much will the economy grow in 2021?
• Question #2 for 2021: Will all the jobs lost in 2020 return in 2021, or will job growth be sluggish?
• Question #3 for 2021: What will the unemployment rate be in December 2021?
• Question #4 for 2021: Will the overall participation rate increase to pre-pandemic levels (63.4% in February 2020) , or will it will only partially recover in 2021?
• Question #5 for 2021: Will the core inflation rate increase in 2021? Will too much inflation be a concern in 2021?
• Question #6 for 2021: Will the Fed raise rates in 2021? What about the asset purchase program?
• Question #7 for 2021: How much will RI increase in 2021? How about housing starts and new home sales in 2021?
• Question #8 for 2021: What will happen with house prices in 2021?
• Question #9 for 2021: Will inventory increase as the pandemic subsides, or will inventory decrease further in 2021?
• Question #10 for 2021: How much damage did the pandemic do to certain sectors?
When we look at the age groups that haven't returned to the workforce, a large number are younger (the largest number are in the 25 to 29 age cohort), and mostly prime age workers. This suggests most of these people will eventually return to the labor force.
In September, the BLS released their updated Labor Force projections through 2029. Their projections show the overall Labor Force Participation Rate (LFPR) declining to 61.2% in 2029. We need to remember this demographic trend.
My guess, based on the pandemic ending around mid-year, is that most of these people will return to the labor force. I don't expect that participation rate to increase to pre-pandemic levels (63.4%), but it seems reason the participation rate will increase to the mid-to-high 62s by year end.
Here are the Ten Economic Questions for 2021 and a few predictions:
• Question #1 for 2021: How much will the economy grow in 2021?
• Question #2 for 2021: Will all the jobs lost in 2020 return in 2021, or will job growth be sluggish?
• Question #3 for 2021: What will the unemployment rate be in December 2021?
• Question #4 for 2021: Will the overall participation rate increase to pre-pandemic levels (63.4% in February 2020) , or will it will only partially recover in 2021?
• Question #5 for 2021: Will the core inflation rate increase in 2021? Will too much inflation be a concern in 2021?
• Question #6 for 2021: Will the Fed raise rates in 2021? What about the asset purchase program?
• Question #7 for 2021: How much will RI increase in 2021? How about housing starts and new home sales in 2021?
• Question #8 for 2021: What will happen with house prices in 2021?
• Question #9 for 2021: Will inventory increase as the pandemic subsides, or will inventory decrease further in 2021?
• Question #10 for 2021: How much damage did the pandemic do to certain sectors?
Question #5 for 2021: Will the core inflation rate increase in 2021? Will too much inflation be a concern in 2021?
by Calculated Risk on 12/31/2020 01:43:00 PM
Earlier I posted some questions for next year: Ten Economic Questions for 2021. I'm adding some thoughts, and maybe some predictions for each question.
5) Inflation: Core PCE was only up 1.4% YoY through November. Will the core inflation rate increase in 2021? Will too much inflation be a concern in 2021?
Although there are different measure for inflation they mostly show inflation at or below the Fed's 2% inflation target.
Note: I follow several measures of inflation, median CPI and trimmed-mean CPI from the Cleveland Fed. Core PCE prices (monthly from the BEA) and core CPI (from the BLS).
 Click on graph for larger image.
This graph shows the year-over-year change for these four key measures of inflation. On a year-over-year basis, the median CPI rose 2.3%, the trimmed-mean CPI rose 2.1%, and the CPI less food and energy rose 1.6%. Core PCE is for October and increased 1.4% year-over-year.
The Fed is projecting core PCE inflation will increase to 1.7% to 1.8% by Q4 2021.
We will likely see some year-over-year jumps in some measures of inflation, since we saw some deflation in 2020. For example, we saw negative Month-to-month (MoM) core CPI and CPI readings in March, April and May. Assuming positive readings in those months in 2021, the YoY change in CPI and core CPI will jump.
We also saw negative MoM PCE and core PCE reading in March and April. IMPORTANT: Ignore a jump in YoY inflation in March, April and May!
My guess is core PCE inflation (year-over-year) will increase in 2021 (from the current 1.4%), but I think too much inflation will NOT be a concern in 2021.
Here are the Ten Economic Questions for 2021 and a few predictions:
• Question #1 for 2021: How much will the economy grow in 2021?
• Question #2 for 2021: Will all the jobs lost in 2020 return in 2021, or will job growth be sluggish?
• Question #3 for 2021: What will the unemployment rate be in December 2021?
• Question #4 for 2021: Will the overall participation rate increase to pre-pandemic levels (63.4% in February 2020) , or will it will only partially recover in 2021?
• Question #5 for 2021: Will the core inflation rate increase in 2021? Will too much inflation be a concern in 2021?
• Question #6 for 2021: Will the Fed raise rates in 2021? What about the asset purchase program?
• Question #7 for 2021: How much will RI increase in 2021? How about housing starts and new home sales in 2021?
• Question #8 for 2021: What will happen with house prices in 2021?
• Question #9 for 2021: Will inventory increase as the pandemic subsides, or will inventory decrease further in 2021?
• Question #10 for 2021: How much damage did the pandemic do to certain sectors?
Hotels: Occupancy Rate Declined 33.0% Year-over-year, 2020 Worst Year on Record
by Calculated Risk on 12/31/2020 09:57:00 AM
This is the end of the worst year on record for hotel occupancy. The average weekly occupancy rate was 44.2%, far below the occupancy rate for the previous worst year of 55.0% in 2009. The normal annual average weekly occupancy rate is around 63%.
U.S. weekly hotel occupancy fell to its lowest level since early May, according to STR‘s latest data for the week of Christmas.The following graph shows the seasonal pattern for the hotel occupancy rate using the four week average.
20-26 December 2020 (percentage change from comparable week in 2019):
• Occupancy: 32.5% (-33.0%)
• Average daily rate (ADR): US$92.08 (-28.8%)
• Revenue per available room (RevPAR): US$29.94 (-52.3%)
emphasis added
 Click on graph for larger image.
The red line is for 2020, dash light blue is 2019, blue is the median, and black is for 2009 (the worst year since the Great Depression for hotels - before 2020).
Seasonally we'd expect the occupancy rate to decline into the new year, and then, usually, business travel would start to pick up in the new year.
Note: Y-axis doesn't start at zero to better show the seasonal change.
Since there is a seasonal pattern to the occupancy rate - see graph above - we can track the year-over-year change in occupancy to look for any improvement. This table shows the year-over-year change since the week ending Sept 19, 2020:
This suggests no improvement over the last several months.
| Week Ending | YoY Change, Occupancy Rate |
|---|---|
| 9/19 | -31.9% |
| 9/26 | -31.5% |
| 10/3 | -29.6% |
| 10/10 | -29.2% |
| 10/17 | -30.7% |
| 10/24 | -31.7% |
| 10/31 | -29.0% |
| 11/7 | -35.9% |
| 11/14 | -32.7% |
| 11/21 | -32.6% |
| 11/28 | -28.5% |
| 12/5 | -37.9% |
| 12/12 | -37.4% |
| 12/19 | -26.4% |
| 12/26 | -33.0% |
Weekly Initial Unemployment Claims decreased to 787,000
by Calculated Risk on 12/31/2020 08:37:00 AM
The DOL reported:
In the week ending December 26, the advance figure for seasonally adjusted initial claims was 787,000, a decrease of 19,000 from the previous week's revised level. The previous week's level was revised up by 3,000 from 803,000 to 806,000. The 4-week moving average was 836,750, an increase of 17,750 from the previous week's revised average. The previous week's average was revised up by 750 from 818,250 to 819,000.This does not include the 308,262 initial claims for Pandemic Unemployment Assistance (PUA) that was down from 396,948 the previous week.
emphasis added
The following graph shows the 4-week moving average of weekly claims since 1971.
 Click on graph for larger image.
The dashed line on the graph is the current 4-week average. The four-week average of weekly unemployment claims increased to 836,750.
The previous week was revised up.
The second graph shows seasonally adjust continued claims since 1967 (lags initial by one week).
 At the worst of the Great Recession, continued claims peaked at 6.635 million, but then steadily declined.
Continued claims decreased to 5,393,440 (SA) from 5,457,941 (SA) last week and will likely stay at a high level until the crisis abates.
Note: There are an additional 8,459,647 receiving Pandemic Unemployment Assistance (PUA) that decreased from 9,271,112 the previous week (there are questions about these numbers). This is a special program for business owners, self-employed, independent contractors or gig workers not receiving other unemployment insurance.
An additional 4,772,853 are receiving Pandemic Emergency Unemployment Compensation (PEUC) that decreased from 4,793,230 the previous week.
This was close to expectations.
Wednesday, December 30, 2020
December 30 COVID-19 Test Results; Record Hospitalizations
by Calculated Risk on 12/30/2020 07:17:00 PM
Note: Expect a dip in the data over the holidays. The week-over-week growth in positive cases has slowed. Hopefully that continues after the holidays.
The US is now averaging close to 2 million tests per day. Based on the experience of other countries, for adequate test-and-trace (and isolation) to reduce infections, the percent positive needs to be under 5% (probably close to 1%), so the US has far too many daily cases - and percent positive - to do effective test-and-trace.
There were 1,559,541 test results reported over the last 24 hours.
There were 224,638 positive tests.
Almost 74,000 US deaths have been reported so far in December, far surpassing April as the deadliest month. See the graph on US Daily Deaths here.
 Click on graph for larger image.
This data is from the COVID Tracking Project.
The percent positive over the last 24 hours was 14.4% (red line is 7 day average). The percent positive is calculated by dividing positive results by total tests (including pending).
And check out COVID Act Now to see how each state is doing. (updated link to new site)
 The second graph shows the 7 day average of positive tests reported and daily hospitalizations.
• Record Hospitalizations
Fannie Mae: Mortgage Serious Delinquency Rate Decreased in November
by Calculated Risk on 12/30/2020 05:25:00 PM
Fannie Mae reported that the Single-Family Serious Delinquency decreased to 2.96% in November, from 3.05% in October. The serious delinquency rate is up from 0.66% in November 2019.
These are mortgage loans that are "three monthly payments or more past due or in foreclosure".
The Fannie Mae serious delinquency rate peaked in February 2010 at 5.59%.
 Click on graph for larger image
By vintage, for loans made in 2004 or earlier (2% of portfolio), 5.87% are seriously delinquent (up from 5.82% in October). For loans made in 2005 through 2008 (3% of portfolio), 10.00% are seriously delinquent (up from 9.84%), For recent loans, originated in 2009 through 2018 (95% of portfolio), 2.48% are seriously delinquent (down from 2.57%). So Fannie is still working through a few poor performing loans from the bubble years.
Mortgages in forbearance are counted as delinquent in this monthly report, but they will not be reported to the credit bureaus.
This is very different from the increase in delinquencies following the housing bubble. Lending standards have been fairly solid over the last decade, and most of these homeowners have equity in their homes - and they will be able to restructure their loans once they are employed.
Note: Freddie Mac reported earlier.
Question #6 for 2021: Will the Fed raise rates in 2021? What about the asset purchase program?
by Calculated Risk on 12/30/2020 12:51:00 PM
Earlier I posted some questions for next year: Ten Economic Questions for 2021. I'm adding some thoughts, and maybe some predictions for each question.
6) Monetary Policy: The Fed cut rates to zero in 2020 in response to the pandemic, and has signaled they will be on hold for some time. Will the Fed raise rates in 2021? Will the Fed end - or taper - the asset purchase program?
In March, in response to the pandemic, the Fed cut rates to essentially zero:
"Effective March 23, 2020, the Federal Open Market Committee directs the Desk to undertake open market operations as necessary to maintain the federal funds rate in a target range of 0 to 1/4 percent."In addition, the Fed has been buying assets, from the December statement:
"the Federal Reserve will continue to increase its holdings of Treasury securities by at least $80 billion per month and of agency mortgage-backed securities by at least $40 billion per month until substantial further progress has been made toward the Committee's maximum employment and price stability goals."An important point: The Fed will look through any blip in inflation in 2021 (there will be some weird distortions in the numbers).
emphasis added
As of December, looking at the "dot plot", the FOMC participants see the following number of rate hikes in 2021 and 2022:
Clearly the main view of the FOMC is no change in policy in 2021.
Here are the Ten Economic Questions for 2021 and a few predictions:
• Question #1 for 2021: How much will the economy grow in 2021?
• Question #2 for 2021: Will all the jobs lost in 2020 return in 2021, or will job growth be sluggish?
• Question #3 for 2021: What will the unemployment rate be in December 2021?
• Question #4 for 2021: Will the overall participation rate increase to pre-pandemic levels (63.4% in February 2020) , or will it will only partially recover in 2021?
• Question #5 for 2021: Will the core inflation rate increase in 2021? Will too much inflation be a concern in 2021?
• Question #6 for 2021: Will the Fed raise rates in 2021? What about the asset purchase program?
• Question #7 for 2021: How much will RI increase in 2021? How about housing starts and new home sales in 2021?
• Question #8 for 2021: What will happen with house prices in 2021?
• Question #9 for 2021: Will inventory increase as the pandemic subsides, or will inventory decrease further in 2021?
• Question #10 for 2021: How much damage did the pandemic do to certain sectors?
| FOMC Members 2021 | FOMC Members 2022 | |
|---|---|---|
| No Change | 17 | 16 |
| One Rate Hike | 0 | 1 |
Clearly the main view of the FOMC is no change in policy in 2021.
As far as asset purchases, from Professor Tim Duy: Four Points to Know About the FOMC Meeting
the Fed explicitly intends to hold the size of purchase at or above the current pace until the Fed achieves clear further progress toward its economic objective. Note though that “further progress” is not complete progress. The Fed will pull back on the asset purchase program before raising interest rates. When and under what conditions? Powell declined to answer that question but did promise there would be advance notice. Look for that notice to begin next year if the economy looks to rebound strongly as expected by mid-2021.There will be no rate hike in 2021, and since I'm assuming the pandemic will subside by mid-year 2021, it seems likely the Fed will taper asset purchases sometime in the second half of 2021.
Here are the Ten Economic Questions for 2021 and a few predictions:
• Question #1 for 2021: How much will the economy grow in 2021?
• Question #2 for 2021: Will all the jobs lost in 2020 return in 2021, or will job growth be sluggish?
• Question #3 for 2021: What will the unemployment rate be in December 2021?
• Question #4 for 2021: Will the overall participation rate increase to pre-pandemic levels (63.4% in February 2020) , or will it will only partially recover in 2021?
• Question #5 for 2021: Will the core inflation rate increase in 2021? Will too much inflation be a concern in 2021?
• Question #6 for 2021: Will the Fed raise rates in 2021? What about the asset purchase program?
• Question #7 for 2021: How much will RI increase in 2021? How about housing starts and new home sales in 2021?
• Question #8 for 2021: What will happen with house prices in 2021?
• Question #9 for 2021: Will inventory increase as the pandemic subsides, or will inventory decrease further in 2021?
• Question #10 for 2021: How much damage did the pandemic do to certain sectors?
Question #7 for 2021: How much will RI increase in 2021? How about housing starts and new home sales in 2021?
by Calculated Risk on 12/30/2020 11:41:00 AM
Earlier I posted some questions for next year: Ten Economic Questions for 2021. I'm adding some thoughts, and maybe some predictions for each question.
7) Residential Investment: Residential investment (RI) was solid in 2020, and housing was a strong sector during the pandemic. Through November, starts were up 7.0% year-over-year compared to the same period in 2019. New home sales were up 19.1% year--to-date through November. Note: RI is mostly investment in new single family structures, multifamily structures, home improvement and commissions on existing home sales. How much will RI increase in 2021? How about housing starts and new home sales in 2021?
First a graph of RI as a percent of Gross Domestic Product (GDP) through Q3 2020:
 Click on graph for larger image.
Residential investment (RI) increased at a 59.3% annual rate in Q3. And RI, as percent of GDP, increased sharply in Q3.
We don't have the data yet for Q4 2020 yet, but it appears RI will make a strong contribution to GDP in 2020.
Note that RI as a percent of GDP is still fairly low and not far above the lows of previous recessions.
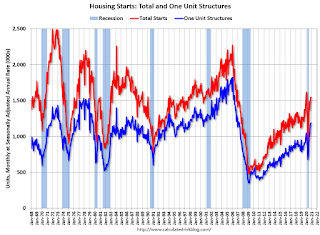 The second graph shows total and single family housing starts through November 2020.
Starts, year-to-date, are up 7.0% compared to the same period in 2019. Note that starts were up solidly prior to the pandemic, and then bounced back strong.
Even after the significant increase over the last several years, and the solid increase in 2020, the approximately 1.38 million housing starts in 2020 will still be the 34th highest on an annual basis since the Census Bureau started tracking starts in 1959 (34 out of 62 total years - middle of the pack).
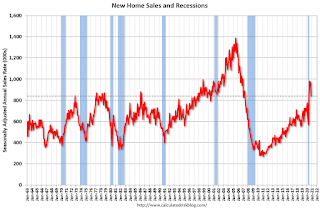 The third graph shows New Home Sales since 1963 through November 2020. The dashed line is the November sales rate.
New home sales in 2020, through November, were up 19.1% compared to the same period in 2019. This will be the strongest year for new home sales since 2006.
Clearly low mortgages rates, low existing home supply, and low sales in March and April (due to the pandemic) have led to a strong increase in sales. Favorable demographics and a surging stock market have probably helped new home sales too.
Here is a table showing housing starts and new home sales since 2005. No one should expect an increase to 2005 levels, however demographics and household formation suggest starts will increase further this cycle.
Most analysts are looking for starts and new home sales to increase further in 2021. For example, Fannie Mae expects new home sales to increase to 872 thousand, and the MBA is forecasting 960 thousand in 2021.
Here is a table showing housing starts and new home sales since 2005. No one should expect an increase to 2005 levels, however demographics and household formation suggest starts will increase further this cycle.
| Housing Starts and New Home Sales (000s) | ||||
|---|---|---|---|---|
| Housing Starts | Change | New Home Sales | Change | |
| 2005 | 2,068 | --- | 1,283 | --- |
| 2006 | 1,801 | -12.9% | 1,051 | -18.1% |
| 2007 | 1,355 | -24.8% | 776 | -26.2% |
| 2008 | 906 | -33.2% | 485 | -37.5% |
| 2009 | 554 | -38.8% | 375 | -22.7% |
| 2010 | 587 | 5.9% | 323 | -13.9% |
| 2011 | 609 | 3.7% | 306 | -5.3% |
| 2012 | 781 | 28.2% | 368 | 20.3% |
| 2013 | 925 | 18.5% | 429 | 16.6% |
| 2014 | 1,003 | 8.5% | 437 | 1.9% |
| 2015 | 1,112 | 10.8% | 501 | 14.6% |
| 2016 | 1,174 | 5.6% | 561 | 12.0% |
| 2017 | 1,203 | 2.5% | 613 | 9.3% |
| 2018 | 1,249 | 3.9% | 617 | 0.7% |
| 2019 | 1,290 | 3.2% | 683 | 10.7% |
| 20201 | 1,380 | 7.0% | 810 | 18.6% |
| 12020 estimated | ||||
Most analysts are looking for starts and new home sales to increase further in 2021. For example, Fannie Mae expects new home sales to increase to 872 thousand, and the MBA is forecasting 960 thousand in 2021.
And for housing starts, Fannie Mae is forecasting 1.44 million, and Merrill Lynch is forecasting 1.50 million.
Note that New Home sales have averaged 941 thousand over the last five months on seasonally adjust annual rate (SAAR) basis. So most forecasts are for sales to be relatively flat relative to the last five months.
Note that New Home sales have averaged 941 thousand over the last five months on seasonally adjust annual rate (SAAR) basis. So most forecasts are for sales to be relatively flat relative to the last five months.
And housing starts have averaged 1.47 million over the same period. So once again, analysts are expecting starts to be at about the same level in 2021 as the last 5 months.
My guess is starts will be up year-over-year in 2021 by high single digits. However, my guess is new home sales will soften in the second half of 2021 (based on my expectation of more existing home inventory), and will be up mid single digits (a decline from the sales rate over the last 5 months). It is even possible that sales will be flat to slightly down in 2021, but that will depend on inventory and the course of the pandemic.
Here are the Ten Economic Questions for 2021 and a few predictions:
• Question #1 for 2021: How much will the economy grow in 2021?
• Question #2 for 2021: Will all the jobs lost in 2020 return in 2021, or will job growth be sluggish?
• Question #3 for 2021: What will the unemployment rate be in December 2021?
• Question #4 for 2021: Will the overall participation rate increase to pre-pandemic levels (63.4% in February 2020) , or will it will only partially recover in 2021?
• Question #5 for 2021: Will the core inflation rate increase in 2021? Will too much inflation be a concern in 2021?
• Question #6 for 2021: Will the Fed raise rates in 2021? What about the asset purchase program?
• Question #7 for 2021: How much will RI increase in 2021? How about housing starts and new home sales in 2021?
• Question #8 for 2021: What will happen with house prices in 2021?
• Question #9 for 2021: Will inventory increase as the pandemic subsides, or will inventory decrease further in 2021?
• Question #10 for 2021: How much damage did the pandemic do to certain sectors?
NAR: Pending Home Sales Decrease 2.6% in November
by Calculated Risk on 12/30/2020 10:03:00 AM
From the NAR: Pending Home Sales Slide 2.6% in November
Pending home sales declined in November, according to the National Association of Realtors®. Month-over-month contract activity fell in each of the four major U.S. regions. However, compared to a year ago, all four areas achieved gains in pending home sales transactions.This was below expectations for this index. Note: Contract signings usually lead sales by about 45 to 60 days, so this would usually be for closed sales in December and January.
The Pending Home Sales Index (PHSI), a forward-looking indicator of home sales based on contract signings, fell 2.6% to 125.7 in November, the third straight month of decline. Year-over-year, contract signings climbed 16.4%. An index of 100 is equal to the level of contract activity in 2001.
...
The Northeast PHSI slid 3.3% to 108.6 in November, a 15.3% increase from a year ago. In the Midwest, the index fell 3.1% to 115.9 last month, up 14.1% from November 2019.
Pending home sales in the South decreased 1.1% to an index of 150.0 in November, up 21.3% from November 2019. The index in the West fell 4.7% in November to 111.3, which is up 10.4% from a year ago.
emphasis added
Tuesday, December 29, 2020
Wednesday: Pending Home Sales
by Calculated Risk on 12/29/2020 09:15:00 PM
Wednesday:
• At 9:45 AM ET, Chicago Purchasing Managers Index for December.
• At 10:00 AM, Pending Home Sales Index for November. The consensus is for a 0.2% increase in the index.
December 29 COVID-19 Test Results; Record Hospitalizations
by Calculated Risk on 12/29/2020 07:12:00 PM
Note: Expect a dip in the data over the holidays. The week-over-week growth in positive cases has slowed. Hopefully that continues after the holidays.
The US is now averaging close to 2 million tests per day. Based on the experience of other countries, for adequate test-and-trace (and isolation) to reduce infections, the percent positive needs to be under 5% (probably close to 1%), so the US has far too many daily cases - and percent positive - to do effective test-and-trace.
There were 1,236,471 test results reported over the last 24 hours.
There were 194,512 positive tests.
Almost 70,000 US deaths have been reported so far in December, far surpassing April as the deadliest month. See the graph on US Daily Deaths here.
 Click on graph for larger image.
This data is from the COVID Tracking Project.
The percent positive over the last 24 hours was 15.7% (red line is 7 day average). The percent positive is calculated by dividing positive results by total tests (including pending).
And check out COVID Act Now to see how each state is doing. (updated link to new site)
 The second graph shows the 7 day average of positive tests reported and daily hospitalizations.
• Record Hospitalizations
Zillow Case-Shiller House Price Forecast: "Nothing Short of Remarkable", 9.5% YoY in November
by Calculated Risk on 12/29/2020 02:55:00 PM
The Case-Shiller house price indexes for October were released today. Zillow forecasts Case-Shiller a month early, and I like to check the Zillow forecasts since they have been pretty close.
From Matthew Speakman at Zillow: October Case-Shiller Results & November Forecast: Nothing Short of Remarkable
The path of home prices in recent months has been nothing short of remarkable. In many places across the country, and in the nation overall, home prices are growing by some measures at their fastest pace in decades. Record low mortgage rates, a wave of households aging into homeownership and a limited number of homes for sale all combined to stoke competition for houses and placed consistent upward pressure on prices for the better part of the last calendar year. These factors appear likely to remain in place in the near term, and an incrementally improving economy should encourage more buyers to enter the market. Taken together, this torrid pace of home price appreciation appears primed to continue well into 2021.
...
Monthly growth in November as reported by Case-Shiller is expected to slow slightly from October in all three main indices, while annual growth is expected to accelerate across the board. S&P Dow Jones Indices is expected to release data for the November S&P CoreLogic Case-Shiller Indices on Tuesday, January 26.
emphasis added
 The Zillow forecast is for the year-over-year change for the Case-Shiller National index to be at 9.5% in November, up from 8.4% in October.
 The Zillow forecast is for the 20-City index to be up 8.9% YoY in November from 7.9% in October, and for the 10-City index to increase to be up 8.4% YoY compared to 7.5% YoY in October.
Real House Prices and Price-to-Rent Ratio in October
by Calculated Risk on 12/29/2020 12:05:00 PM
Here is the post earlier on Case-Shiller: Case-Shiller: National House Price Index increased 8.4% year-over-year in October
It has been over fourteen years since the bubble peak. In the Case-Shiller release today, the seasonally adjusted National Index (SA), was reported as being 24.3% above the previous bubble peak. However, in real terms, the National index (SA) is still about at the bubble peak (and historically there has been an upward slope to real house prices). The composite 20, in real terms, is still 8% below the bubble peak.
The year-over-year growth in prices increased to 8.4% nationally.
Usually people graph nominal house prices, but it is also important to look at prices in real terms (inflation adjusted). Case-Shiller and others report nominal house prices. As an example, if a house price was $200,000 in January 2000, the price would be close to $291,000 today adjusted for inflation (45%). That is why the second graph below is important - this shows "real" prices (adjusted for inflation).
Nominal House Prices
 The first graph shows the monthly Case-Shiller National Index SA, and the monthly Case-Shiller Composite 20 SA (through September) in nominal terms as reported.
In nominal terms, the Case-Shiller National index (SA) and the Case-Shiller Composite 20 Index (SA) are both at new all times highs (above the bubble peak).
Real House Prices
 The second graph shows the same two indexes in real terms (adjusted for inflation using CPI less Shelter). Note: some people use other inflation measures to adjust for real prices.
In real terms, the National index is back to the bubble peak, and the Composite 20 index is back to early 2005.
In real terms, house prices are at 2005 levels.
Note that inflation was negative for a few months earlier this year, and that boosted real prices.
Price-to-Rent
In October 2004, Fed economist John Krainer and researcher Chishen Wei wrote a Fed letter on price to rent ratios: House Prices and Fundamental Value. Kainer and Wei presented a price-to-rent ratio using the OFHEO house price index and the Owners' Equivalent Rent (OER) from the BLS.
 Here is a similar graph using the Case-Shiller National and Composite 20 House Price Indexes.
This graph shows the price to rent ratio (January 2000 = 1.0). The price-to-rent ratio had been moving mostly sideways, but picked up recently.
On a price-to-rent basis, the Case-Shiller National index is back to September 2004 levels, and the Composite 20 index is back to March 2004 levels.
In real terms, prices are back to 2005 levels, and the price-to-rent ratio is back to 2004.
Question #8 for 2021: What will happen with house prices in 2021?
by Calculated Risk on 12/29/2020 11:13:00 AM
Earlier I posted some questions for next year: Ten Economic Questions for 2021. I'm adding some thoughts, and maybe some predictions for each question.
8) House Prices: It appears house prices - as measured by the national repeat sales index (Case-Shiller, CoreLogic) - will be up around 8% to 9% in 2020. What will happen with house prices in 2021?
The following graph shows the year-over-year change through October 2020, in the seasonally adjusted Case-Shiller Composite 10, Composite 20 and National indices (the Composite 20 was started in January 2000).
 Click on graph for larger image.
The Composite 10 SA is up 7.5% compared to October 2019. The Composite 20 SA is up 7.9% year-over-year.
The National index SA is up 8.4% year-over-year. Other house price indexes have indicated similar gains (see table below).
The YoY price increases in 2020 were the strongest since 2013.
Although I mostly use Case-Shiller, I also follow several other price indexes. The following table shows the year-over-year change for several house prices indexes.
| Year-over-year Change for Various House Price Indexes | ||
|---|---|---|
| Index | Through | Increase |
| Case-Shiller Comp 20 | October | 7.9% |
| Case-Shiller National | October | 8.4% |
| CoreLogic | October | 7.3% |
| FHFA House Price Index | October | 10.2% |
There are a wide range of price forecasts for 2021, from around 2% YoY growth to as much as 10%.
Here was Zillow's comment today on Case-Shiller:
"Record low mortgage rates, a wave of households aging into homeownership and a limited number of homes for sale all combined to stoke competition for houses and placed consistent upward pressure on prices for the better part of the last calendar year. These factors appear likely to remain in place in the near term, and an incrementally improving economy should encourage more buyers to enter the market. Taken together, this torrid pace of home price appreciation appears primed to continue well into 2021."Inventories will probably increase, especially in the 2nd half of 2021, but will most likely still be somewhat low historically. Also, prices tend to have momentum, so unless mortgage rates increase sharply (unlikely) or inventories rise quicker than expected, we should expect further price increases in 2021. Watching inventory will be important to adjust this forecast!
My guess (based on my inventory forecast and a recovering economy) is that year-over-year price increases will probably be the strongest early in the year, and then soften somewhat towards the end of 2021. It seems likely that price appreciation will decrease from the 2020 pace, but still be in the mid-single digit range in 2021.
Here are the Ten Economic Questions for 2021 and a few predictions:
• Question #1 for 2021: How much will the economy grow in 2021?
• Question #2 for 2021: Will all the jobs lost in 2020 return in 2021, or will job growth be sluggish?
• Question #3 for 2021: What will the unemployment rate be in December 2021?
• Question #4 for 2021: Will the overall participation rate increase to pre-pandemic levels (63.4% in February 2020) , or will it will only partially recover in 2021?
• Question #5 for 2021: Will the core inflation rate increase in 2021? Will too much inflation be a concern in 2021?
• Question #6 for 2021: Will the Fed raise rates in 2021? What about the asset purchase program?
• Question #7 for 2021: How much will RI increase in 2021? How about housing starts and new home sales in 2021?
• Question #8 for 2021: What will happen with house prices in 2021?
• Question #9 for 2021: Will inventory increase as the pandemic subsides, or will inventory decrease further in 2021?
• Question #10 for 2021: How much damage did the pandemic do to certain sectors?
Case-Shiller: National House Price Index increased 8.4% year-over-year in October
by Calculated Risk on 12/29/2020 09:12:00 AM
S&P/Case-Shiller released the monthly Home Price Indices for October ("October" is a 3 month average of August, September and October prices).
This release includes prices for 20 individual cities, two composite indices (for 10 cities and 20 cities) and the monthly National index.
From S&P: S&P CoreLogic Case-Shiller Index Shows Annual Home Price Gains Soared to 7% in September
The S&P CoreLogic Case-Shiller U.S. National Home Price NSA Index, covering all nine U.S. census divisions, reported an 8.4% annual gain in October, up from 7.0% in the previous month. The 10-City Composite annual increase came in at 7.5%, up from 6.2% in the previous month. The 20-City Composite posted a 7.9% year-over-year gain, up from 6.6% in the previous month.
Phoenix, Seattle and San Diego continued to report the highest year-over-year gains among the 19 cities (excluding Detroit) in October. Phoenix led the way with a 12.7% year-over-year price increase, followed by Seattle with an 11.7% increase and San Diego with an 11.6% increase. All 19 cities reported higher price increases in the year ending October 2020 versus the year ending September 2020.
...
The National Index posted a 1.4% month-over-month increase, while the 10-City and 20-City Composites both posted increases of 1.4% and 1.3% respectively, before seasonal adjustment in October. After seasonal adjustment, the National Index posted a month-over-month increase of 1.7%, while the 10-City and 20-City Composites both posted increases of 1.6%. In October, all 19 cities (excluding Detroit) reported increases before and after seasonal adjustment.
“The surprising strength we noted in last month’s report continued into October’s home price data,” says Craig J. Lazzara, Managing Director and Global Head of Index Investment Strategy at S&P Dow Jones Indices. “The National Composite Index gained 8.4% relative to its level a year ago, accelerating from September’s 7.0% increase. The 10- and 20-City Composites (up 7.5% and 7.9%, respectively) also rose more rapidly in October than they had done in September. The housing market’s strength was once again broadly-based: all 19 cities for which we have October data rose, and all 19 gained more in the 12 months ended in October than they had gained in the 12 months ended in September.
“We’ve noted before that a trend of accelerating increases in the National Composite Index began in August 2019 but was interrupted in May and June, as COVID-related restrictions produced modestlydecelerating price gains. Since June, our monthly readings have shown accelerating growth in home prices, and October’s results emphatically emphasize that trend. The last time that the National Composite matched this month’s 8.4% growth rate was more than six and a half years ago, in March 2014. Although the full history of the pandemic’s impact on housing prices is yet to be written, the data from the last several months are consistent with the view that COVID has encouraged potential buyers to move from urban apartments to suburban homes. We’ll continue to monitor what the data can tell us about this question
emphasis added
 Click on graph for larger image.
 The first graph shows the nominal seasonally adjusted Composite 10, Composite 20 and National indices (the Composite 20 was started in January 2000).
The Composite 10 index is up 1.6% in October (SA) from September.
The Composite 20 index is up 1.6% (SA) in October.
The National index is 24.3% above the bubble peak (SA), and up 1.7% (SA) in October. The National index is up 68% from the post-bubble low set in December 2011 (SA).
The second graph shows the Year over year change in all three indices.The Composite 10 SA is up 7.5% compared to October 2019. The Composite 20 SA is up 7.9% year-over-year.
The National index SA is up 8.4% year-over-year.
Note: According to the data, prices increased in 19 cities month-over-month seasonally adjusted.
Price increases were above expectations. I'll have more later.
Monday, December 28, 2020
Tuesday: Case-Shiller House Prices
by Calculated Risk on 12/28/2020 09:11:00 PM
From Matthew Graham at Mortgage News Daily: MBS RECAP: Uneventful Day Despite Covid Relief Bill
The big news at the end of last week was Trump's decision to veto the covid relief/spending bill. After he signed it last night, overnight markets began pointing toward higher rates. 10yr yields were roughly 3bps higher to start the day, but it was all downhill from there (in a good way). MBS led the charge early. Treasuries ultimately broke even ... [30 Year Mortgage Rate for Top Tier Scenarios: 2.79%].Tuesday:
emphasis added
• At 9:00 AM ET, S&P/Case-Shiller House Price Index for October. The consensus is for a 7.2% year-over-year increase in the National index for October. Note that Zillow is forecasting Case-Shiller will report a 7.7% YoY increase in the National index.
December 28 COVID-19 Test Results; Record Hospitalizations
by Calculated Risk on 12/28/2020 07:02:00 PM
Note: Expect a dip in the data over the holidays. The week-over-week growth in positive cases has slowed. Hopefully that continues after the holidays.
The US is now averaging close to 2 million tests per day. Based on the experience of other countries, for adequate test-and-trace (and isolation) to reduce infections, the percent positive needs to be under 5% (probably close to 1%), so the US has far too many daily cases - and percent positive - to do effective test-and-trace.
There were 1,540,320 test results reported over the last 24 hours.
There were 162,190 positive tests.
Almost 67,000 US deaths have been reported so far in December, surpassing April as the deadliest month. See the graph on US Daily Deaths here.
 Click on graph for larger image.
This data is from the COVID Tracking Project.
The percent positive over the last 24 hours was 10.5% (red line is 7 day average). The percent positive is calculated by dividing positive results by total tests (including pending).
And check out COVID Act Now to see how each state is doing. (updated link to new site)
 The second graph shows the 7 day average of positive tests reported and daily hospitalizations.
• Record Hospitalizations
Question #9 for 2021: Will inventory increase as the pandemic subsides, or will inventory decrease further in 2021?
by Calculated Risk on 12/28/2020 02:14:00 PM
Earlier I posted some questions for next year: Ten Economic Questions for 2021. I'm adding some thoughts, and maybe some predictions for each question.
9) Housing Inventory: Housing inventory decreased sharply in 2020 to record lows. Will inventory increase as the pandemic subsides, or will inventory decrease further in 2021?
This might be one of the most important housing questions for 2021!
Tracking housing inventory is very helpful in understanding the housing market. The plunge in inventory in 2011 (blue arrow on first graph below) helped me call the bottom for house prices in early 2012 (The Housing Bottom is Here). And the increase in inventory in late 2005 (see red arrow) helped me call the top for house prices in 2006.
Back in 2019, when several commentators were bearish on housing, I pointed out there was no sharp increase in housing inventory (like in 2005), and that was one of the reasons I remained optimistic on housing and the economy (correctly!).
And the sharp decline in inventory during the pandemic (black arrow) was an indicator that price appreciation would increase - and that housing starts would pick up.
This graph shows nationwide inventory for existing homes through November 2020.
 Click on graph for larger image.
According to the NAR, inventory decreased to 1.28 million in November from 1.42 million in October. And inventory in November was down from 1.64 million in November 2019.
Note that inventory was already pretty low in 2017, 2018 and 2019. Prior to 2020, two of the key reasons inventory was low:
1) A large number of single family home and condos were converted to rental units. In 2015, housing economist Tom Lawler estimated there were 17.5 million renter occupied single family homes in the U.S., up from 10.7 million in 2000. Many of these houses were purchased by investors. Most of these rental conversions were at the lower end, and that limited the supply for first time buyers.
2) Baby boomers are aging in place (people tend to downsize when they are 75 or 80). The leading edge of the boomers are now turning 76 or so, and the boomers selling will probably gradually increase over the next 10 years.
Inventory is not seasonally adjusted, and usually inventory decreases from the seasonal high in mid-summer to the seasonal lows in December and January as sellers take their homes off the market for the holidays.
 The second graph shows the year-over-year (YoY) change in reported existing home inventory and months-of-supply. Note: Months-of-supply is based on the seasonally adjusted sales and not seasonally adjusted inventory.
Inventory was down 22% year-over-year in November compared to November 2019. Months of supply decreased to 2.3 months in November (an all time low).
In 2020, inventory really declined due to a combination of potential sellers keeping their properties off the market during a pandemic, and a pickup in buying due to record low mortgage rates, a move away from multi-family rentals and strong second home buying (to escape the high-density cities).
And at the same time, demographics are now favorable for home buying (a large cohort has moved into the peak home buying years).
First, making the assumption that the pandemic will be mostly over by mid-2021, we can make a few general predictions:
1. Potential sellers will be more willing to list their homes in the Summer and the second half of 2021 (and allow strangers into their homes).
2. The move away from dense cities will slow and maybe end. What makes cities attractive (jobs, cultural events and other entertainment), hasn't been available during the pandemic. That will change when the pandemic ends, and cities will be attractive again. Of course, the trends toward remote working, online shopping and home entertainment will likely continue, and this will allow some people to live anywhere.
Here are the Ten Economic Questions for 2021 and a few predictions:
• Question #1 for 2021: How much will the economy grow in 2021?
• Question #2 for 2021: Will all the jobs lost in 2020 return in 2021, or will job growth be sluggish?
• Question #3 for 2021: What will the unemployment rate be in December 2021?
• Question #4 for 2021: Will the overall participation rate increase to pre-pandemic levels (63.4% in February 2020) , or will it will only partially recover in 2021?
• Question #5 for 2021: Will the core inflation rate increase in 2021? Will too much inflation be a concern in 2021?
• Question #6 for 2021: Will the Fed raise rates in 2021? What about the asset purchase program?
• Question #7 for 2021: How much will RI increase in 2021? How about housing starts and new home sales in 2021?
• Question #8 for 2021: What will happen with house prices in 2021?
• Question #9 for 2021: Will inventory increase as the pandemic subsides, or will inventory decrease further in 2021?
• Question #10 for 2021: How much damage did the pandemic do to certain sectors?
This graph shows nationwide inventory for existing homes through November 2020.
 Click on graph for larger image.
According to the NAR, inventory decreased to 1.28 million in November from 1.42 million in October. And inventory in November was down from 1.64 million in November 2019.
Note that inventory was already pretty low in 2017, 2018 and 2019. Prior to 2020, two of the key reasons inventory was low:
1) A large number of single family home and condos were converted to rental units. In 2015, housing economist Tom Lawler estimated there were 17.5 million renter occupied single family homes in the U.S., up from 10.7 million in 2000. Many of these houses were purchased by investors. Most of these rental conversions were at the lower end, and that limited the supply for first time buyers.
2) Baby boomers are aging in place (people tend to downsize when they are 75 or 80). The leading edge of the boomers are now turning 76 or so, and the boomers selling will probably gradually increase over the next 10 years.
Inventory is not seasonally adjusted, and usually inventory decreases from the seasonal high in mid-summer to the seasonal lows in December and January as sellers take their homes off the market for the holidays.
 The second graph shows the year-over-year (YoY) change in reported existing home inventory and months-of-supply. Note: Months-of-supply is based on the seasonally adjusted sales and not seasonally adjusted inventory.
Inventory was down 22% year-over-year in November compared to November 2019. Months of supply decreased to 2.3 months in November (an all time low).
In 2020, inventory really declined due to a combination of potential sellers keeping their properties off the market during a pandemic, and a pickup in buying due to record low mortgage rates, a move away from multi-family rentals and strong second home buying (to escape the high-density cities).
And at the same time, demographics are now favorable for home buying (a large cohort has moved into the peak home buying years).
First, making the assumption that the pandemic will be mostly over by mid-2021, we can make a few general predictions:
1. Potential sellers will be more willing to list their homes in the Summer and the second half of 2021 (and allow strangers into their homes).
2. The move away from dense cities will slow and maybe end. What makes cities attractive (jobs, cultural events and other entertainment), hasn't been available during the pandemic. That will change when the pandemic ends, and cities will be attractive again. Of course, the trends toward remote working, online shopping and home entertainment will likely continue, and this will allow some people to live anywhere.
3. Demographics will be favorable for home buying. The generation moving into the home buying years is much larger than the leading edge of the boomers that will be downsizing - or moving into retirement communities.
4. Mortgage rates are probably close to a bottom now, but it seems unlikely rates will increase quickly with the Fed will be holding down rates for the foreseeable future.
5. Homebuilders will continue to respond to low inventories, and housing starts will likely increase further in 2021.
The bottom line is inventory will probably increase, especially in the 2nd half of 2021 (with the assumption that the pandemic will be mostly over by mid-year) - maybe back up to the 2017 - 2019 levels. Inventory is always something to watch. For example, if inventory increases sharply, house price growth will slow.
Here are the Ten Economic Questions for 2021 and a few predictions:
• Question #1 for 2021: How much will the economy grow in 2021?
• Question #2 for 2021: Will all the jobs lost in 2020 return in 2021, or will job growth be sluggish?
• Question #3 for 2021: What will the unemployment rate be in December 2021?
• Question #4 for 2021: Will the overall participation rate increase to pre-pandemic levels (63.4% in February 2020) , or will it will only partially recover in 2021?
• Question #5 for 2021: Will the core inflation rate increase in 2021? Will too much inflation be a concern in 2021?
• Question #6 for 2021: Will the Fed raise rates in 2021? What about the asset purchase program?
• Question #7 for 2021: How much will RI increase in 2021? How about housing starts and new home sales in 2021?
• Question #8 for 2021: What will happen with house prices in 2021?
• Question #9 for 2021: Will inventory increase as the pandemic subsides, or will inventory decrease further in 2021?
• Question #10 for 2021: How much damage did the pandemic do to certain sectors?
Dallas Fed: "Texas Manufacturing Activity Expands at a Faster Pace" in December
by Calculated Risk on 12/28/2020 10:39:00 AM
From the Dallas Fed: Texas Manufacturing Activity Expands at a Faster Pace
Expansion in Texas factory activity picked up in December, according to business executives responding to the Texas Manufacturing Outlook Survey. The production index, a key measure of state manufacturing conditions, rebounded from 7.2 to 25.5, indicating an acceleration in output growth.This was the last of the regional Fed surveys for December.
Other measures of manufacturing activity also point to stronger growth this month. The new orders index pushed up 11 points to 17.8, and the growth rate of orders index rose from 9.7 to 16.5. The capacity utilization index moved up 11 points to 17.7, and the shipments index advanced from 13.7 to 21.9.
Perceptions of broader business conditions continued to improve in December. The general business activity index remained positive but edged down from 12.0 to 9.7. Meanwhile, the company outlook index pushed further into positive territory, rising from 11.0 to 16.8. Uncertainty regarding companies’ outlooks continued to rise; the index increased six points to 13.4.
Labor market measures indicated an increase in employment and work hours. The employment index increased from 11.7 to 19.6, suggesting a pickup in hiring.
emphasis added
Here is a graph comparing the regional Fed surveys and the ISM manufacturing index:
 Click on graph for larger image.
The New York and Philly Fed surveys are averaged together (yellow, through December), and five Fed surveys are averaged (blue, through December) including New York, Philly, Richmond, Dallas and Kansas City. The Institute for Supply Management (ISM) PMI (red) is through November (right axis).
The ISM manufacturing index for December will be released on Monday, January 4th. Based on these regional surveys, the ISM manufacturing index will likely decrease slightly in December from the November level.
Note that these are diffusion indexes, so readings above 0 (or 50 for the ISM) means activity is increasing (it does not mean that activity is back to pre-crisis levels).
Seven High Frequency Indicators for the Economy
by Calculated Risk on 12/28/2020 08:17:00 AM
These indicators are mostly for travel and entertainment. It will interesting to watch these sectors recover as the vaccine is distributed.
IMPORTANT: Be safe now - if all goes well, we could all be vaccinated by Q2 2021.
----- Airlines: Transportation Security Administration -----
The TSA is providing daily travel numbers.
 Click on graph for larger image.
This data shows the seven day average of daily total traveler throughput from the TSA for 2019 (Blue) and 2020 (Red).
The dashed line is the percent of last year for the seven day average.
This data is as of December 27th.
The seven day average is down 57.7% from last year (42.3% of last year). (Dashed line)
There has been a slow increase from the bottom, with ups and downs due to the Thanksgiving and Christmas holidays.
----- Restaurants: OpenTable -----
The second graph shows the 7 day average of the year-over-year change in diners as tabulated by OpenTable for the US and several selected cities.
 Thanks to OpenTable for providing this restaurant data:
This data is updated through December 26, 2020.
This data is "a sample of restaurants on the OpenTable network across all channels: online reservations, phone reservations, and walk-ins. For year-over-year comparisons by day, we compare to the same day of the week from the same week in the previous year."
Note that this data is for "only the restaurants that have chosen to reopen in a given market". Since some restaurants have not reopened, the actual year-over-year decline is worse than shown.
Note that dining is generally lower in the northern states - Illinois, Pennsylvania, and New York. Note that California dining is off sharply with the orders to close.
----- Movie Tickets: Box Office Mojo -----
 This data shows domestic box office for each week (red) and the maximum and minimum for the previous four years. Data is from BoxOfficeMojo through December 24h.
Note that the data is usually noisy week-to-week and depends on when blockbusters are released.
Movie ticket sales have picked up slightly over the last couple of months, but were at $10 million (compared to usually around $400 million per week at this time of year).
Some movie theaters have reopened (probably with limited seating).
----- Hotel Occupancy: STR -----
 This graph shows the seasonal pattern for the hotel occupancy rate using the four week average.
The red line is for 2020, dash light blue is 2019, blue is the median, and black is for 2009 (the worst year since the Great Depression for hotels - prior to 2020).
This data is through December 19th. Hotel occupancy is currently down 26.4% year-over-year.
Notes: Y-axis doesn't start at zero to better show the seasonal change.
Since there is a seasonal pattern to the occupancy rate, we can track the year-over-year change in occupancy to look for any improvement. This table shows the year-over-year change since the week ending Sept 19, 2020:
This suggests no improvement over the last three months.
----- Gasoline Supplied: Energy Information Administration -----
 This graph, based on weekly data from the U.S. Energy Information Administration (EIA), shows gasoline supplied compared to the same week last year of .
At one point, gasoline supplied was off almost 50% YoY.
As of December 18th, gasoline supplied was off about 13.8% YoY (about 86.2% of last year).
Note: People driving instead of flying might have boosted gasoline consumption over the summer.
----- Transit: Apple Mobility -----
This graph is from Apple mobility. From Apple: "This data is generated by counting the number of requests made to Apple Maps for directions in select countries/regions, sub-regions, and cities." This is just a general guide - people that regularly commute probably don't ask for directions.
There is also some great data on mobility from the Dallas Fed Mobility and Engagement Index. However the index is set "relative to its weekday-specific average over January–February", and is not seasonally adjusted, so we can't tell if an increase in mobility is due to recovery or just the normal increase in the Spring and Summer.
 This data is through December 26th for the United States and several selected cities.
The graph is the running 7 day average to remove the impact of weekends.
IMPORTANT: All data is relative to January 13, 2020. This data is NOT Seasonally Adjusted. People walk and drive more when the weather is nice, so I'm just using the transit data.
According to the Apple data directions requests, public transit in the 7 day average for the US is at 41% of the January level. It is at 28% in Chicago, and 49% in Houston - and mostly trending down over the last few months (this dips on holidays like Thanksgiving and Christmas).
----- New York City Subway Usage -----
Here is some interesting data on New York subway usage (HT BR).
 This graph is from Todd W Schneider. This is daily data for this year.
This data is through Friday, December 25th.
Schneider has graphs for each borough, and links to all the data sources.
He notes: "Data updates weekly from the MTA’s public turnstile data, usually on Saturday mornings".
The TSA is providing daily travel numbers.
 Click on graph for larger image.
This data shows the seven day average of daily total traveler throughput from the TSA for 2019 (Blue) and 2020 (Red).
The dashed line is the percent of last year for the seven day average.
This data is as of December 27th.
The seven day average is down 57.7% from last year (42.3% of last year). (Dashed line)
There has been a slow increase from the bottom, with ups and downs due to the Thanksgiving and Christmas holidays.
The second graph shows the 7 day average of the year-over-year change in diners as tabulated by OpenTable for the US and several selected cities.
 Thanks to OpenTable for providing this restaurant data:
This data is updated through December 26, 2020.
This data is "a sample of restaurants on the OpenTable network across all channels: online reservations, phone reservations, and walk-ins. For year-over-year comparisons by day, we compare to the same day of the week from the same week in the previous year."
Note that this data is for "only the restaurants that have chosen to reopen in a given market". Since some restaurants have not reopened, the actual year-over-year decline is worse than shown.
Note that dining is generally lower in the northern states - Illinois, Pennsylvania, and New York. Note that California dining is off sharply with the orders to close.
 This data shows domestic box office for each week (red) and the maximum and minimum for the previous four years. Data is from BoxOfficeMojo through December 24h.
Note that the data is usually noisy week-to-week and depends on when blockbusters are released.
Movie ticket sales have picked up slightly over the last couple of months, but were at $10 million (compared to usually around $400 million per week at this time of year).
Some movie theaters have reopened (probably with limited seating).
 This graph shows the seasonal pattern for the hotel occupancy rate using the four week average.
 The red line is for 2020, dash light blue is 2019, blue is the median, and black is for 2009 (the worst year since the Great Depression for hotels - prior to 2020).
This data is through December 19th. Hotel occupancy is currently down 26.4% year-over-year.
Notes: Y-axis doesn't start at zero to better show the seasonal change.
Since there is a seasonal pattern to the occupancy rate, we can track the year-over-year change in occupancy to look for any improvement. This table shows the year-over-year change since the week ending Sept 19, 2020:
| Week Ending | YoY Change, Occupancy Rate |
|---|---|
| 9/19 | -31.9% |
| 9/26 | -31.5% |
| 10/3 | -29.6% |
| 10/10 | -29.2% |
| 10/17 | -30.7% |
| 10/24 | -31.7% |
| 10/31 | -29.0% |
| 11/7 | -35.9% |
| 11/14 | -32.7% |
| 11/21 | -32.6% |
| 11/28 | -28.5% |
| 12/5 | -37.9% |
| 12/12 | -37.4% |
| 12/19 | -26.4% |
This suggests no improvement over the last three months.
 This graph, based on weekly data from the U.S. Energy Information Administration (EIA), shows gasoline supplied compared to the same week last year of .
At one point, gasoline supplied was off almost 50% YoY.
As of December 18th, gasoline supplied was off about 13.8% YoY (about 86.2% of last year).
Note: People driving instead of flying might have boosted gasoline consumption over the summer.
This graph is from Apple mobility. From Apple: "This data is generated by counting the number of requests made to Apple Maps for directions in select countries/regions, sub-regions, and cities." This is just a general guide - people that regularly commute probably don't ask for directions.
There is also some great data on mobility from the Dallas Fed Mobility and Engagement Index. However the index is set "relative to its weekday-specific average over January–February", and is not seasonally adjusted, so we can't tell if an increase in mobility is due to recovery or just the normal increase in the Spring and Summer.
 This data is through December 26th for the United States and several selected cities.
The graph is the running 7 day average to remove the impact of weekends.
IMPORTANT: All data is relative to January 13, 2020. This data is NOT Seasonally Adjusted. People walk and drive more when the weather is nice, so I'm just using the transit data.
According to the Apple data directions requests, public transit in the 7 day average for the US is at 41% of the January level. It is at 28% in Chicago, and 49% in Houston - and mostly trending down over the last few months (this dips on holidays like Thanksgiving and Christmas).
Here is some interesting data on New York subway usage (HT BR).
 This graph is from Todd W Schneider. This is daily data for this year.
This data is through Friday, December 25th.
Schneider has graphs for each borough, and links to all the data sources.
He notes: "Data updates weekly from the MTA’s public turnstile data, usually on Saturday mornings".
Sunday, December 27, 2020
Sunday Night Futures
by Calculated Risk on 12/27/2020 09:24:00 PM
Weekend:
• Schedule for Week of December 27, 2020
• Ten Economic Questions for 2021
• Question #10 for 2021: How much damage did the pandemic do to certain sectors?
Monday:
• At 10:30 AM ET, Dallas Fed Survey of Manufacturing Activity for December. This is the last of regional manufacturing surveys for December.
From CNBC: Pre-Market Data and Bloomberg futures S&P 500 futures are up 8 and DOW futures are up 55 (fair value).
Oil prices were down over the last week with WTI futures at $47.73 per barrel and Brent at $50.72 barrel. A year ago, WTI was at $62, and Brent was at $69 - so WTI oil prices are down over 20% year-over-year.
Here is a graph from Gasbuddy.com for nationwide gasoline prices. Nationally prices are at $2.25 per gallon. A year ago prices were at $2.57 per gallon, so gasoline prices are down $0.32 per gallon year-over-year.
December 27 COVID-19 Test Results; Expected dip in the data over the holidays
by Calculated Risk on 12/27/2020 07:04:00 PM
Note: Expect a dip in the data over the holidays. The week-over-week growth in positive cases has slowed. Hopefully that continues.
The US is now averaging close to 2 million tests per day. Based on the experience of other countries, for adequate test-and-trace (and isolation) to reduce infections, the percent positive needs to be under 5% (probably close to 1%), so the US has far too many daily cases - and percent positive - to do effective test-and-trace.
There were 1,373,305 test results reported over the last 24 hours.
There were 152,461 positive tests.
Over 65,000 US deaths have been reported so far in December, surpassing April as the deadliest month. See the graph on US Daily Deaths here.
 Click on graph for larger image.
This data is from the COVID Tracking Project.
The percent positive over the last 24 hours was 11.1% (red line is 7 day average). The percent positive is calculated by dividing positive results by total tests (including pending).
And check out COVID Act Now to see how each state is doing. (updated link to new site)
 The second graph shows the 7 day average of positive tests reported and daily hospitalizations.
Question #10 for 2021: How much damage did the pandemic do to certain sectors?
by Calculated Risk on 12/27/2020 04:55:00 PM
Earlier I posted some questions for next year: Ten Economic Questions for 2021. I'm adding some thoughts, and maybe some predictions for each question.
10) Economic Scarring: Some sectors were hit especially hard during the pandemic, like travel (hotels, airlines, cruise ships), and entertainment (restaurants, theaters, concerts). Also some areas of Commercial Real Estate (retail, hotels, offices) might suffer long term damage. How much damage did the pandemic do to certain sectors?
The pandemic will likely cause some medium to long term economic scarring. As an example, the lack of in person education for part of the year, might slow learning for many children. But that is beyond the scope of this question - I'm focused on the impact on the 2021 economy.
If we could flip a switch, and end the pandemic today, there would be certain sectors that would still have problems. And the end to the pandemic will probably be more like a dimmer switch, and slowly fade away in Q2 and Q3 (we hope).
There are some long term trends - like online buying and remote working - that picked up sharply during the pandemic. It seems likely that people will not return completely to pre-pandemic behavior, and that is likely bad news for brick and mortal retailers, and possibly for office building owners. Additional bad news for Commercial Real Estate (CRE) is that a number of restaurants went out of business during the pandemic (and some other businesses), and it will take time to find new tenants.
My sense is certain CRE sectors will struggle in 2021. And there will likely be little investment in Office, Retail and Hotels this coming year. Also apartment owners are getting hit by a decline in timely rent payments, and the multi-family mortgage delinquency rate has been increasing.
The Architectural Billings Index has been below 50 for nine consecutive months. This represents a significant decrease in design services, and suggests a decline in CRE investment through most of 2021 (This usually leads CRE investment by 9 to 12 months).
 Click on graph for larger image.
This graph shows the Architecture Billings Index since 1996. The index was at 46.3 in November, down from 47.5 in October. Anything below 50 indicates contraction in demand for architects' services.
Entertainment and travel was hard hit during the pandemic. See: Seven High Frequency Indicators for the Economy (updated every Monday)
For example, airline travel is down about 60% compared to a year ago. And hotel occupancy is at record lows. And movie attendance is off 95% (there has been a long term trend away from movie theaters to home entertainment, and the pandemic might have accelerated that trend).
There are other areas - like trade shows, conventions, and cruises - that are essentially non-existent.
However, my sense is people will return to travel and entertainment activities once the pandemic ends (maybe less business travel - that would be a negative for airlines and hotels). The return might be slow at first, but people will gradually gain confidence.
So, once the pandemic subsides, my guess is certain sectors of CRE will still struggle, and possibly sectors related to business travel will be negatively impacted.
Even more important, there are a large number of people that have lost their jobs, and they might suffer long term economic hardships. I'll have more later on employment and the participation rate.
Here are the Ten Economic Questions for 2021 and a few predictions:
• Question #1 for 2021: How much will the economy grow in 2021?
• Question #2 for 2021: Will all the jobs lost in 2020 return in 2021, or will job growth be sluggish?
• Question #3 for 2021: What will the unemployment rate be in December 2021?
• Question #4 for 2021: Will the overall participation rate increase to pre-pandemic levels (63.4% in February 2020) , or will it will only partially recover in 2021?
• Question #5 for 2021: Will the core inflation rate increase in 2021? Will too much inflation be a concern in 2021?
• Question #6 for 2021: Will the Fed raise rates in 2021? What about the asset purchase program?
• Question #7 for 2021: How much will RI increase in 2021? How about housing starts and new home sales in 2021?
• Question #8 for 2021: What will happen with house prices in 2021?
• Question #9 for 2021: Will inventory increase as the pandemic subsides, or will inventory decrease further in 2021?
• Question #10 for 2021: How much damage did the pandemic do to certain sectors?

In Memoriam: Doris "Tanta" Dungey


| Privacy Policy |
| Copyright © 2007 - 2025 CR4RE LLC |
| Excerpts NOT allowed on x.com |