 RSS Feed
 by Calculated Risk on 4/30/2020 07:06:00 PM
Thursday, April 30, 2020
Friday: ISM Mfg Survey, Construction Spending
Note: The ISM survey will be for April. The lowest reading during the great recession was 33.1, and the lowest reading since 1948 was 29.4 in May 1980.
Friday:
• At 10:00 AM ET, ISM Manufacturing Index for April. The consensus is for the ISM to be at 36.7, down from 49.1 in March.
• Also at 10:00 AM, Construction Spending for March. The consensus is for a 3.9% decrease in construction spending.
• All day, Light vehicle sales for April. The consensus is for light vehicle sales to be 6.5 million SAAR in April, down from 11.4 million in March (Seasonally Adjusted Annual Rate).
April 30 Update: US COVID-19 Test Results
by Calculated Risk on 4/30/2020 04:51:00 PM
The US might be able to test 400,000 to 600,000 people per day in several weeks according to Dr. Fauci - and that would probably be sufficient for test and trace.
There were 206,557 test results reported over the last 24 hours (the number of tests yesterday were revised up).
 Click on graph for larger image.
This data is from the COVID Tracking Project.
The percent positive over the last 24 hours was 13.5% (red line). The US probably needs enough tests to push the percentage positive below 5%. (probably much lower based on testing in New Zealand).
Fannie Mae: Mortgage Serious Delinquency Rate Increased Slightly in March
by Calculated Risk on 4/30/2020 04:10:00 PM
Fannie Mae reported that the Single-Family Serious Delinquency increased to 0.66% in March, from 0.65% in February. The serious delinquency rate is down from 0.74% in March 2019.
IMPORTANT: These are mortgage loans that are "three monthly payments or more past due or in foreclosure". So it will take three months for the impact of COVID-19 to show up in this series.
The Fannie Mae serious delinquency rate peaked in February 2010 at 5.59%.
 Click on graph for larger image
By vintage, for loans made in 2004 or earlier (2% of portfolio), 2.48% are seriously delinquent. For loans made in 2005 through 2008 (3% of portfolio), 4.11% are seriously delinquent, For recent loans, originated in 2009 through 2018 (95% of portfolio), only 0.35% are seriously delinquent. So Fannie is still working through a few poor performing loans from the bubble years.
I expect the serious delinquency rate will increase in a few months due to COVID-19.
Note: Freddie Mac reported earlier.
Hotels: Occupancy Rate Declined 62.2% Year-over-year
by Calculated Risk on 4/30/2020 01:32:00 PM
From HotelNewsNow.com: STR: US hotel results for week ending 25 April
Reflecting the continued impact of the COVID-19 pandemic, the U.S. hotel industry reported significant year-over-year declines in the three key performance metrics during the week of 19-25 April 2020, according to data from STR.The following graph shows the seasonal pattern for the hotel occupancy rate using the four week average.
In comparison with the week of 21-27 April 2019, the industry recorded the following:
• Occupancy: -62.2% to 26.0%
• Average daily rate (ADR): -42.9% to US$73.61
• Revenue per available room (RevPAR): -78.4% to US$19.13
Year-over-year declines were less steep than previous weeks due to a comparison with the time of Passover in 2019. Additionally, absolute occupancy rose slightly from the levels of the previous two weeks (23.4% and 21.0%).
“Demand has grown slightly across the country during the last two weeks, which could provide some hope that the levels seen in early April were indeed the bottom—especially with some states now moving to ease social distancing guidance,” said Jan Freitag, STR’s senior VP of lodging insights. “The 1.4 million additional room nights sold the last two weeks only represent around 100,000 new rooms occupied per night, but gains even that small are certainly better than further declines.
“Five states—California, Texas, New York, Florida and Georgia—represent 40% of that demand gain from the last two weeks. The list of hotel demand generators is long, but in general, it is not unreasonable to assume that part of the increased business is coming from essential workers, homeless housing initiatives and government-contracted guests.”
emphasis added
 Click on graph for larger image.
The red line is for 2020, dash light blue is 2019, blue is the median, and black is for 2009 (the worst year probably since the Great Depression for hotels).
2020 was off to a solid start, however, COVID-19 has crushed hotel occupancy.
Note: Y-axis doesn't start at zero to better show the seasonal change.
Zillow Case-Shiller March Forecast: Still Showing Increasing YoY Price Gains, Mostly Pre-Crisis
by Calculated Risk on 4/30/2020 12:09:00 PM
The Case-Shiller house price indexes for February were released Tuesday. Zillow forecasts Case-Shiller a month early, and I like to check the Zillow forecasts since they have been pretty close.
From Matthew Speakman at Zillow: February Case-Shiller Results & March Forecast: Last Look at The World that Was
the Case-Shiller home price index for February – the last before the data begin to show effects of the coronavirus outbreak – offers a final look at a housing market that was primed for a stellar spring selling season. ...
Things were looking up for the housing market in mid-winter, with low interest rates and still-secure job prospects combining to boost demand for housing just as a growing share of millennials were looking to finally take the leap into home ownership. Teamed with record-low levels of for-sale inventory, these demand factors had begun to push home prices upward after the growth rate spent most of 2019 decelerating. The economic carnage that’s occurred since, particularly in the labor markets, has been well documented and the true impact on home prices remains to be seen.
emphasis added
 The Zillow forecast is for the year-over-year change for the Case-Shiller National index to be at 4.4% in March, up from 4.2% in February.
 The Zillow forecast is for the 20-City index to be up 3.8% YoY in March from 3.5% in February, and for the 10-City index to increase to 3.3% YoY compared to 2.9% YoY in February.
Note that Case-Shiller is a three month average, so the March data will include both January and February. Also, Case-Shiller uses closed transactions, and most of the transactions that closed in March were signed in January and February - so the March price indexes will still be mostly pre-crisis data.
Q1 2020 GDP Details on Residential and Commercial Real Estate
by Calculated Risk on 4/30/2020 10:26:00 AM
The BEA has released the underlying details for the Q1 initial GDP report this morning.
The BEA reported that investment in non-residential structures decreased at a 9.7% annual pace in Q1.
Investment in petroleum and natural gas exploration decreased in Q1 compared to Q4, and was down 24% year-over-year. This will probably collapse in Q2.
 Click on graph for larger image.
The first graph shows investment in offices, malls and lodging as a percent of GDP.
Investment in offices decreased in Q1, but was only down slightly year-over-year.
Investment in multimerchandise shopping structures (malls) peaked in 2007 and was down about 27% year-over-year in Q1 - and at a record low as a percent of GDP. The vacancy rate for malls is still very high, so investment will probably stay low for some time.
Lodging investment decreased in Q1, and lodging investment was down 8% year-over-year.
 The second graph is for Residential investment components as a percent of GDP. According to the Bureau of Economic Analysis, RI includes new single family structures, multifamily structures, home improvement, Brokers’ commissions and other ownership transfer costs, and a few minor categories (dormitories, manufactured homes).
Usually single family investment is the top category, although home improvement was the top category for five consecutive years following the housing bust. Then investment in single family structures was back on top, however it is close between single family and home improvement.
Even though investment in single family structures has increased from the bottom, single family investment is still low, and still below the bottom for previous recessions as a percent of GDP. I expect some further increases - once the healthcare crisis abates.
Investment in single family structures was $308 billion (SAAR) (about 1.4% of GDP)..
Investment in multi-family structures decreased in Q1.
Investment in home improvement was at a $283 billion Seasonally Adjusted Annual Rate (SAAR) in Q1 (about 1.3% of GDP). Home improvement spending has been solid and might hold up during the pandemic.
Personal Income decreased 2.0% in March, Spending decreased 7.5%
by Calculated Risk on 4/30/2020 09:24:00 AM
The BEA released the Personal Income and Outlays report for March:
Personal income decreased $382.1 billion (2.0 percent) in March according to estimates released today by the Bureau of Economic Analysis. Disposable personal income (DPI) decreased $334.6 billion (2.0 percent) and personal consumption expenditures (PCE) decreased $1,127.3 billion (7.5 percent).The March PCE price index increased 1.3 percent year-over-year and the March PCE price index, excluding food and energy, increased 1.7 percent year-over-year.
Real DPI decreased 1.7 percent in March and Real PCE decreased 7.3 percent. The PCE price index decreased 0.3 percent. Excluding food and energy, the PCE price index decreased 0.1 percent.
The following graph shows real Personal Consumption Expenditures (PCE) through March 2020 (2012 dollars). Note that the y-axis doesn't start at zero to better show the change.
 Click on graph for larger image.
The dashed red lines are the quarterly levels for real PCE.
The change in personal income and the change in PCE were below expectations.
PCE collapsed in March, and will collapse further in April.
Weekly Initial Unemployment Claims decrease to 3,839,000
by Calculated Risk on 4/30/2020 08:35:00 AM
The DOL reported:
In the week ending April 25, the advance figure for seasonally adjusted initial claims was 3,839,000, a decrease of 603,000 from the previous week's revised level. The previous week's level was revised up by 15,000 from 4,427,000 to 4,442,000. The 4-week moving average was 5,033,250, a decrease of 757,000 from the previous week's revised average. The previous week's average was revised up by 3,750 from 5,786,500 to 5,790,250.The previous week was revised up.
emphasis added
The following graph shows the 4-week moving average of weekly claims since 1971.
 Click on graph for larger image.
The dashed line on the graph is the current 4-week average. The four-week average of weekly unemployment claims decreased to 5,033,250.
This was lower than the consensus forecast.
The second graph shows seasonally adjust continued claims since 1967 (lags initial by one week while increasing sharply).
 At the worst of the Great Recession, continued claims peaked at 6.635 million, but then steadily declined.
Continued claims have already increased to a new record high of 17.992 million (SA) and will increase further over the next few weeks - and likely stay at that high level until the crisis abates.
Wednesday, April 29, 2020
Thursday: Unemployment Claims, Personal Income and Outlays, Chicago PMI
by Calculated Risk on 4/29/2020 09:15:00 PM
Merrill: "We expect initial jobless claims of 4.1mn for the week ending April 25, revising up from our preliminary forecast of 3.5mn."
Thursday:
• At 8:30 AM ET, The initial weekly unemployment claims report will be released. The consensus is for a 3.500 million initial claims, down from 4.427 million the previous week.
• Also at 8:30 AM ET, Personal Income and Outlays, March 2020. The consensus is for a 1.4% decrease in personal income, and for a 5.0% decrease in personal spending. And for the Core PCE price index to decrease 0.1%.
• At 9:45 AM, Chicago Purchasing Managers Index for April.
April 29 Update: US COVID-19 Test Results
by Calculated Risk on 4/29/2020 05:18:00 PM
Recommended article by Ed Yong in the Atlantic: Why the Coronavirus Is So Confusing
The US might be able to test 400,000 to 600,000 people per day in several weeks according to Dr. Fauci - and that would probably be sufficient for test and trace.
There were 230,442 test results reported over the last 24 hours (the number of tests yesterday were revised up).
 Click on graph for larger image.
This data is from the COVID Tracking Project.
The percent positive over the last 24 hours was 12.0% (red line). The US probably needs enough tests to push the percentage positive below 5%. (probably much lower based on testing in New Zealand).
FOMC Statement: "committed to using its full range of tools to support the U.S. economy in this challenging time"
by Calculated Risk on 4/29/2020 02:01:00 PM
The Federal Reserve is committed to using its full range of tools to support the U.S. economy in this challenging time, thereby promoting its maximum employment and price stability goals.
The coronavirus outbreak is causing tremendous human and economic hardship across the United States and around the world. The virus and the measures taken to protect public health are inducing sharp declines in economic activity and a surge in job losses. Weaker demand and significantly lower oil prices are holding down consumer price inflation. The disruptions to economic activity here and abroad have significantly affected financial conditions and have impaired the flow of credit to U.S. households and businesses.
The ongoing public health crisis will weigh heavily on economic activity, employment, and inflation in the near term, and poses considerable risks to the economic outlook over the medium term. In light of these developments, the Committee decided to maintain the target range for the federal funds rate at 0 to 1/4 percent. The Committee expects to maintain this target range until it is confident that the economy has weathered recent events and is on track to achieve its maximum employment and price stability goals.
The Committee will continue to monitor the implications of incoming information for the economic outlook, including information related to public health, as well as global developments and muted inflation pressures, and will use its tools and act as appropriate to support the economy. In determining the timing and size of future adjustments to the stance of monetary policy, the Committee will assess realized and expected economic conditions relative to its maximum employment objective and its symmetric 2 percent inflation objective. This assessment will take into account a wide range of information, including measures of labor market conditions, indicators of inflation pressures and inflation expectations, and readings on financial and international developments.
To support the flow of credit to households and businesses, the Federal Reserve will continue to purchase Treasury securities and agency residential and commercial mortgage-backed securities in the amounts needed to support smooth market functioning, thereby fostering effective transmission of monetary policy to broader financial conditions. In addition, the Open Market Desk will continue to offer large-scale overnight and term repurchase agreement operations. The Committee will closely monitor market conditions and is prepared to adjust its plans as appropriate.
Voting for the monetary policy action were Jerome H. Powell, Chair; John C. Williams, Vice Chair; Michelle W. Bowman; Lael Brainard; Richard H. Clarida; Patrick Harker; Robert S. Kaplan; Neel Kashkari; Loretta J. Mester; and Randal K. Quarles.
emphasis added
Q1 GDP: Investment
by Calculated Risk on 4/29/2020 11:55:00 AM
Investment has been weak for some time, and most investment categories were even weaker in Q1 due to COVID-19. However residential investment was very strong in Q1 (increased at 21.0% annual rate in Q1).
The first graph below shows the contribution to GDP from residential investment, equipment and software, and nonresidential structures (3 quarter trailing average). This is important to follow because residential investment tends to lead the economy, equipment and software is generally coincident, and nonresidential structure investment trails the economy.
In the graph, red is residential, green is equipment and software, and blue is investment in non-residential structures. So the usual pattern - both into and out of recessions is - red, green, blue.
Of course - with the sudden economic stop due to COVID-19 - the usual pattern doesn't apply.
The dashed gray line is the contribution from the change in private inventories.
 Click on graph for larger image.
Residential investment (RI) increased in Q1 (21.0% annual rate in Q1). Equipment investment decreased at a 15.2% annual rate, and investment in non-residential structures decreased at a 9.7% annual rate.
On a 3 quarter trailing average basis, RI (red) is up solidly, equipment (green) is negative, and nonresidential structures (blue) is also down.
I'll post more on the components of non-residential investment once the supplemental data is released.
 The second graph shows residential investment as a percent of GDP.
Residential Investment as a percent of GDP increased in Q1. RI as a percent of GDP is close to the bottom of the previous recessions - and prior to the pandemic, I expected RI to continue to increase further in this cycle.
I'll break down Residential Investment into components after the GDP details are released.
Note: Residential investment (RI) includes new single family structures, multifamily structures, home improvement, broker's commissions, and a few minor categories.
 The third graph shows non-residential investment in structures, equipment and "intellectual property products". Investment in equipment and non-residential structures - as a percent of GDP - declined further.
NAR: Pending Home Sales Decrease 20.8% in March
by Calculated Risk on 4/29/2020 10:04:00 AM
From the NAR: NAR Calls Housing Market Slump Temporary as Pending Home Sales Fall in March
Pending home sales fell in March, seeing expected declines as a result of the coronavirus outbreak, according to the National Association of Realtors®. Each of the four major regions saw drops in month-over-month contract activity and year-over-year pending home sales transactions.This was well below expectations for this index. Note: Contract signings usually lead sales by about 45 to 60 days, so this would usually be for closed sales in April and May. Some of these sales will be cancelled or delayed due to COVID-19.
The Pending Home Sales Index (PHSI), a forward-looking indicator based on contract signings, decreased 20.8% to 88.2 in March. Year-over-year, contract signings declined 16.3%. An index of 100 is equal to the level of contract activity in 2001.
...
The Northeast PHSI dropped 14.5% to 82.3 in March, 11.0% lower than a year ago. In the Midwest, the index decreased 22.0% to 85.6 last month, down 12.4% from March 2019.
Pending home sales in the South sank 19.5% to an index of 103.7 in March, a 17.8% drop from March 2019. The index in the West fell 26.8% in March 2020 to 71.4, down 21.5% from a year ago.
emphasis added
BEA: Real GDP decreased at 4.8% Annualized Rate in Q1
by Calculated Risk on 4/29/2020 08:37:00 AM
Note: This is the advance release. Most analysts expect downward revisions as more data become available.
From the BEA: Gross Domestic Product, 1st Quarter 2020 (Advance Estimate)
Real gross domestic product (GDP) decreased at an annual rate of 4.8 percent in the first quarter of 2020, according to the "advance" estimate released by the Bureau of Economic Analysis. In the fourth quarter of 2019, real GDP increased 2.1 percent.The advance Q1 GDP report, at minus 4.8% annualized, was close to expectations.
...
The decrease in real GDP in the first quarter reflected negative contributions from personal consumption expenditures (PCE), nonresidential fixed investment, exports, and private inventory investment that were partly offset by positive contributions from residential fixed investment, federal government spending, and state and local government spending. Imports, which are a subtraction in the calculation of GDP, decreased.
The decrease in PCE reflected decreases in services, led by health care, and goods, led by motor vehicles and parts. The decrease in nonresidential fixed investment primarily reflected a decrease in equipment, led by transportation equipment. The decrease in exports primarily reflected a decrease in services, led by travel.
emphasis added
Personal consumption expenditures (PCE) decreased at 7.6% annualized rate in Q1, down from 1.8% increase in Q4. Residential investment (RI) increased at a 21.0% rate in Q1. Equipment investment decreased at a 15.2% annualized rate, and investment in non-residential structures decreased at a 9.7% pace.
I'll have more later ...
MBA: Mortgage Applications Decreased, Purchase Applications up 12% Week over Week
by Calculated Risk on 4/29/2020 07:00:00 AM
From the MBA: Mortgage Applications Decrease in Latest MBA Weekly Survey
Mortgage applications decreased 3.3 percent from one week earlier, according to data from the Mortgage Bankers Association’s (MBA) Weekly Mortgage Applications Survey for the week ending April 24, 2020.
... The Refinance Index decreased 7 percent from the previous week and was 218 percent higher than the same week one year ago. The seasonally adjusted Purchase Index increased 12 percent from one week earlier. The unadjusted Purchase Index increased 13 percent compared with the previous week and was 20 percent lower than the same week one year ago.
...
“The news in this week’s release is that purchase applications, still recovering from a five-year low, increased 12 percent last week to the strongest level in almost a month. The ten largest states had increases in purchase activity, which is potentially a sign of the start of an upturn in the pandemic-delayed spring homebuying season, as coronavirus lockdown restrictions slowly ease in various markets,” said Joel Kan, MBA’s Associate Vice President of Economic and Industry Forecasting. “California and Washington continued to show increases in purchase activity, with New York seeing a significant gain after declines in five of the last six weeks.”
Added Kan, “Contributing to the uptick in purchase applications was that mortgage rates fell to another record low in MBA’s survey, with the 30-year fixed rate decreasing to 3.43 percent. However, refinance activity declined 7 percent, as rates for refinances likely remained higher than those for purchase loans. Lenders are still working through pipelines at capacity, and observed changes in credit availability for refinance loans have also in turn impacted rates.”
...
The average contract interest rate for 30-year fixed-rate mortgages with conforming loan balances ($510,400 or less) decreased to 3.43 percent from 3.45 percent, with points increasing to 0.34 from 0.29 (including the origination fee) for 80 percent loan-to-value ratio (LTV) loans.
emphasis added
 Click on graph for larger image.
The first graph shows the refinance index since 1990.
The refinance index has been very volatile recently depending on rates and liquidity.
But the index is way up from last year (over triple last year).
 The second graph shows the MBA mortgage purchase index
According to the MBA, purchase activity is down 20% year-over-year.
Purchase activity has fallen sharply, but was up 12% week over week.
Note: Red is a four-week average (blue is weekly).
Tuesday, April 28, 2020
Wednesday: GDP, FOMC Announcement, Pending Home Sales
by Calculated Risk on 4/28/2020 08:17:00 PM
Wednesday:
• At 7:00 AM ET, The Mortgage Bankers Association (MBA) will release the results for the mortgage purchase applications index.
• At 8:30 AM, Gross Domestic Product, 1st quarter 2020 (Advance estimate). The consensus is that real GDP decreased 4.0% annualized in Q1, down from 2.1% in Q4.
• At 10:00 AM, Pending Home Sales Index for March. The consensus is for a 10.0% decrease in the index.
• At 2:00 PM, FOMC Meeting Announcement. No change to policy is expected at this meeting.
• At 2:30 PM, Fed Chair Jerome Powell holds a press briefing following the FOMC announcement.
April 28 Update: US COVID-19 Test Results: Anonymous Exposure Notification coming Friday!
by Calculated Risk on 4/28/2020 05:05:00 PM
From CNBC: How a handful of Apple and Google employees came together to help health officials trace coronavirus
The software, which Apple and Google now refer to by the softer-sounding term “exposure notification” instead of “contact tracing,” is due to be released on May 1.This technology, combined with expanded testing, could drastically slow the pandemic.
…
A group of researchers from Oxford University had already seen promising results in an early study: “Our models show we can stop the epidemic if approximately 60% of the population use the app, and even with lower numbers of app users, we still estimate a reduction in the number of coronavirus cases and deaths,” noted Christophe Fraser, senior author of the latest report from Oxford University’s Nuffield Department of Medicine.
The US might be able to test 400,000 to 600,000 people per day in several weeks according to Dr. Fauci - and that would probably be sufficient for test and trace.
There were 202,233 test results reported over the last 24 hours (the number of tests yesterday were revised up).
 Click on graph for larger image.
This data is from the COVID Tracking Project.
The percent positive over the last 24 hours was 12.1% (red line). The US probably needs enough tests to push the percentage positive below 5%. (probably much lower based on testing in New Zealand).
Lawler: D.R. Horton: Order Decline Not as Bad as Feared So Far in April
by Calculated Risk on 4/28/2020 03:33:00 PM
From housing economist Tom Lawler:
Below is an excerpt from D.R. Horton’s earnings press release from earlier today:
“The Company has experienced increases in sales cancellations and decreases in sales orders in late March and to date in April as compared to the same period in the prior year. Month-to-date in April 2020, the Company’s net sales orders are approximately 11% lower than the same period a year ago. This month-to-date net sales trend may not be indicative of the net sales results that may be expected for the full month of April 2020, because a significant number of sales contract cancellations typically occur in the final days of each month, which can significantly affect net sales orders for the full month. As of the date of this report, the Company’s weekly net sales order volumes in the most recent two weeks have increased as compared to the preceding four weeks.”D.R. Horton’s YOY sales decline so far in April is much smaller than some other larger builders have experienced, with the company attributing some of the “less-than-expected” drop in orders to its inventory of affordably priced homes, and especially its inventory of move-in ready “spec” homes, as well as its increased used of concessions that if often deploys during periods of weak demand.
A recording of the company’s conference call is available on its investor relations website.
| D.R. Horton YOY % Change in Net Orders | |
|---|---|
| Jan-Feb 2020 | 27.3% |
| March 2020 | 5.9% |
| YTD April 2020* | -11.0% |
Real House Prices and Price-to-Rent Ratio in February
by Calculated Risk on 4/28/2020 01:32:00 PM
Here is the post earlier on Case-Shiller: Case-Shiller: National House Price Index increased 4.2% year-over-year in February
It has been fourteen years since the bubble peak. In the Case-Shiller release today, the seasonally adjusted National Index (SA), was reported as being 17% above the previous bubble peak. However, in real terms, the National index (SA) is still about 6% below the bubble peak (and historically there has been an upward slope to real house prices). The composite 20, in real terms, is still 13% below the bubble peak.
The year-over-year growth in prices increased to 4.2% nationally, as expected with lower mortgage rates and fewer homes for sell. This was pre-crisis data.
Usually people graph nominal house prices, but it is also important to look at prices in real terms (inflation adjusted). Case-Shiller and others report nominal house prices. As an example, if a house price was $200,000 in January 2000, the price would be close to $291,000 today adjusted for inflation (45%). That is why the second graph below is important - this shows "real" prices (adjusted for inflation).
Nominal House Prices
 The first graph shows the monthly Case-Shiller National Index SA, and the monthly Case-Shiller Composite 20 SA (through February) in nominal terms as reported.
In nominal terms, the Case-Shiller National index (SA)and the Case-Shiller Composite 20 Index (SA) are both at new all times highs (above the bubble peak).
Real House Prices
 The second graph shows the same two indexes in real terms (adjusted for inflation using CPI less Shelter). Note: some people use other inflation measures to adjust for real prices.
In real terms, the National index is back to April 2005 levels, and the Composite 20 index is back to August 2004.
In real terms, house prices are at 2004/2005 levels.
Price-to-Rent
In October 2004, Fed economist John Krainer and researcher Chishen Wei wrote a Fed letter on price to rent ratios: House Prices and Fundamental Value. Kainer and Wei presented a price-to-rent ratio using the OFHEO house price index and the Owners' Equivalent Rent (OER) from the BLS.
 Here is a similar graph using the Case-Shiller National and Composite 20 House Price Indexes.
This graph shows the price to rent ratio (January 2000 = 1.0). The price-to-rent ratio has been moving sideways recently.
On a price-to-rent basis, the Case-Shiller National index is back to March 2004 levels, and the Composite 20 index is back to November 2003 levels.
In real terms, prices are back to late 2004 levels, and the price-to-rent ratio is back to late 2003, early 2004.
HVS: Q1 2020 Homeownership and Vacancy Rates
by Calculated Risk on 4/28/2020 10:44:00 AM
The Census Bureau released the Residential Vacancies and Homeownership report for Q1 2020. This is mostly pre-crisis.
This report is frequently mentioned by analysts and the media to track household formation, the homeownership rate, and the homeowner and rental vacancy rates. However, there are serious questions about the accuracy of this survey.
This survey might show the trend, but I wouldn't rely on the absolute numbers. he Census Bureau is investigating the differences between the HVS, ACS and decennial Census, and analysts probably shouldn't use the HVS to estimate the excess vacant supply or household formation, or rely on the homeownership rate, except as a guide to the trend.
"National vacancy rates in the first quarter 2020 were 6.6 percent for rental housing and 1.1 percent for homeowner housing. The rental vacancy rate of 6.6 percent was 0.4 percentage points lower than the rate in the first quarter 2019 (7.0 percent), but not statistically different from the fourth quarter 2019 (6.4 percent). The homeowner vacancy rate of 1.1 percent was 0.3 percentage points lower than the rate in the first quarter 2019 (1.4 percent) and the rate in the fourth quarter 2019 (1.4 percent).
The homeownership rate of 65.3 percent was 1.1 percentage points higher than the rate in the first quarter 2019 (64.2 percent) but was not statistically different from the rate in the fourth quarter 2019 (65.1 percent)."
 Click on graph for larger image.
The Red dots are the decennial Census homeownership rates for April 1st 1990, 2000 and 2010. The HVS homeownership rate increased to 65.3% in Q1, from 65.1% in Q4.
I'd put more weight on the decennial Census numbers.
 The HVS homeowner vacancy declined to 1.1%.
 Once again - this probably shows the general trend, but I wouldn't rely on the absolute numbers.
 The rental vacancy rate increased to 6.6% in Q1.
The quarterly HVS is the most timely survey on households, but there are many questions about the accuracy of this survey.
Overall this suggests that vacancies have declined significantly, the homeownership rate has bottomed - and that the rental vacancy rate is close to the bottom for this cycle.
Richmond Fed: "Fifth District Manufacturing Activity Declined Sharply in April", Lowest Reading on Record
by Calculated Risk on 4/28/2020 10:03:00 AM
From the Richmond Fed: Manufacturing Activity Declined Sharply in April
Fifth District manufacturing activity declined sharply in April, according to the most recent survey from the Richmond Fed. The composite index plummeted from 2 in March to −53 in April, its lowest reading and largest one-month drop on record. All three components — shipments, new orders, and employment — fell, and the indexes for shipments and new orders reached record lows. Firms reported weakened local business conditions and expected conditions to remain soft in the next six months.This was the last of the regional Fed surveys for April.
Survey results reflected a deterioration in employment conditions in April. More contacts reported drops in employment and average work week, although the wage index remained flat. Manufacturers expected these conditions to persist.
emphasis added
Here is a graph comparing the regional Fed surveys and the ISM manufacturing index:
 Click on graph for larger image.
The New York and Philly Fed surveys are averaged together (yellow, through April), and five Fed surveys are averaged (blue, through April) including New York, Philly, Richmond, Dallas and Kansas City. The Institute for Supply Management (ISM) PMI (red) is through March (right axis).
The ISM manufacturing index for April will be released on Friday, May 1st. The consensus is for the ISM to decline sharply to 36.7, down from 49.1 in March. Based on these regional surveys, the ISM manufacturing index might even be lower than the consensus in April.
Case-Shiller: National House Price Index increased 4.2% year-over-year in February
by Calculated Risk on 4/28/2020 09:11:00 AM
Note: This is for February. This is mostly pre-crisis data.
S&P/Case-Shiller released the monthly Home Price Indices for February ("February" is a 3 month average of December, January and February prices).
This release includes prices for 20 individual cities, two composite indices (for 10 cities and 20 cities) and the monthly National index.
Note: Case-Shiller reports Not Seasonally Adjusted (NSA), I use the SA data for the graphs.
From S&P: S&P CoreLogic Case-Shiller Index Shows Annual Home Price Gains Increased To 4.2% In February
The S&P CoreLogic Case-Shiller U.S. National Home Price NSA Index, covering all nine U.S. census divisions, reported a 4.2% annual gain in February, up from 3.9% in the previous month. The 10-City Composite annual increase came in at 2.9%, up from 2.6% in the previous month. The 20-City Composite posted a 3.5% year-over-year gain, up from 3.1% in the previous month.
Phoenix, Seattle, Tampa and Charlotte reported the highest year-over-year gains among the 20 cities. In February, Phoenix led the way with a 7.5% year-over-year price increase, followed by Seattle with a 6.0% increase, and Tampa and Charlotte with 5.2% increases. Seventeen of the 20 cities reported higher price increases in the year ending February 2020 versus the year ending January 2020.
...
The National Index and the 10-City Composite both posted a 0.4% month-over-month increase, while the 20-City Composite posted a 0.5% increase before seasonal adjustment in February. After seasonal adjustment, the National Index posted a month-over-month increase of 0.5%, while the 10-City and 20-City Composites both posted 0.4% increases. In February, 19 of 20 cities reported increases before seasonal adjustment while all 20 cities reported increases after seasonal adjustment.
The stable growth pattern established in the last half of 2019 continued into February,” says Craig J. Lazzara, Managing Director and Global Head of Index Investment Strategy at S&P Dow Jones Indices. “The National Composite Index rose by 4.2% in February 2020, and the 10- and 20-City Composites also advanced (by 2.9% and 3.5%, respectively). Results for the month were broad-based, with gains in every city in our 20-City Composite; 17 of the 20 cities saw accelerating prices. The National, 10-City, and 20-City Composites all rose at a faster rate in February than they had in January.
“At a regional level, Phoenix retains the top spot for the ninth consecutive month, with a gain of 7.5% for February. Home prices in Seattle rose by 6.0%, with Tampa and Charlotte prices both gaining 5.2%. Prices were particularly strong in the West and Southeast, and comparatively weak in the Midwest and Northeast.
“Importantly, today’s report covers real estate transactions closed during the month of February, and shows no signs of any adverse effect from the governmental suppression of economic activity in response to the COVID-19 pandemic. As much of the U.S. economy was shuttered in March, next month’s data may begin to reflect the impact of these policies on the housing market.”
emphasis added
 Click on graph for larger image.
 The first graph shows the nominal seasonally adjusted Composite 10, Composite 20 and National indices (the Composite 20 was started in January 2000).
The Composite 10 index is up 3.3% from the bubble peak, and up 0.4% in February (SA) from January.
The Composite 20 index is 7.4% above the bubble peak, and up 0.5% (SA) in February.
The National index is 17% above the bubble peak (SA), and up 0.5% (SA) in February. The National index is up 58% from the post-bubble low set in December 2011 (SA).
 The second graph shows the Year over year change in all three indices.
The Composite 10 SA is up 2.9% compared to February 2019. The Composite 20 SA is up 3.4% year-over-year.
The National index SA is up 4.2% year-over-year.
Note: According to the data, prices increased in 20 of 20 cities month-over-month seasonally adjusted.
I'll have more later.
Monday, April 27, 2020
Tuesday: Case-Shiller House Prices, Richmond Fed Mfg
by Calculated Risk on 4/27/2020 09:09:00 PM
CR Note: The Case-Shiller report is for February (before crisis). The Richmond Fed manufacturing survey is the last of the regional surveys for April. All of the surveys have been very weak.
Tuesday:
• At 9:00 AM, S&P/Case-Shiller House Price Index for February. The consensus is for a 3.1% year-over-year increase in the Comp 20 index for February.
• At 10:00 AM, Richmond Fed Survey of Manufacturing Activity for April. This is the last of regional manufacturing surveys for April.
• Also at 10:00 AM, the Q1 2020 Housing Vacancies and Homeownership from the Census Bureau.
April 27 Update: US COVID-19 Test Results: Disappointing
by Calculated Risk on 4/27/2020 04:58:00 PM
Disappointing, but might be weekend related.
From The Hill: Fauci confident US will double coronavirus testing capacity over next several weeks
Fauci said in a webcast hosted by the National Academy of Sciences that that the U.S. is currently averaging between 1.5 million and 2 million tests per week.Based on these comments, the US might be able to test 400,000 to 600,000 people per day in several weeks - and that would probably be sufficient for test and trace.
"We probably should get up to twice that as we get into the next several weeks, and I think we will," Fauci said. "Testing is an important part of what we’re doing, but it is not the only part."
…
"You need enough tests so when you’re doing what we’re trying to do right now, which is trying to ease our way back, that you can very easily identify, test, contact trace and get those who are infected out of society so they don’t infect others," he said, adding that positive test results should account for less than 10 percent of tests administered.
There were 135,505 test results reported over the last 24 hours.
 Click on graph for larger image.
This data is from the COVID Tracking Project.
The percent positive over the last 24 hours was 16.2% (red line). The US probably needs enough tests to push the percentage positive below 5%, although Dr. Fauci said below 10% (probably much lower based on testing in New Zealand).
Freddie Mac: Mortgage Serious Delinquency Rate Unchanged in March
by Calculated Risk on 4/27/2020 04:42:00 PM
Freddie Mac reported that the Single-Family serious delinquency rate in March was 0.60%, unchanged from 0.60% in February. Freddie's rate is down from 0.67% in March 2019.
This matches the last two months as the lowest delinquency rate since November 2007.
Freddie's serious delinquency rate peaked in February 2010 at 4.20%.
These are mortgage loans that are "three monthly payments or more past due or in foreclosure".
 Click on graph for larger image
This is close to a cycle bottom. However, with COVID-19, this rate will increase in a few months (it takes time since these are mortgage three months or more past due).
Note: Fannie Mae will report for March soon.
MBA Survey: "Share of Mortgage Loans in Forbearance Increases to 6.99%" of Portfolio Volume
by Calculated Risk on 4/27/2020 04:00:00 PM
Note: To put these numbers in perspective, the MBA notes "For the week of March 2, only 0.25% of all loans were in forbearance."
From the MBA: Share of Mortgage Loans in Forbearance Increases to 6.99%
The Mortgage Bankers Association’s (MBA) latest Forbearance and Call Volume Survey revealed that the total number of loans now in forbearance increased from 5.95% of servicers’ portfolio volume in the prior week to 6.99% as of April 19, 2020.
“Over 26 million Americans have filed for unemployment over the last month, leading to nearly 7 percent – 3.5 million – of all mortgage borrowers asking to be put into forbearance plans. For FHA and VA borrowers, the share of loans in forbearance is even higher, at 10 percent,” said Mike Fratantoni, MBA’s Senior Vice President and Chief Economist. “Forbearance requests fell relative to the prior week but remain roughly 100 times greater than the early March baseline. While the pace of job losses have slowed from the astronomical heights of just a few weeks ago, millions of people continue to file for unemployment. We expect forbearance requests will pick up again as we approach May payment due dates.”
Added Fratantoni, “The combination of stimulus payments, expanded unemployment insurance benefits, further fiscal and monetary actions, and states reopening will hopefully begin to stabilize forbearance requests and the overall economy.”
emphasis added
 Click on graph for larger image.
This graph shows the weekly forbearance requests as a percent of servicer's portfolio volume.
The requests peaked in the week of March 30th to April 5th, but might pick up again when May payments are due.
The MBA notes: "Forbearance requests as a percent of servicing portfolio volume (#) dropped relative to the prior week: from 1.79% to 1.14%."
Dallas Fed: "Contraction in Texas Manufacturing Sector Worsens", Record Low Activity Index
by Calculated Risk on 4/27/2020 10:35:00 AM
From the Dallas Fed: Contraction in Texas Manufacturing Sector Worsens
Texas factory activity declined further in April, according to business executives responding to the Texas Manufacturing Outlook Survey. The production index, a key measure of state manufacturing conditions, pushed further negative from -35.3 to -55.3, suggesting the contraction in output has steepened since last month.The last of the regional Fed surveys for April will be released tomorrow (Richmond Fed).
Other measures of manufacturing activity also point to a sharper decline in April. The new orders index dropped 26 points to -67.0, its lowest reading since the survey began in 2004. Similarly, the growth rate of orders index fell to -62.2. The capacity utilization and shipments indexes fell to -54.5 and -56.6, respectively. The capital expenditures index declined 20 points to -54.3. Each of these April readings represents a historical low.
Perceptions of broader business conditions remained very pessimistic in April. The general business activity index inched down from -70.0 to -73.7, pushing to a new historical low. The company outlook index remained near an all-time low but inched up from -65.6 to -62.6. The index measuring uncertainty regarding companies’ outlooks retreated slightly to 54.4, a reading still indicative of sharply increased uncertainty.
Labor market measures indicate further employment declines and shorter workweeks this month. The employment index held steady at -21.2. Three percent of firms noted net hiring, while 24 percent noted net layoffs. The hours worked index dropped 18 points to -40.2, signaling a notably reduced workweek length.
emphasis added
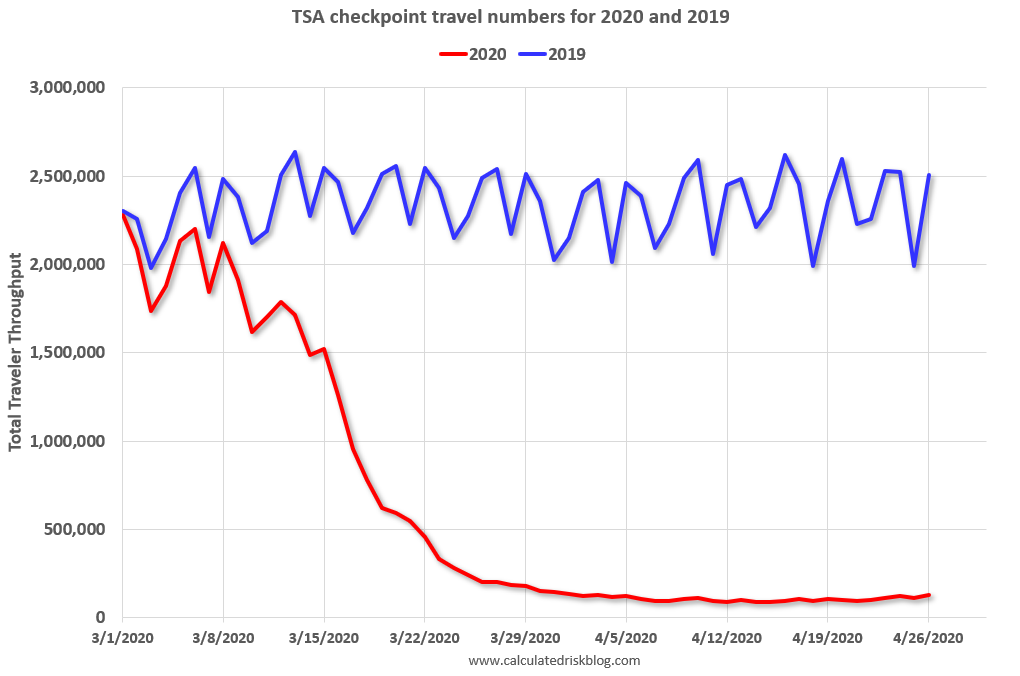
TSA checkpoint travel numbers
by Calculated Risk on 4/27/2020 09:37:00 AM
The TSA is providing daily travel numbers.
This is another measure that will be useful to track when the economy starts to reopen.
 Click on graph for larger image.
This data shows the daily total traveler throughput from the TSA for 2019 (Blue) and 2020 (Red).
On April 26th there were 128,875 travelers compared to 2,506,809 a year ago.
That is a decline of 95%.
Sunday, April 26, 2020
Sunday Night Futures
by Calculated Risk on 4/26/2020 09:51:00 PM
Weekend:
• Schedule for Week of April 26, 2020
Monday:
• At 10:30 AM ET, Dallas Fed Survey of Manufacturing Activity for April.
From CNBC: Pre-Market Data and Bloomberg futures S&P 500 and DOW futures are up slightly (fair value).
Oil prices were down over the last week with WTI futures at $15.52 per barrel and Brent at $21.00 barrel. A year ago, WTI was at $63, and Brent was at $71 - so WTI oil prices are down about 75% year-over-year.
Here is a graph from Gasbuddy.com for nationwide gasoline prices. Nationally prices are at $1.74 per gallon. A year ago prices were at $2.88 per gallon, so gasoline prices are down $1.14 per gallon year-over-year.
April 26 Update: US COVID-19 Test Results: Fauci Expects Testing to Double
by Calculated Risk on 4/26/2020 05:01:00 PM
From The Hill: Fauci confident US will double coronavirus testing capacity over next several weeks
Fauci said in a webcast hosted by the National Academy of Sciences that that the U.S. is currently averaging between 1.5 million and 2 million tests per week.Based on these comments, the US might be able to test 400,000 to 600,000 people per day in several weeks - and that would probably be sufficient for test and trace.
"We probably should get up to twice that as we get into the next several weeks, and I think we will," Fauci said. "Testing is an important part of what we’re doing, but it is not the only part."
…
"You need enough tests so when you’re doing what we’re trying to do right now, which is trying to ease our way back, that you can very easily identify, test, contact trace and get those who are infected out of society so they don’t infect others," he said, adding that positive test results should account for less than 10 percent of tests administered.
There were 256,444 test results reported over the last 24 hours.
 Click on graph for larger image.
This data is from the COVID Tracking Project.
The percent positive over the last 24 hours was 10.7% (red line). The US probably needs enough tests to push the percentage positive below 5%, although Dr. Fauci said below 10% (probably much lower based on testing in New Zealand).
April 2020: Unofficial Problem Bank list Decreased to 64 Institutions
by Calculated Risk on 4/26/2020 08:11:00 AM
The FDIC's official problem bank list is comprised of banks with a CAMELS rating of 4 or 5, and the list is not made public (just the number of banks and assets every quarter). Note: Bank CAMELS ratings are also not made public.
CAMELS is the FDIC rating system, and stands for Capital adequacy, Asset quality, Management, Earnings, Liquidity and Sensitivity to market risk. The scale is from 1 to 5, with 1 being the strongest.
As a substitute for the CAMELS ratings, surferdude808 is using publicly announced formal enforcement actions, and also media reports and company announcements that suggest to us an enforcement action is likely, to compile a list of possible problem banks in the public interest.
DISCLAIMER: This is an unofficial list, the information is from public sources and while deemed to be reliable is not guaranteed. No warranty or representation, expressed or implied, is made as to the accuracy of the information contained herein and same is subject to errors and omissions. This is not intended as investment advice. Please contact CR with any errors.
Here is the unofficial problem bank list for April 2020.
Here are the monthly changes and a few comments from surferdude808:
Update on the Unofficial Problem Bank List for April 2020. During the month, the list declined by one to 64 banks after one removal. Aggregate assets were little changed at $48.4 billion. A year ago, the list held 73 institutions with assets of $52.1 billion. Exiting the list via failure was The First State Bank, Barboursville, WV ($152 million). This was the second failure in 2020 and the first failure in West Virginia since 2008 when Ameribank, Northfork, WV ($104 million) failed on September 19, 2008.The first unofficial problem bank list was published in August 2009 with 389 institutions. The number of unofficial problem banks grew quickly and peaked at 1,003 institutions in July, 2011 - and has steadily declined to well below 100 institutions.
Saturday, April 25, 2020
April 25 Update: US COVID-19 Test Results: Making Progress!
by Calculated Risk on 4/25/2020 05:16:00 PM
Test-and-trace is a key criterion in starting to reopen the country. My current guess is test-and-trace will require around 300,000 tests per day at first since the US is far behind the curve. Some scientists believe we need around 800,000 tests per day.
Note: The Financial Times reports that Germany is doing more than 50,000 tests per day (with about one-fourth of the US population). That would be 200,000 in the US. I rounded up to 300,000 per day since the US is so behind on testing. But there are recommendations that Germany needs 200,000 tests per day to do test-and-trace. (800,000 adjusted for population).
This is just test results reported daily.
There were 300,833 test results reported over the last 24 hours.
 Click on graph for larger image.
This data is from the COVID Tracking Project.
The percent positive over the last 24 hours was 13.5% (red line). The US probably needs enough tests to push the percentage below 5% (probably much lower based on testing in New Zealand).
All experts agree: We appear to be making progress.
Hotels: Occupancy Rate Declined 64.4% Year-over-year; 4-Week Average at All Time Record Low
by Calculated Risk on 4/25/2020 10:39:00 AM
From HotelNewsNow.com: STR: US hotel results for week ending 18 April
Reflecting the continued impact of the COVID-19 pandemic, the U.S. hotel industry reported significant year-over-year declines in the three key performance metrics during the week of 12-18 April 2020, according to data from STR.The following graph shows the seasonal pattern for the hotel occupancy rate using the four week average.
In comparison with the week of 14-20 April 2019, the industry recorded the following:
• Occupancy: -64.4% to 23.4%
• Average daily rate (ADR): -42.2% to US$74.53
• Revenue per available room (RevPAR): -79.4% to US$17.43
“Absolute occupancy and ADR were actually up slightly from the previous week, but it is important to state that this is not any type of early-recovery sign,” said Jan Freitag, STR’s senior VP of lodging insights. “Rather, more demand can be attributed to frontline workers. A perfect example, the most notable occupancy level (33.3%) came in the New York City market, which has welcomed an influx of workers from the medical community.”
emphasis added
 Click on graph for larger image.
The red line is for 2020, dash light blue is 2019, blue is the median, and black is for 2009 (the worst year probably since the Great Depression for hotels).
2020 was off to a solid start, however, COVID-19 has crushed hotel occupancy.
Note: Y-axis doesn't start at zero to better show the seasonal change.
This is the lowest 4-weekly average occupancy on record, even considering seasonality. It appears that around 20% occupancy could be the bottom.
Schedule for Week of April 26, 2020
by Calculated Risk on 4/25/2020 08:11:00 AM
The key report scheduled for this week is Q1 GDP.
Other key reports include Case-Shiller house prices, ISM Manufacturing survey, Vehicle Sales and Personal Income and Outlays for March.
For manufacturing, the April Dallas and Richmond manufacturing surveys will be released.
The FOMC meets this week, and no change to policy is expected at this meeting.
10:30 AM: Dallas Fed Survey of Manufacturing Activity for April.
 9:00 AM: S&P/Case-Shiller House Price Index for February.
This graph shows the nominal seasonally adjusted National Index, Composite 10 and Composite 20 indexes through the most recent report (the Composite 20 was started in January 2000).
The consensus is for a 3.1% year-over-year increase in the Comp 20 index for February.
10:00 AM: Richmond Fed Survey of Manufacturing Activity for April. This is the last of regional manufacturing surveys for April.
10:00 AM: the Q1 2020 Housing Vacancies and Homeownership from the Census Bureau.
7:00 AM ET: The Mortgage Bankers Association (MBA) will release the results for the mortgage purchase applications index.
8:30 AM: Gross Domestic Product, 1st quarter 2020 (Advance estimate). The consensus is that real GDP decreased 4.0% annualized in Q1, down from 2.1% in Q4.
10:00 AM: Pending Home Sales Index for March. The consensus is for a 10.0% decrease in the index.
2:00 PM: FOMC Meeting Announcement. No change to policy is expected at this meeting.
2:30 PM: Fed Chair Jerome Powell holds a press briefing following the FOMC announcement.
8:30 AM: The initial weekly unemployment claims report will be released. The consensus is for a 3.500 million initial claims, down from 4.427 million the previous week.
8:30 AM ET: Personal Income and Outlays, March 2020. The consensus is for a 1.4% decrease in personal income, and for a 5.0% decrease in personal spending. And for the Core PCE price index to decrease 0.1%.
9:45 AM: Chicago Purchasing Managers Index for April.
 10:00 AM: ISM Manufacturing Index for April. The consensus is for the ISM to be at 36.7, down from 49.1 in March.
Here is a long term graph of the ISM manufacturing index.
The PMI was at 49.1% in March, down from 50.1% in February. The employment index was at 43.8% and the new orders index was at 42.2%.
10:00 AM: Construction Spending for March. The consensus is for a 3.9% decrease in construction spending.
 All day: Light vehicle sales for April. The consensus is for light vehicle sales to be 6.5 million SAAR in April, down from 11.4 million in March (Seasonally Adjusted Annual Rate).
This graph shows light vehicle sales since the BEA started keeping data in 1967. The dashed line is the sales rate for the previous month.
Friday, April 24, 2020
April 24 Update: US COVID-19 Test Results
by Calculated Risk on 4/24/2020 05:22:00 PM
NOTE: California sometimes clears the backlog of tests, and this shows a spike in testing. We need to look at the trend.
Test-and-trace is a key criterion in starting to reopen the country. My current guess is test-and-trace will require around 300,000 tests per day at first since the US is far behind the curve. Some scientists believe we need around 800,000 tests per day.
Note: The Financial Times reports that Germany is doing more than 50,000 tests per day (with about one-fourth of the US population). That would be 200,000 in the US. I rounded up to 300,000 per day since the US is so behind on testing. But there are recommendations that Germany needs 200,000 tests per day to do test-and-trace. (800,000 adjusted for population).
This is just test results reported daily.
There were 223,552 test results reported over the last 24 hours.
 Click on graph for larger image.
This data is from the COVID Tracking Project.
The percent positive over the last 24 hours was 14% (red line). The US probably needs enough tests to push the percentage below 5% (probably much lower based on testing in New Zealand).
All experts agree: We need many more tests! But we appear to be making progress.
Q1 GDP Forecasts: Around -7% SAAR
by Calculated Risk on 4/24/2020 05:04:00 PM
Note 1: Economists at both Merrill Lynch and Goldman Sachs expect significant downward revisions to the advance report due to incomplete source data. The consensus is the advance report will show a decline of 4.0% SAAR in Q1.
Note 2: The NY Fed Nowcast and Atlanta Fed GDPNow models are based on released data and aren't capturing the collapse in the economy in the 2nd half of March. All forecasts, including the Merrill Lynch and other forecasts, are for the seasonally adjust annual rate (SAAR) of decline.
From Merrill Lynch:
We expect real GDP to plunge 7% in 1Q. Consumption and business capex should plummet. [SAAR Apr 24 estimate]From Goldman Sachs:
emphasis added
On net, we lowered our estimate for GDP growth in next Wednesday’s report by three tenths to -4.8% (qoq ar). We also see increased scope for downward revisions to the source data in coming months, and we estimate the final vintages will show growth of -8.3% (vs. -7.0% previously), with the 3.5pp wedge reflecting non-response bias and incomplete source data. [SAAR Apr 24]From the NY Fed Nowcasting Report
The New York Fed Staff Nowcast stands at -0.4% for 2020:Q1 and -7.8% for 2020:Q2. [Apr 24 estimate]And from the Altanta Fed: GDPNow
The GDPNow model estimate for real GDP growth (seasonally adjusted annual rate) in the first quarter of 2020 is -0.3 percent on April 24, unchanged from April 16 after rounding. There are no subjective adjustments made to GDPNow—the estimate is based solely on the mathematical results of the model. In particular, it does not capture the impact of COVID-19 beyond its impact on GDP source data and relevant economic reports that have already been released. It does not anticipate the impact of COVID-19 on forthcoming economic reports beyond the standard internal dynamics of the model. [Apr 24 estimate]CR Note: It appears GDP declined around 7% SAAR in Q1. The decline in Q2 will be much larger; the CBO is projecting a decline of close to 40% SAAR in Q2.
Lawler: Zillow on Trends in Pending Sales
by Calculated Risk on 4/24/2020 12:59:00 PM
Housing economist Tom Lawler sent me the following:
From Jeff Tucker at Zillow Economic Research Early Data Point to Slight Housing Turnaround After Initial Coronavirus Pullback (March 2020 Market Report)
“Zillow Economic Research is piloting three new daily metrics — daily new active listings, daily new pending listings and daily median list price — in an effort to bolster our usual monthly data and provide more timely signals about the housing market during this unprecedented health and economic crisis.”The charts Zillow shows do not show levels, but show year-over-year % changes. While the data are daily, it would appear as if each data point reflects a “rolling week,” or rolling 7-day average.
The definition of pending sales is “(t)he number of listings on Zillow that switch from active to pending status each day,” I’m not positive, but I do not believe this definition will reflect cancellations.
Assuming the data reflect rolling 7-day averages, here are some data from the chart on pending sales.
| Week Ending: | YOY % Change in Pending Sales (Zillow) |
|---|---|
| 4/19/20 | -32% |
| 4/12/20 | -37% |
| 4/5/20 | -34% |
| 3/29/20 | -23% |
| 3/22/20 | -1% |
| 3/15/20 | 17% |
| 3/8/20 | 18% |
| 3/1/20 | 26% |
Lawler: Excerpts from PulteGroup’s Conference Call
by Calculated Risk on 4/24/2020 11:23:00 AM
From housing economist Tom Lawler:
The edited transcript from the conference call is available here.
“In the first quarter, net new orders were up more than 30% over the prior year for both January and February. It's now old news when I say that, with the virus spreading rapidly and governments implementing shelter-in-place restrictions, homebuying demand slowed dramatically as March progressed. To appreciate the magnitude of the slowdown, in the first full week of March, our net new orders exceeded 800 homes. In the final full week, this number dropped to just 140. As a result, our March 2020 orders in total were down 11% from March of 2019. From orders being up 30-plus percent to being down 11% in just a few weeks is unlike anything we have experienced before.”
“Given how the U.S. economic slowdown intensified as we moved into April, it is no the month, we have sold approximately 920 homes on a gross basis, excluding cancellations. The underlying trend is that buyer traffic to our website, and in turn, our communities has decreased materially. This is obviously a very small sample size, but directionally, we are running a little below 50% of the pace in the first quarter, with the most recent trends generally stable to up slightly.”
“Through the first 3 weeks of April, we've had 360 backlog units canceled, which represents only 3% of homes in backlog.”
Note that if PuleGroup’s gross orders were 920 in the first 3 weeks of April, and cancellations were 360 in the first 3 weeks of April, net orders in the first three weeks of April were just 560, or more than 30% lower than net orders in just the first week of March alone!
While the company didn’t give further information about the weekly pattern of orders or cancellations, it would appear as if net orders in April could be down by about 65% from the monthly average pace of the first quarter.
University of Michigan: Consumer Sentiment at 71.8, Down from 89.1 in March
by Calculated Risk on 4/24/2020 10:02:00 AM
From the University of Michigan: Preliminary Results for April 2020
April's final Sentiment Index reading remained largely unchanged from the mid-month figure (+0.8 points), and households with below median incomes expressed the same level of confidence as those with above median incomes (71.9). This merging reflects somewhat larger April declines among households with above median incomes (-19.8 points) compared with those with below median incomes (-14.0). The seven-day moving average of the Index of Consumer Sentiment indicated a second larger improvement that was quickly reversed (see the featured chart); its cause could not be linked to any direct judgements about the coronavirus. The notable divergence between the two main components of the Sentiment Index remained large. The Current Conditions Index fell by 29.4 points in the past month and by 40.5 points in the past two months, whereas the Expectations Index has posted smaller declines of 9.6 points in the past month and 22.0 points from February. While the decline in both indices indicates an ongoing recession, the gap reflects the anticipated cyclical nature of the coronavirus.
emphasis added
Black Knight: More than 3.4 Million Homeowners Now in COVID-19-Related Forbearance Plans
by Calculated Risk on 4/24/2020 08:34:00 AM
From Black Knight: More than 3.4 Million Homeowners – 6.4% of All Mortgages – Now in COVID-19-Related Forbearance Plans According to Black Knight’s McDash Flash Data Set
• The McDash Flash suite from Black Knight leverages daily, loan-level data to provide market participants with the most current view of the forbearance and mortgage performance landscape
• According to the McDash Flash Forbearance Tracker, as of April 23, 2020, more than 3.4 million homeowners – or 6.4% of all mortgages – have entered into COVID-19 mortgage forbearance plans
• This population represents $754 billion in unpaid principal and includes 5.6% of all GSE-backed loans and 8.9% of all FHA/VA loans
• At today’s level, mortgage servicers are bound to advance $2.8 billion of principal and interest payments per month to holders of government-backed securities on COVID-19-related forbearances
• Another $1.3 billion per month in lost funds is faced by those with portfolio-held or privately-securitized mortgages
• Given FHFA’s recently announced four-month limit on advance obligations, servicers of GSE-backed mortgages could still face more than $7 billion in advances based on the number of forbearance plans thus far
Thursday, April 23, 2020
Friday: Durable Goods, Consumer Sentiment
by Calculated Risk on 4/23/2020 08:08:00 PM
Friday:
• At 8:30 AM ET, Durable Goods Orders for March from the Census Bureau. The consensus is for a 6.0% decrease in durable goods orders.
• At 10:00 AM, University of Michigan's Consumer sentiment index (Final for April). The consensus is for a reading of 70.0.
April 23 Update: US COVID-19 Test Results
by Calculated Risk on 4/23/2020 05:05:00 PM
NOTE: California reported over 165,000 tests yesterday. Perhaps they were clearing a backlog, but a majority of the tests were negative - pushing down the percent positive rate. I'd take yerserday's numbers with a grain of salt.
Test-and-trace is a key criterion in starting to reopen the country. My current guess is test-and-trace will require around 300,000 tests per day at first since the US is far behind the curve. Some scientists believe we need around 800,000 tests per day.
Note: The Financial Times reports that Germany is doing more than 50,000 tests per day (with about one-fourth of the US population). That would be 200,000 in the US. I rounded up to 300,000 per day since the US is so behind on testing. But there are recommendations that Germany needs 200,000 tests per day to do test-and-trace. (800,000 adjusted for population).
This is just test results reported daily.
There were 193,479 test results reported over the last 24 hours.
 Click on graph for larger image.
This data is from the COVID Tracking Project.
The percent positive over the last 24 hours was 17% (red line). The US probably needs enough tests to push the percentage below 5% (probably much lower based on testing in New Zealand).
All experts agree: We need many more tests!
Black Knight: National Mortgage Delinquency Rate Increased in March, First Increase in March Ever
by Calculated Risk on 4/23/2020 02:29:00 PM
Note: Loans in forbearance will be counted as delinquent in this survey, so the delinquency rate will jump in April (see Black Knight's on this below)
From Black Knight: Black Knight’s First Look: Mortgage Delinquencies See First-Ever March Increase from Early COVID-19 Impact; Foreclosures, Serious Delinquencies Hit Record Lows
• In what’s typically the strongest month of the year for mortgage performance, delinquencies rose by 3.33%, the first March increase since the turn of the century, an early sign of COVID-19’s impact on the marketAccording to Black Knight's First Look report for March, the percent of loans delinquent increased 3.3% in March compared to February, and decreased 7.3% year-over-year.
• Both the national foreclosure and 90-day delinquency rates set new record lows in March, a lingering reminder of the strength of the mortgage market heading into the pandemic
• At just 27,600 for the month, foreclosure starts also fell to their lowest level on record, as COVID-19-related moratoriums began to impact foreclosure inflows
• Prepayment activity jumped by nearly 40% in March, driven by record-low 30-year mortgage rates
• Note: For the purposes of this report going forward, the millions of homeowners who have since entered into forbearance will be counted as past due, but should not be reported as such to the credit bureaus by their servicers
emphasis added
The percent of loans in the foreclosure process decreased 7.7% in March and were down 18.0% over the last year.
Black Knight reported the U.S. mortgage delinquency rate (loans 30 or more days past due, but not in foreclosure) was 3.39% in March, up from 3.28% in February.
The percent of loans in the foreclosure process decreased in March to 0.42% from 0.45% in February.
The number of delinquent properties, but not in foreclosure, is down 111,000 properties year-over-year, and the number of properties in the foreclosure process is down 44,000 properties year-over-year.
| Black Knight: Percent Loans Delinquent and in Foreclosure Process | ||||
|---|---|---|---|---|
| Mar 2020 | Feb 2020 | Mar 2019 | Mar 2018 | |
| Delinquent | 3.39% | 3.28% | 3.65% | 3.73% |
| In Foreclosure | 0.42% | 0.45% | 0.51% | 0.63% |
| Number of properties: | ||||
| Number of properties that are delinquent, but not in foreclosure: | 1,792,000 | 1,737,000 | 1,903,000 | 1,191,000 |
| Number of properties in foreclosure pre-sale inventory: | 220,000 | 239,000 | 264,000 | 321,000 |
| Total Properties | 2,013,000 | 1,976,000 | 2,167,000 | 2,232,000 |


