by Calculated Risk on 7/24/2018 04:09:00 PM
Tuesday, July 24, 2018
Has the Housing Market Peaked? (Part 2)
On Friday I wrote: Has Housing Market Activity Peaked? I concluded
"I do not think housing has peaked, and I think new home sales and single family starts will increase further over the next couple of years."Since then we've seen several reports of softening existing home sales in a number of cities (Seattle, Portland, California, and more). And the NAR reported sales were down year-over-year in June, and probably more important that inventory was up year-over=year for the first time since June 2015.
And the CAR reported California: "Home sales stumble", Inventory up 8.1% YoY
As I noted last Friday, I think it is likely that existing home sales will move more sideways going forward. However it is important to remember that new home sales are more important for jobs and the economy than existing home sales. Since existing sales are existing stock, the only direct contribution to GDP is the broker's commission. There is usually some additional spending with an existing home purchase - new furniture, etc. - but overall the economic impact is small compared to a new home sale.
Also I think the growth in multi-family starts is behind us, and that multi-family starts peaked in June 2015. See: Comments on June Housing Starts
For the economy, what we should be focused on are single family starts and new home sales. As I noted in Investment and Recessions "New Home Sales appears to be an excellent leading indicator, and currently new home sales (and housing starts) are up solidly year-over-year, and this suggests there is no recession in sight."
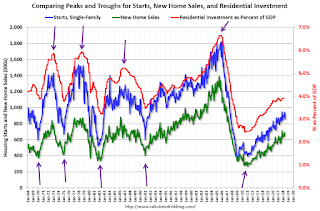
For the bottoms and troughs for key housing activity, here is a graph of Single family housing starts, New Home Sales, and Residential Investment (RI) as a percent of GDP.
 Click on graph for larger image.
The arrows point to some of the earlier peaks and troughs for these three measures.
The purpose of this graph is to show that these three indicators generally reach peaks and troughs together. Note that Residential Investment is quarterly and single-family starts and new home sales are monthly.
RI as a percent of GDP has been sluggish recently, mostly due to softness in multi-family residential. However, both single family starts and new home sales are still moving up (ignoring month-to-month fluctuations).
Also, look at the relatively low level of RI as a percent of GDP, new home sales and single family starts compared to previous peaks. To have a significant downturn from these levels would be surprising.
So my view remains: I do not think housing has peaked, and I think new home sales and single family starts will increase further over the next couple of years.


