by Calculated Risk on 8/18/2012 08:57:00 AM
Saturday, August 18, 2012
Summary for Week Ending August 17th
The economic data was a little more upbeat this week. Retail sales were up sharply in July (reversing the decline in June), housing starts were solid (running about 20% ahead of last year), industrial production increased, the 4-week for initial unemployment claims was near the post-recession low, homebuilder confidence improved, and even consumer sentiment ticked up a little.
Recently the most positive data has been housing related and I wrote this week: Even though housing starts are increasing, it is from a very low level, and 2012 will still be one of the worst years for housing starts (only 2009, 2010, and 2011 will be worse). Still, even with these weak sales, this is good news for the economy: housing starts are on pace to be up 20% from last year (how many sectors are growing 20% this year?), and housing starts could double again over the next several years.
This reminds me of the recovery for auto sales. Auto sales bottomed in February 2009 at close to a 9 million annual sales rate. Now auto sales are running at a 14 million pace; over a 50% increase. That strong increase in auto sales really contributed to GDP growth over the last few years, see from Cardiff Garcia at FT Alphaville: Car-driven GDP growth.
Now we are starting to see a rebound for housing. And housing will have an even larger impact on GDP and employment growth than autos; and housing will probably double from here (more than the 50% increase for autos). Barring policy mistakes in the US and Europe (a big IF), this improvement for housing suggests the economy will continue to grow. However the recovery in housing will probably be gradual.
Here is the take from Merrill Lynch on the economic impact of the housing recovery:
The housing market has become a bright spot for the US economy, offering glimmers of hope for a stronger recovery. The good news is that housing should provide a boost to the economy this year. The bad news is that it will likely be insufficient to save the rest of the economy. While we believe that the housing market has decidedly turned a corner and the recovery has begun, we think it will be a gradual recovery.Note: Merrill think GDP growth will slow over the next few quarters and remain sluggish through next year.
Here is a summary of last week in graphs:
• Housing Starts declined to 746 thousand in July
 Click on graph for larger image.
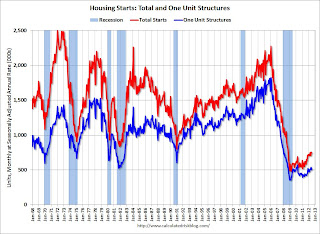
Total housing starts were at 746 thousand (SAAR) in July, down 1.1% from the revised June rate of 754 thousand (SAAR). Note that June was revised from 760 thousand.
Single-family starts decreased 6.5% to 502 thousand in July.
The second graph shows total and single unit starts since 1968.
 This shows the huge collapse following the housing bubble, and that total housing starts have been increasing lately after moving sideways for about two years and a half years.
 Total starts are up 56% from the bottom start rate, and single family starts are up 42% from the low.
This was slightly below expectations of 750 thousand starts in July, but the key is starts are up solidly from last year. Right now starts are on pace to be up about 20% from 2011. Also note that total permits were at the highest level since 2008.
• Retail Sales increased 0.8% in July
 On a monthly basis, retail sales were up 0.8% from June to July (seasonally adjusted), and sales were up 4.1% from July 2011. Ex-autos, retail sales increased 0.8% in July.
Sales for June were revised down to a 0.7% decrease (from 0.5% decrease).
This graph shows retail sales since 1992. This is monthly retail sales and food service, seasonally adjusted (total and ex-gasoline).
This was above the consensus forecast for retail sales of a 0.3% increase in July, and above the consensus for a 0.4% increase ex-auto.
This mostly just reversed the sharp decline in June.
• Industrial Production increased 0.6% in July, Capacity Utilization increased
 From the Fed: Industrial production and Capacity Utilization "Industrial production increased 0.6 percent in July after having risen 0.1 percent in both May and June. ... Capacity utilization for total industry moved up 0.4 percentage point to 79.3 percent, a rate 1.0 percentage point below its long-run (1972--2011) average."
This graph shows Capacity Utilization. This series is up 12.5 percentage points from the record low set in June 2009 (the series starts in 1967).
Capacity utilization at 79.3% is still 1.0 percentage points below its average from 1972 to 2010 and below the pre-recession levels of 80.6% in December 2007.
 The second graph shows industrial production since 1967.
Industrial production increased in July to 98.0. This is 17.4% above the recession low, but still 2.7% below the pre-recession peak.
The consensus was for Industrial Production to increase 0.5% in July, and for Capacity Utilization to increase to 79.2%. The increase in IP and Capacity Utilization was above expectations.
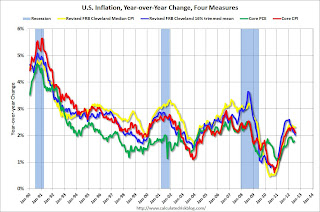
• Key Measures show slowing inflation in July
 On a year-over-year basis, the median CPI rose 2.3%, the trimmed-mean CPI rose 2.0%, and core CPI rose 2.1%. Core PCE is for June and increased 1.8% year-over-year.
 These measures suggest inflation is now at the Fed's target of 2% on a year-over-year basis and it appears the inflation rate is slowing. On a monthly basis (annualized), two of these measure were well below the Fed's target; trimmed-mean CPI was at 1.3%, Core CPI at 1.1% - although median CPI was at 2.5% and and Core PCE for June was at 2.5%. Based on initial data - and comparing to the increase in August 2011 - it is very likely that the August report will show a further decline in the year-over-year inflation rate.
• Weekly Initial Unemployment Claims increase to 366,000
 The DOL reports:" In the week ending August 11, the advance figure for seasonally adjusted initial claims was 366,000, an increase of 2,000 from the previous week's revised figure of 364,000. The 4-week moving average was 363,750, a decrease of 5,500 from the previous week's revised average of 369,250."
 This graph shows the 4-week moving average of weekly claims since January 2000. The dashed line on the graph is the current 4-week average.
This was at the consensus forecast of 365,000.
The 4-week average post-bubble low is 363,000; this week the average was just above that level at 363,750.
• Consumer Sentiment increases in August to 73.6
 The preliminary Reuters / University of Michigan consumer sentiment index for August increased to 73.6, up from the July reading of 72.3.
This was above the consensus forecast of 72.0 but still fairly low. Sentiment remains weak due to the high unemployment rate and sluggish economy - and rising gasoline prices probably aren't helping.
• Other Economic Stories ...
• July Update: Early Look at 2013 Cost-Of-Living Adjustments indicates 1% increase
• NAHB Builder Confidence increases in August, Highest since February 2007
• House Prices and a Foreclosure Supply Shock
• Comment on Housing, and Starts and Completions
• State Unemployment Rates increased in 44 States in July
• Quarterly Housing Starts by Intent compared to New Home Sales
• Jackson Hole Economic Symposium 2012 Dates


