by Calculated Risk on 8/15/2012 10:00:00 AM
Wednesday, August 15, 2012
NAHB Builder Confidence increases in August, Highest since February 2007
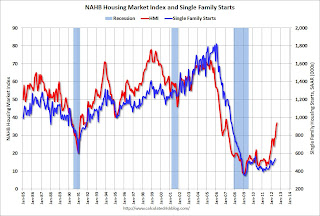
The National Association of Home Builders (NAHB) reported the housing market index (HMI) increased 2 points in August to 37. Any number under 50 indicates that more builders view sales conditions as poor than good.
From the NAHB: Builder Confidence Continues To Improve in August
Builder confidence in the market for newly built, single-family homes improved for a fourth consecutive month in August with a two-point gain to 37 on the National Association of Home Builders/Wells Fargo Housing Market Index (HMI), released today. This gain builds on a six-point increase in July and brings the index to its highest level since February of 2007.
“From the builder’s perspective, current sales conditions, sales prospects for the next six months and traffic of prospective buyers are all better than they have been in more than five years,” said Barry Rutenberg, chairman of the National Association of Home Builders (NAHB) and a home builder from Gainesville, Fla. “While there is still much room for improvement, we have come a long way from the depths of the recession and the outlook appears to be brightening.”
...
Every HMI component posted gains in August. The components gauging current sales conditions and traffic of prospective buyers each rose three points, to 39 and 31, respectively, while the component gauging sales expectations in the next six months inched up one point to 44. All were at their highest levels in more than five years.
Regionally, builder confidence rose nine points to 42 in the Midwest and two points to 35 in the South, but declined nine points to 25 in the Northeast and three points to 40 in the West in August. For the August HMI release, NAHB is introducing an alternative trend comparison of regional HMIs by also showing a three-month moving average of each region’s index. The current three-month moving averages show a two-point decline to 29 in the Northeast, a five-point gain to 35 in the Midwest, a three-point gain to 32 in the South and a three-point gain to 38 in the West.
 Click on graph for larger image.
This graph compares the NAHB HMI (left scale) with single family housing starts (right scale). This includes the August release for the HMI and the June data for starts (July housing starts will be released tomorrow). A reading of 37 was above the consensus.


