by Calculated Risk on 12/19/2011 10:00:00 AM
Monday, December 19, 2011
NAHB Builder Confidence index increases in December
The National Association of Home Builders (NAHB) reports the housing market index (HMI) increased in December to 21 from 19 in November. Any number under 50 indicates that more builders view sales conditions as poor than good.
From the NAHB: Builder Confidence Rises for the Third Consecutive Month
Builder confidence in the market for newly built, single-family homes edged up two points from a downwardly revised number to 21 on the National Association of Home Builders/Wells Fargo Housing Market Index (HMI) for December, released today. This marks a third consecutive month in which builder confidence has improved, and brings the index to its highest point since May of 2010.
...
“This is the first time that builder confidence has improved for three consecutive months since mid-2009, which signifies a legitimate though slowly emerging upward trend,” said NAHB Chief Economist David Crowe. “While large inventories of foreclosed properties continue to plague the most distressed markets and consumer worries about job security and the challenges of selling an existing home remain significant factors, builders are reporting more inquiries and more interest among potential buyers than they have seen in previous months.”
...
Each of the HMI’s three component indexes registered a third consecutive month of improvement in December. The component gauging current sales conditions rose two points in the latest month to 22, while the component gauging sales expectations in the next six months edged up one point to 26. The component gauging traffic of prospective buyers gained three points to 18, which is its highest level since May of 2008.
Builder confidence primarily gained strength in the South in December, where a four-point gain to 25 brought that region’s HMI score to its highest level since March of 2008. A one-point gain to 16 was registered in the West, while the Midwest held unchanged at 24 and the Northeast slipped one point to 15.
 Click on graph for larger image.
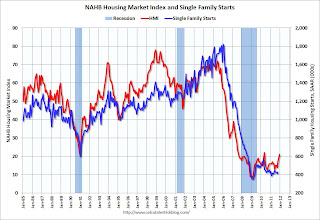
This graph compares the NAHB HMI (left scale) with single family housing starts (right scale). This includes the December release for the HMI and the October data for starts (November housing starts will be released tomorrow).
Both confidence and housing starts have been moving sideways at a very depressed level for several years - but confidence seems to be moving up a little now. This is still very low, but this is the highest level since May 2010 - and that boost was due to the housing tax credit. Not counting the tax credit, the last time the index was above this level was in 2007.
Weekend:
• Summary for Week ending Dec 16th
• Schedule for Week of Dec 18th
• Ten Economic Questions for 2012


