by Calculated Risk on 5/23/2008 11:39:00 AM
Friday, May 23, 2008
More on April Existing Home Sales and Inventory
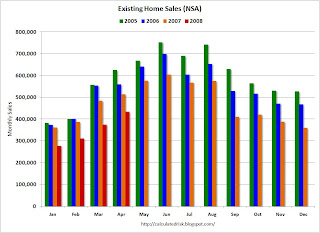
For more, see my earlier post: April Existing Home Sales Click on graph for larger image.
The first graph is Not Seasonally Adjusted sales by month for the last few years. This shows that sales have plunged in April 2008 compared to the previous three years.
April is an important month for existing home sales, and is part of the spring selling season. The next four months - May through August - are typically the strongest selling months of the year. Existing home sales are recorded at the close of escrow, and most homebuyers want to move during the summer months.
For forecasting, probably the most important number in the existing home sales report is inventory; houses listed for sale. For April, the NAR reported inventory at 4.552 million units, an all time record high for April.
This tells us nothing about the number of distressed homes for sale (REOs, short sales). It also says nothing about homeowners waiting for a 'better market'. But the NAR inventory report does provide a general idea of the supply side of the 'supply and demand' equation.
See the earlier post for a graph of inventory. The second graph shows the seasonal pattern for inventory for the last few years (based on year end inventory from the previous year).
Note: the NAR doesn't seasonally adjust inventory.
This suggests that the inventory build so far this year has been about normal, and it is reasonable to expect inventory levels to continue to increase into the summer.
My guess is existing home inventory will peak in mid-summer at around 5 million units. This will probably put the months of supply over 12 months.
BTW, the all time record high for inventory, for any month, was July 2007 at 4.561 million units. That will probably be broken in May.


