 RSS Feed
 by Calculated Risk on 3/09/2011 09:00:00 AM
Showing posts with label transportation. Show all posts
Showing posts with label transportation. Show all posts
Wednesday, March 09, 2011
Ceridian-UCLA: Diesel Fuel index decreases in February
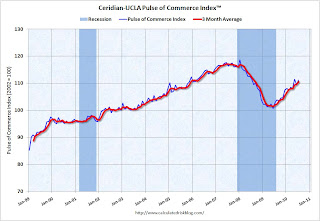
This is the new UCLA Anderson Forecast and Ceridian Corporation index using real-time diesel fuel consumption data: Pulse of Commerce IndexTM
 Click on graph for larger image in new window.
This graph shows the index since January 2000.
Press Release: February PCI Continues to Signal Slow Growth
The Ceridian-UCLA Pulse of Commerce Index™ (PCI), issued today by the UCLA Anderson School of Management and Ceridian Corporation fell 1.5% on a seasonally and workday adjusted basis in February, after falling 0.3% in January. The PCI in the first two months of 2011 has now given up all of December’s exceptional 1.8% gain. Because of the very strong performance in December, however, the three month annualized moving average in the index was still up 5.4% over the previous three month period. Furthermore, February marked the 15th consecutive month of year-over-year growth in the index. Both of these data points suggest that the economic recovery is intact, but it remains tepid.This index was useful in tracking the slowdown last summer and the back-to-back monthly declines in this index are concerning. The rail traffic reports have shown a shift to intermodal traffic (more rail traffic using shipping containers) and that might be negatively impacting the diesel fuel index.
...
Over time, the PCI has shown a strong correlation with Industrial Production and with the goods components of GDP. The PCI results over the past two months suggest a small decline in industrial production in February when that data is released by the Federal Reserve on March 17.
...
The February daily data were impacted by the massive snowstorm that was centered in the heavily-trucked Midwest early in the month. However, the daily data also suggests that much of the volume that was “lost” during the first week of the month was “found” later in the month, meaning that weather was not the major reason for the decline in the PCI this month.
...
February’s spike in fuel prices likely did not contribute to weakness in the PCI this month. However, if the trend persists, higher prices will likely have an impact in the coming months as consumers are robbed of spending power. As a leading indicator for shipping and production, the PCI is very sensitive to this dynamic and should provide an early indication as higher fuel prices impact the broader economy.
...
The Ceridian-UCLA Pulse of Commerce Index™ is based on real-time diesel fuel consumption data for over the road trucking ...
Note: This index does appear to track Industrial Production over time (with plenty of noise) and this suggests a weak reading for February. Industrial Production for February will be released March 17th.
Wednesday, February 23, 2011
ATA Truck Tonnage Index increased in January
by Calculated Risk on 2/23/2011 06:22:00 PM
From the American Trucking Association: ATA Truck Tonnage Index Surged 3.8 Percent in January
The American Trucking Associations’ advance seasonally adjusted (SA) For-Hire Truck Tonnage Index increased 3.8 percent in January after rising a revised 2.5 percent in December 2010. The latest jump put the SA index at 117.1 (2000=100) in January, which was the highest level since January 2008. In December, the SA index equaled 112.7.
...
ATA Chief Economist Bob Costello said that he was very pleased with January’s robust gain, especially considering the winter storms during the month. “Many fleets told us that freight was solid in January, although operations were as challenge due to the winter storms that hit large parts of the country.” Costello also stated that the latest tonnage numbers indicate that the economy is growing at a good clip early in 2011 and he expects a solid first half of the year. “At this point, the biggest threat is the recent run-up in oil prices, which could dampen consumer spending.”
 Click on map for graph gallery.
This graph from the ATA shows the Truck Tonnage Index since Jan 2007.
This is the highest level since January 2008 - and truck tonnage is increasing again after stalling out last spring and summer. I agree with Costello that the biggest short term threat to the economy is high oil prices.
Earlier posts on existing home sales and home prices:
• January Existing Home Sales: 5.36 million SAAR, 7.6 months of supply
• Existing Home Inventory increases 3.1% Year over Year
• Real House Prices fall to 2000 Levels, Update on NAR Overstating Sales
• Case-Shiller: National Home Prices Are Close to the 2009Q1 Trough
• House Prices: Price-to-rent, Price-to-median Household Income
Wednesday, February 09, 2011
Ceridian-UCLA: Diesel Fuel index decreases slightly in January
by Calculated Risk on 2/09/2011 09:00:00 AM
This is the new UCLA Anderson Forecast and Ceridian Corporation index using real-time diesel fuel consumption data: Pulse of Commerce IndexTM
 Click on graph for larger image in new window.
This graph shows the index since January 2000.
Press Release: PCI Posts 14th Consecutive Month of Year-Over-Year Growth
The Ceridian-UCLA Pulse of Commerce Index™ (PCI), issued today by the UCLA Anderson School of Management and Ceridian Corporation fell 0.3% on a seasonally and monthly workday adjusted basis in January, giving up some of December’s exceptional 1.8% sequential gain. Because of the very strong December showing, the three-month annualized moving average is up 5.1% and gaining strength.Note: This index does appear to track Industrial Production over time (with plenty of noise). Industrial Production for December will be released February 16th.
...
The combined effect of very strong sequential gains in December and holding onto most of those gains in January suggest growth in industrial production for January equal to 0.3% when reported on February 16th.
...
The Ceridian-UCLA Pulse of Commerce Index™ is based on real-time diesel fuel consumption data for over the road trucking ...
Tuesday, February 08, 2011
A Dab of Color: Transportation
by Calculated Risk on 2/08/2011 06:45:00 PM
After my "D-List Data" post, I've received several requests to try to create a list of economic data by priority. I'm working on it, in the meantime, here is some more data for D-List.
I follow three measures of transportation: rail traffic, trucking and a diesel fuel index (Ceridian-UCLA Pulse of Commerce Index). I also occasionally review press releases for UPS and FedEx for comments on the economy and forecasts.
This is not primary data, but it is sometimes helpful in confirming other data. As an example, last year I was looking for a mid-year / 2nd half slowdown, and the transportation data was useful in confirming the slowdown was happening.
These indicators mostly improved towards the end of the year, confirming the brighter outlook.
The January rail traffic report released today by the Association of American Railroads suggests the economy expanded further in January. The January Pulse of Commerce Index (PCI) will be released tomorrow morning at 9 AM ET.
The PCI is also somewhat correlated to Industrial Production (IP) from the Federal Reserve (although the relationship is a bit noisy). So the release tomorrow will give us a hint on January IP to be released on Wednesday Feb 16th.
Finally, rail traffic is an example of excess capacity in the economy. The railroad companies are always investing in maintenance and repairs, but investment in new equipment will probably not pick up significantly until traffic starts to approach the levels seen in 2006 – the peak year (still a long ways to go).
Here is the graph gallery for transportation.
AAR: Rail Traffic increases in January
by Calculated Risk on 2/08/2011 03:59:00 PM
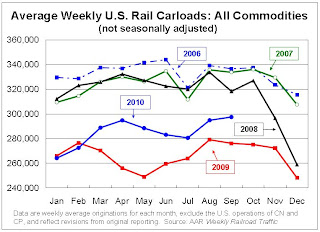
From the Association of American Railroads: January Freight Rail Traffic Continues Steady Growth. The AAR reports carload traffic in January 2011 was up 8.0% compared to January 2010. Intermodal traffic (using intermodal or shipping containers) is up 7.4% over January 2010.
U.S. freight railroads originated an average of 285,573 carloads per week in January 2011, for a total of 1,142,293 carloads for the month. That’s up 8.0% over January 2010 and up 7.3% over January 2009. That sounds like a nice gain — and it is — but to keep it in perspective, other than 2009 and 2010 it’s still the lowest January average since 1994.
 Click on graph for larger image in new window.
This graph shows U.S. average weekly rail carloads (NSA).
From AAR:
• On an unadjusted basis, 15 of the 20 commodity categories saw carload gains on U.S. railroads in January 2011 compared with January 2010. The five commodity categories seeing declines — grain mill products, primary forest products, coke, nonmetallic minerals, and waste and non-ferrous scrap — together accounted for less than 8% of total carloads for the month. The highest-volume commodity categories were all up in January.As the first graph shows, rail carload traffic collapsed in November 2008, and now, over 18 months into the recovery, carload traffic has only recovered part way.
 The second graph is for intermodal traffic (using intermodal or shipping containers):
• In January 2011, U.S. railroads originated 863,099 intermodal trailers and containers, an average of 215,775 per week — up 7.4% over January 2010, up 10.1% over January 2009, and the third highest January average in history(behind January 2006 and January 2007).Traffic is increasing slowly, but combined traffic is still well below the 2008 levels.
• Growth in intermodal traffic is a function both of a growing economy
and growing international trade as well as conversion of freight from over-the-highway moves to rail intermodal moves.
excerpts with permission
Tuesday, January 11, 2011
Ceridian-UCLA: Diesel Fuel index increases in December
by Calculated Risk on 1/11/2011 09:00:00 AM
This is the new UCLA Anderson Forecast and Ceridian Corporation index using real-time diesel fuel consumption data: Pulse of Commerce IndexTM
 Click on graph for larger image in new window.
This graph shows the index since January 1999.
Press Release: Year-End Surge Reported in Latest Ceridian-UCLA Pulse of Commerce Index™
The Ceridian-UCLA Pulse of Commerce Index™ (PCI), a real-time measure of the flow of goods to U.S. factories, retailers and consumers, surged 2.4 percent in December and pushed the PCI above its previous 2010 peak established in May. This performance, combined with November’s 0.4 percent increase, was enough to offset three previous consecutive months of decline.Note:
“The latest PCI data further evidences the positive economic sentiment felt since the start of the New Year,” explained Ed Leamer, chief PCI economist and director of the UCLA Anderson Forecast. “However, we have not entirely escaped the summer doldrums as the three-month moving average is still below its July 2010 level.”
...
The PCI tracks closely on a monthly basis to the Industrial Production Index (to be released later this month) and GDP. Though the forecasts for subsequent growth remain weak, the December surge translates into a very favorable growth of industrial production by .6 percent. Similarly, the PCI outlook for fourth quarter 2010 GDP is more optimistic, but is still expected to be less than current consensus estimates.
...
The Ceridian-UCLA Pulse of Commerce Index™ is based on real-time diesel fuel consumption data for over the road trucking ...
I'm not confident in using this index to forecast GDP growth, although it does appear to track Industrial Production over time (with plenty of noise). Industrial Production for December will be released on Friday.
Monday, December 06, 2010
AAR: November Rail Traffic shows "mixed progress"
by Calculated Risk on 12/06/2010 05:15:00 PM
From the Association of American Railroads: AAR Reports November 2010 Rail Traffic Continues Mixed Progress. The AAR reports carload traffic in November 2010 was up 4.5% compared to November 2009, however carload traffic was still lower than in November 2008. Intermodal traffic (using intermodal or shipping containers) is up 11.3% over November 2009 and up slightly over November 2008.
"Even though U.S. rail volumes were down in November from October levels — due largely to Thanksgiving — November marks the 11th straight month in which rail volumes were higher than year-earlier levels. That hasn’t happened since January 2006," said AAR Senior Vice President John Gray. "Granted, 2009 was a bad year for rail traffic, but like the economy in general, rail traffic has been slowly improving. We’re hopeful that recent gains in consumer confidence and some recent encouraging signs regarding consumer spending will mean a continuation of economic growth and further growth in rail traffic."
While railroads continue to bring employees back to work and cars out of storage, data show the pace slowed slightly in recent months. During the month of October, the most recent period for industry employment data, railroads added 191 people to the employee rolls. Railroads brought 465 rail cars out of storage in November, with 317,810 cars, or roughly 20.8 percent of the North American railcar fleet, still in storage.
 Click on graph for larger image in new window.
This graph shows U.S. average weekly rail carloads (NSA). Traffic increased in 14 of 19 major commodity categories year-over-year.
From AAR:
• U.S. freight railroads originated an average of 284,407 carloads per week in November 2010 (see chart below left), for a total of 1,137,626 carloads for the month. That’s up 4.5% over November 2009. November was the ninth straight month with higher year-over-year average weekly rail carloads, something that hasn’t happened since 2004.As the first graph shows, rail carload traffic collapsed in November 2008, and now, over a year into the recovery, carload traffic has only recovered part way.
• On a seasonally adjusted basis, U.S. rail carloads were down 1.1% in November 2010 from October 2010. Seasonally-adjusted carloads on U.S. carriers have fallen (though by relatively small amounts) three of the past four months.
 The second graph is for intermodal traffic (using intermodal or shipping containers):
• On a non-seasonally adjusted basis, there is always a big decline in intermodal traffic in November from October, partly because many of the goods retailers stock for holiday sales are shipped in September and October and partly because of Thanksgiving. The week including Thanksgiving this year was the lowest-volume intermodal week of the year for U.S. railroads.The small seasonally adjusted declines suggest the recovery is very sluggish, or has even stalled, over the last few months.
• Seasonally adjusted U.S. rail intermodal traffic was down 0.4% in November 2010 from October 2010, its third straight monthly decline. As with carloads, recent declines have been small.
excerpts with permission
Note: The Ceridian-UCLA diesel fuel index for November will be released tomorrow.
Wednesday, November 24, 2010
ATA: Truck Tonnage Index increases in October
by Calculated Risk on 11/24/2010 07:15:00 PM
Earlier post: New Home Sales decline in October
From the American Trucking Association: ATA Truck Tonnage Index Rose 0.8 Percent in October
The American Trucking Associations’ advance seasonally adjusted (SA) For-Hire Truck Tonnage Index rose 0.8 percent in October after increasing a revised 1.8 percent in September. The latest gain put the SA index at 109.7 (2000=100) in October from 108.9 in September.
...
ATA Chief Economist Bob Costello said that truck tonnage changes over the last couple months shows there are some bright spots in the U.S. economy. “October tonnage levels were at the highest level in three months, even after accounting for typical seasonal shipping patterns. These gains fit with reports out of both the manufacturing and retail sectors and show there is a little bit of life in this economic recovery."
 Click on map for larger image.
This graph from the ATA shows the Truck Tonnage Index since Jan 2006.
The line is added to show the index has been mostly moving sideways this year.
Monday, November 08, 2010
AAR: October 2010 Rail Traffic Continues Mixed Progress
by Calculated Risk on 11/08/2010 05:06:00 PM
From the Association of American Railroads: October 2010 Rail Traffic Continues Mixed Progress. The AAR reports carload traffic in October 2010 was up 8.7% compared to October 2009, however carload traffic was still 7.9% lower than in October 2008. Intermodal traffic (using intermodal or shipping containers) is up 10.4% over October 2009 and up 1.2% over October 2008.
"Last week the government announced that GDP grew roughly two percent in the third quarter of 2010. Rail traffic in October suggests that similarly moderate growth is continuing into the fourth quarter," said AAR Senior Vice President John T. Gray.
 Click on graph for larger image in new window.
This graph shows U.S. average weekly rail carloads (NSA). Traffic increased in 15 of 19 major commodity categories year-over-year.
From AAR:
• U.S. freight railroads originated 1,196,432 carloads in October 2010, an average of 299,108 carloads per week. That’s up 8.7% from October 2009 and down 7.9% from October 2008 on a non-seasonally adjusted basisAs the first graph shows, rail carload traffic collapsed in November 2008, and now, a year into the recovery, carload traffic has only recovered half way. However intermodal has performed better ...

• On a non-seasonally adjusted basis, October is usually the highest intermodal month of the year for U.S. railroads. That’s the case again in 2010This is consistent with a sluggish recovery.
• Well over half of U.S. intermodal traffic consists of imports or exports, and growth in international trade is a major factor behind higher intermodal traffic so far this year. In the first nine months of 2010, import TEUs (twenty-foot equivalent units) at six of the largest U.S. ports — Los Angeles, Long Beach, Savannah, New York & New Jersey, Seattle, and Norfolk — rose 19.9% in aggregate compared with the first nine months of 2009. Export TEUs at the same ports were up 15.5% in aggregate.excerpts with permission
Note: The Ceridian-UCLA diesel fuel index for October will be released tomorrow.
Monday, October 11, 2010
Rail Intermodal Traffic at 2008 levels, Carload Traffic Lags
by Calculated Risk on 10/11/2010 06:06:00 PM
From the Association of American Railroads: Rail Time Indicators. The AAR reports carload traffic in September 2010 was up 7.7% compared to September 2009 - and carload traffic was 7.5% lower than in September 2008. Intermodal traffic (using intermodal or shipping containers) is up up 17.3% over September 2009 and up 0.2% over September 2008.
 Click on graph for larger image in new window.
This graph shows U.S. average weekly rail carloads (NSA). Traffic increased in 16 of 19 major commodity categories year-over-year.
From AAR:
• U.S. freight railroads originated 1,487,511 carloads in September 2010, an average of 297,502 carloads per week. That’s up 7.7% from September 2009 and down 7.5% from September 2008 on a non-seasonally adjusted basis. It’s also the highest weekly average for any month since October 2008.As the graph above shows, rail carload traffic collapsed in November 2008, and now, a year into the recovery, carload traffic has only recovered half way. However ...
• Average unadjusted weekly carloads are typically lower in September than in August because of the Labor Day holiday. This year, though, September’s weekly unadjusted average (297,502) was higher than August’s (294,862). Why? The week with Labor Day was, as usual, one of the lowest-volume weeks of the year, but the other four weeks in September 2010 were all among the six highest-volume weeks of the year. The top two weeks so far in 2010 were in September.
• That explains why seasonally adjusted U.S. rail carloads were up 1.9% in September 2010 over August 2010, reaching their highest level since November 2008.

• U.S. railroads originated 1,165,288 intermodal trailers and containers in September 2010, an average of 233,058 per week on an unadjusted basis. That’s down slightly from August 2010, but that’s just due to Labor Day. The four non-Labor Day weeks in September were four of the top five intermodal weeks so far in 2010. September 2010 intermodal traffic was up 17.3% over September 2009 and up 0.2% over September 2008.The increase in intermodal traffic, along with the increase in West Coast port import traffic, are two of the indicators that suggest retailers might have over-ordered for the holidays. Stephanie Clifford and Catherine Rampell mentioned this possibility in the NY Times article last week: Dim Outlook for Holiday Jobs
• On an unadjusted basis, September is traditionally the second (sometimes third) highest-volume month of the year for intermodal, behind October. Intermodal peaks in the fall as retailers stock up for the holidays.
excerpts with permission
While retailers are just now making plans for Christmas hiring, they had to make plans for Christmas merchandise months ago, and that lag might create some inventory problems.
In the first part of the year, the economic picture looked much brighter. ... That was at about the same time that retailers had to order holiday merchandise because of the time it takes to produce and ship the inventory.
And recent traffic at the nation’s ports suggests that retailers made optimistic bets.
Wednesday, August 25, 2010
ATA: "Truck freight tonnage has essentially gone sideways since April 2010"
by Calculated Risk on 8/25/2010 06:31:00 PM
From the American Trucking Association: ATA Truck Tonnage Index Rose 1.5 Percent in July
The American Trucking Associations’ advance seasonally adjusted (SA) For-Hire Truck Tonnage Index increased 1.5 percent in July, although June’s reduction was revised from 1.4 percent to 1.6 percent. The latest improvement raised the SA index from 108.3 (2000=100) in June to 110 in July.
...
Compared with July 2009, SA tonnage climbed 7.4 percent, which matched June’s increase and was the eighth consecutive year-over-year gain. Year-to-date, tonnage is up 6.7 percent compared with the same period in 2009.
ATA Chief Economist Bob Costello said that July’s data didn’t change his outlook for subdued tonnage growth in the months ahead, stating, “The economy is slowing and truck freight tonnage has essentially gone sideways since April 2010.”

This graph from the ATA shows the Truck Tonnage Index since Jan 2006 (no larger image).
This index has been moving sideways for several months ...
Wednesday, August 11, 2010
Ceridian-UCLA: Diesel Fuel index increases in July
by Calculated Risk on 8/11/2010 04:30:00 PM
This is the new UCLA Anderson Forecast and Ceridian Corporation index using real-time diesel fuel consumption data: Pulse of Commerce IndexTM
Press Release: PCI Climbs in July, Confirming Economy’s Slow but Steady Recovery
All signs continue to point to an economy in recovery with the latest release of the Ceridian-UCLA Pulse of Commerce Index™ (PCI) by UCLA Anderson School of Management. The July PCI climbed 1.7 percent after dropping 1.9 percent in June.
...
“The key takeaway from the July report is that the economy continues to recover – which is encouraging – but the pace needs to substantially pick up to put people back to work,” said Ed Leamer, chief PCI economist. “With the unemployment rate still at 9.5 percent and consumers understandably nervous about opening their wallets, it is hard to be very optimistic about economic growth. On the other hand, there is nothing about the PCI that is supportive of the pessimistic double-dip view.”
...
The PCI is based on an analysis of real-time diesel fuel consumption data from over the road trucking tracked by Ceridian ...
 Click on graph for larger image in new window.
This graph shows the index since January 1999.
This is a new index and doesn't have much of a track record in real time - although it appears to suggest that the sluggish recovery was continuing in July.
Monday, August 09, 2010
Rail Traffic increases 4.1% in July compared to July 2009
by Calculated Risk on 8/09/2010 04:15:00 PM
From the Association of American Railroads: Rail Time Indicators. The AAR reports traffic in July 2010 was up 4.1% compared to July 2009 - and traffic was 14.6% lower than in July 2008.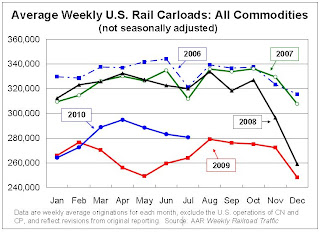 Click on graph for larger image in new window.
This graph shows U.S. average weekly rail carloads (NSA). Traffic increased in 14 of 19 major commodity categories year-over-year.
From AAR:
• U.S. freight railroads originated 1,122,308 carloads in July 2010, an average of 280,577 carloads per week — up 4.1% from July 2009 (see chart) but down 14.6% from July 2008 on a non-seasonally adjusted basis.As the graph above shows, rail traffic collapsed in November 2008, and now, a year into the recovery, traffic has only recovered part way.
• On a seasonally adjusted basis, U.S. rail carloads rose 3.2% in July 2010 from June 2010 after falling 1.2% in June 2010 and 0.9% in May 2010. The seasonally adjusted weekly average of 289,320 carloads in July 2010 was the highest such figure since November 2008.
excerpts with permission
Seasonally there is usually a decline in traffic in July, so seasonally adjusted traffic increased last month. However traffic is only up 4.1% compared to July 2009.
Tuesday, July 13, 2010
Rail Traffic softens further in June
by Calculated Risk on 7/13/2010 03:20:00 PM
From the Association of American Railroads: Rail Time Indicators. The AAR reports traffic in June 2010 was up 10.6% compared to June 2009 - but traffic was still 10.2% lower than in June 2008. Click on graph for larger image in new window.
This graph shows U.S. average weekly rail carloads. Traffic increased in 16 of 19 major commodity categories year-over-year.
From AAR:
• U.S. freight railroads originated 1,415,630 carloads in June 2010, an average of 283,126 carloads per week — up 10.6% from June 2009 (see chart) but down 10.2% from June 2008 on a non-seasonally adjusted basis.As the graph above shows, rail traffic collapsed in November 2008, and now, a year into the recovery, traffic has only recovered about half way. This is more evidence of a sluggish recovery ... also the declines in May and June are concerning although the declines were small.
• On a seasonally adjusted basis, U.S. rail carloads fell 1.3% in June 2010 from May 2010, following a 1.1% decline in May 2010 from April 2010. After bottoming out in May 2009, seasonally adjusted rail carloads trended upward, with some fits and starts along the way, through April 2010. They’ve now declined for two consecutive months.
• The declines in rail carloads over the past couple months have not been huge, and they certainly don’t prove that the wheels are coming off the economy’s bus.
• That said, an economy several months into a recovery from the worst recession in decades should be yielding rail traffic levels heading north, not south. (Remember, demand for rail service occurs as a result of demand elsewhere in the economy for the products that railroads haul.) Thus, rail traffic in June 2010 is consistent with an economy that is in far better shape than it was nine months or a year ago, but is, in the words of former Federal Reserve Chairman Alan Greenspan, “more than likely” undergoing a “pause.
excerpts with permission
Ceridian-UCLA: Diesel Fuel index Falls Sharply in June
by Calculated Risk on 7/13/2010 08:20:00 AM
This is the new UCLA Anderson Forecast and Ceridian Corporation index using real-time diesel fuel consumption data: Pulse of Commerce IndexTM
Press Release: Amid Fears of Double-Dip Recession, PCI Falls Sharply in June
The Ceridian-UCLA Pulse of Commerce Index™ (PCI) by UCLA Anderson School of Management tumbled 1.9 percent in June after its impressive 3.1 percent gain in May.
...
“While June’s number is substantially down, erasing two-thirds of May’s great gain, the daily and weekly activity on which the monthly PCI is based does not suggest that the economy is heading over a cliff,” said [PCI Chief Economist Edward Leamer]. “Part of the apparent strength of May and weakness in June is the result of the Memorial Day holiday occurring on the last day of May, allowing the negative Memorial Day effect which is usually confined to May to leak into June. More importantly, the June weakness was confined to the first two weeks, and by the second half of June, we were seeing strong growth again.”
...
The PCI is based on an analysis of real-time diesel fuel consumption data ...
 Click on graph for larger image in new window.
This graph shows the index since January 1999.
The decline in June is just one month (partially offsetting the large increase in May), and the three month average is still increasing.
Note: This index appears to lead Industrial Production (IP), but there is a significant amount of monthly noise. This is a new index and is something to follow along with other transportation data.
Friday, June 25, 2010
ATA Truck Tonnage Index declines in May
by Calculated Risk on 6/25/2010 12:59:00 PM
From the American Trucking Association: ATA Truck Tonnage Index Fell 0.6 Percent in May
The American Trucking Associations’ advance seasonally adjusted (SA) For-Hire Truck Tonnage Index decreased 0.6 percent in May, which was the first month-to-month drop since February of this year. This followed an upwardly revised 1 percent increase in April. The latest reduction put the SA index at 109.6 (2000=100).
...
Compared with May 2009, SA tonnage increased 7.2 percent, which was the sixth consecutive year-over-year gain. In April, the year-over-year increase was 9.5 percent. Year-to-date, tonnage is up 6.2 percent compared with the same period in 2009.
ATA Chief Economist Bob Costello said that truck freight tonnage is going to have ups and downs, but the trend continues in the right direction. “Despite the month-to-month drop in May, the trend line is still solid. There is no way that freight can increase every month, and we should expect periodic decreases. This doesn’t take away from the fact that freight volumes are quite good, especially considering the reduction in truck supply over the last couple of years.”
 This graph from the ATA shows the Truck Tonnage Index since Jan 2006 (no larger image).
 This index has only shown a gradual increase since December.
Rail traffic was also soft in May.
Thursday, June 10, 2010
Ceridian-UCLA: Diesel Fuel index increases sharply in May
by Calculated Risk on 6/10/2010 11:20:00 AM
This is the new UCLA Anderson Forecast and Ceridian Corporation index using real-time diesel fuel consumption data: Pulse of Commerce IndexTM
Press Release: PCI Strikes Optimistic Note For U.S. Economy with 3.1 Percent Gain in May
With a monthly increase not seen since February 1999, the Ceridian-UCLA Pulse of Commerce Index™ (PCI) by UCLA Anderson School of Management climbed 3.1 percent in May. The increase represents the strongest indicator yet from the PCI that the U.S. economy is on the upswing.
...
“Absent good news from the usual recovery indicators – consumer optimism expressed by buying homes and cars, and business optimism expressed by hiring – the spike in the PCI is indeed very welcome news for the economy,” said Ed Leamer, the PCI’s chief economist. “One month does not make a trend, but at least we are back in a recovery groove.”
The May result makes up for April’s decline of 0.3 percent and for the PCI’s flat, overall performance during the first four months of 2010.
...
The PCI is based on an analysis of real-time diesel fuel consumption data ...
 Click on graph for larger image in new window.
This graph shows the index since January 1999.
Note: This index appears to lead Industrial Production (IP), but there is a significant amount of monthly noise. This is a new index and might be interesting to follow along with the Trucking and Railroad data.
Here is a video of Leamer's comments on the report. After a few months of almost no growth, this index increased sharply in May.
Monday, June 07, 2010
Rail Traffic Softens in May
by Calculated Risk on 6/07/2010 03:49:00 PM
From the Association of American Railroads: Rail Time Indicators. The AAR reports traffic in May 2010 was up 15.8% compared to May 2009 - and traffic was still 11.8% lower than in May 2008. Click on graph for larger image in new window.
This graph shows U.S. average weekly rail carloads. Traffic increased in 18 of 19 major commodity categories YoY.
From AAR:
• U.S. freight railroads originated 1,153,675 carloads in May 2010, an average of 288,419 carloads per week. That’s up 15.8% from May 2009 (which is the second highest percentage gain ever, behind April 2010 — see chart ...) but down 11.8% from May 2008.As the graph above shows, rail traffic collapsed in November 2008, and now eleven months into the recovery, traffic has only recovered about half way. This is more evidence of a sluggish recovery ... and the decline in May is concerning, although one month does not make a trend (and May was "a bit overstated" due to the timing of Memorial Day).
• U.S. railroads averaged 294,758 carloads per week in April 2010 and 288,793 in March 2010. Thus, May 2010’s average was actually down slightly from those months ... One month does not a trend make, but it would obviously be worrisome if the decline continued.
• As was the case in April 2010, the big year-over-year percentage gains in May 2010 U.S. rail traffic were partly a function of easy comparisons (May 2009 was a miserable month for rail traffic) and partly a function of real traffic growth.
• For the purposes of AAR rail traffic data, May 2010 consists of the four weeks ending May 29 — i.e., it does not include Memorial Day, which was May 31 this year. However, the May 2009 and May 2008 comparison months do include Memorial Day. The net result is that May 2010 data is a bit overstated relative to the two previous years, and June 2010 will be a bit understated relative to the two previous years. It is impossible to know exactly how much rail traffic is affected.
excerpts with permission
Saturday, May 29, 2010
ATA Truck Tonnage index increases in April
by Calculated Risk on 5/29/2010 08:49:00 AM
From the American Trucking Association: ATA Truck Tonnage Index Increased 0.9 Percent in April
The American Trucking Associations’ advance seasonally adjusted (SA) For-Hire Truck Tonnage Index increased for the sixth time in the last seven months, gaining another 0.9 percent in April. This followed a 0.4 percent increase in March. The latest improvement put the SA index at 110.2 (2000=100), which is the highest level since September 2008. Over the last seven months, the tonnage index grew a total of 6.5 percent.This is the opposite of the report from Ceridian-UCLA that showed diesel fuel consumption down in April, although it might be a difference in the seasonal adjustment factors (NSA this report showed a 4.4% decline). Rail traffic was also up in April.
The not seasonally adjusted index, which represents the change in tonnage actually hauled by the fleets before any seasonal adjustment, equaled 111.3 in April, down 4.4 percent from the previous month.
Compared with April 2009, SA tonnage surged 9.4 percent, which was the fifth consecutive year-over-year gain and the largest increase since January 2005. Year-to-date, tonnage is up 6 percent compared with the same period in 2009.
...
“Tonnage is being boosted by robust manufacturing output and stronger retail sales.” [ATA Chief Economist Bob Costello said] “For most fleets, freight volumes feel better than reported tonnage because the supply situation, particularly in the truckload sector, is turning quickly.”
Wednesday, May 12, 2010
Ceridian-UCLA: Diesel fuel consumption index declines in April
by Calculated Risk on 5/12/2010 01:00:00 PM
This is the new UCLA Anderson Forecast and Ceridian Corporation index using real-time diesel fuel consumption data: Pulse of Commerce IndexTM
Press Release: Ceridian-UCLA Pulse of Commerce Index™ Drops 0.3 Percent in April
With the release of April’s figures, the Ceridian-UCLA Pulse of Commerce Index™ (PCI) by UCLA Anderson School of Management is showing flat, overall performance during the first four months of 2010. The PCI in April fell 0.3 percent, suggesting the economic recovery may have stalled, although an uptick in consumer spending could continue to drive a slow but steady recovery.
...
While the economy continues to climb year-over-year, the PCI indicates that expectations in the market for a robust recovery may be too optimistic. ...
“The latest PCI numbers are disappointing and cast considerable doubt on the strength of the recovery and the strength of GDP numbers for 2010,” said Ed Leamer, the PCI’s chief economist.
...
The PCI is based on an analysis of real-time diesel fuel consumption data ...
 Click on graph for larger image in new window.
This graph shows the index since January 1999.
Note: This index appears to lead Industrial Production (IP), but there is a significant amount of monthly noise. This is a new index and might be interesting to follow along with the Trucking and Railroad data.
Here is a video of Leamer's comments on the report.


