 RSS Feed
 by Calculated Risk on 9/24/2010 03:23:00 PM
Showing posts with label oil. Show all posts
Showing posts with label oil. Show all posts
Friday, September 24, 2010
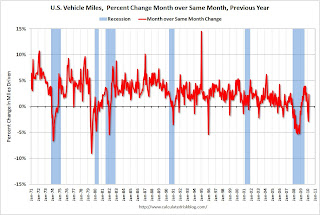
DOT: Vehicle Miles driven increase slightly in July
The Department of Transportation (DOT) reported that vehicle miles driven in June were up 0.8% compared to July 2009:
Travel on all roads and streets changed by 0.8% (2.2 billion vehicle miles) for July 2010 as compared with July 2009.
Cumulative Travel for 2010 changed by 0.2% (2.9 billion vehicle miles).
 Click on graph for larger image in new window.
This graph shows the rolling 12 month total vehicle miles driven.
On a rolling 12 month basis, vehicle miles driven are mostly moving sideways. Miles driven are still 1.8% below the peak in 2007.
Back in 2008, vehicle miles turned strongly negative on a "month over the same month of the prior year" basis, and that was one of the pieces of data that helped me correctly predict oil prices would decline sharply in the 2nd half of 2008. So far we haven't seen a sharp decline in vehicle miles - but we also haven't seen a strong increase.
Early next year this will be the longest period with the rolling 12-months miles driven below the previous peak since the DOT started tracking this series. The current longest slump followed the 1979 oil crisis and lasted for 40 months (starting in 1979 and lasting through the recession of the early '80s).
Monday, August 23, 2010
DOT: Vehicle Miles driven increase in June
by Calculated Risk on 8/23/2010 10:47:00 AM
The Department of Transportation (DOT) reported that vehicle miles driven in June were up 1.3% compared to June 2009:
Travel on all roads and streets changed by +1.3% (3.4 billion vehicle miles) for June 2010 as compared with June 2009.
...
Cumulative Travel for 2010 changed by +0.1% (1.6 billion vehicle miles).
 Click on graph for larger image in new window.
This graph shows the rolling 12 month total vehicle miles driven.
On a rolling 12 month basis, vehicle miles driven are mostly moving sideways. Miles driven are still 1.9% below the peak - and only 0.7% above the recent low.
Back in 2008, vehicle miles turned strongly negative on a "month over the same month of the prior year" basis, and that was one of the pieces of data that helped me correctly predict oil prices would decline sharply in the 2nd half of 2008. So far we haven't seen a sharp decline in vehicle miles - but we also haven't seen a strong increase.
Early next year this will be the longest period with the rolling 12-months miles driven below the previous peak since the DOT started tracking this series. The current longest slump followed the 1979 oil crisis and lasted for 40 months (starting in 1979 and lasting through the recession of the early '80s).
Thursday, July 22, 2010
DOT: Miles Driven increase slightly in May
by Calculated Risk on 7/22/2010 03:27:00 PM
Note: on Existing Home sales, please see:Existing Home Sales decline in June and Existing Home Inventory increases 4.7% Year-over-Year
The Department of Transportation (DOT) reported that vehicle miles driven in May were up just 0.1% compared to May 2009:
Travel on all roads and streets changed by +0.1% (0.3 billion vehicle miles) for May 2010 as compared with May 2009.
...
Cumulative Travel for 2010 changed by -0.1% (-1.6 billion vehicle miles).
 Click on graph for larger image in new window.
This graph shows the rolling 12 month total vehicle miles driven.
On a rolling 12 month basis, vehicle miles driven are mostly moving sideways. Miles driven are still 2.0% below the peak - and only 0.6% above the recent low.
Back in 2008, vehicle miles turned strongly negative on a "month over the same month of the prior year" basis, and that was one of the pieces of data that helped me correctly predict oil prices would decline sharply in the 2nd half of 2008. So far we haven't seen a sharp decline in vehicle miles - and also not a strong increase.
Monday, July 05, 2010
Update on Oil Prices
by Calculated Risk on 7/05/2010 01:21:00 PM
With the weakness in the US and European economies, and an apparent slowdown in China, it might be time to look at oil prices ...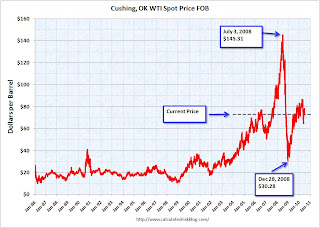 Click on graph for larger image in new window.
These are spot prices for Cushing WTI from the EIA (source).
Back in the Spring of 2008, we started seeing many signs of potential demand destruction - including fewer U.S miles driven, Asian countries reducing gasoline subsidies, and China stock piling oil for the Olympics. That was a pretty clear sign that oil prices would fall after China stopped stock piling oil.
So far miles driven have been increasing slowly (although the most recent data is for April, and there may be more weakness in June). And once again the Shanghai stock market is suggesting a slowdown in China. Not a clear sign like in 2008, but something to watch.
Wednesday, June 23, 2010
DOT: Vehicle Miles Driven increase in April
by Calculated Risk on 6/23/2010 11:59:00 PM
Note: on New Home sales, please see: New Home Sales collapse to Record Low in May
The Department of Transportation (DOT) reported that vehicle miles driven in April were up 1.2% from April 2009:
Travel on all roads and streets changed by +1.2% (3.1 billion vehicle miles) for April 2010 as compared with April 2009. Travel for the month is estimated to be 255.9 billion vehicle miles.
Cumulative Travel for 2010 changed by -0.2% (-1.6 billion vehicle miles).
 Click on graph for larger image in new window.
This graph shows the rolling 12 month total vehicle miles driven.
On a rolling 12 month basis, miles driven are still 2.0% below the peak - and only 0.6% above the recent low - suggesting a sluggish recovery.
Monday, May 24, 2010
DOT: Vehicle Miles Driven increase in March
by Calculated Risk on 5/24/2010 09:05:00 PM
Note: On existing home sales, please see Inventory increases Year-over-Year and Existing Home Sales increase in April
The Department of Transportation (DOT) reported earlier today that vehicle miles driven in March were up from March 2009:
Travel on all roads and streets changed by +2.3% (5.8 billion vehicle miles) for March 2010 as compared with March 2009. Travel for the month is estimated to be 254.8 billion vehicle miles.So miles driven are still down for the year compared to 2009.
Cumulative Travel for 2010 changed by -0.7% (-4.8 billion vehicle miles).
Also miles driven in March were still 1.7% below March 2007.
 Click on graph for larger image in new window.
This graph shows the percent change from the same month of the previous year as reported by the DOT.
As the DOT noted, miles driven in March 2010 were up 2.3% compared to March 2009.
The YoY decline in February was blamed on the snow, and there might have been some extra driving in March once the weather improved. On a rolling 12 month basis, miles driven are still 2.1% below the peak - and only 0.5% above the recent low - suggesting a sluggish recovery.
Tuesday, April 20, 2010
DOT: Vehicle Miles Driven Decline in February
by Calculated Risk on 4/20/2010 08:52:00 AM
The Department of Transportation (DOT) reported today that vehicle miles driven in February were down from February 2009:
Travel on all roads and streets changed by -2.9%(-6.3 billion vehicle miles) for February 2010 as compared with February 2009. Travel for the month is estimated to be 212.9 billion vehicle miles.
Cumulative Travel for 2010 changed by -2.3% (-10.1 billion vehicle miles).
 Click on graph for larger image in new window.
This graph shows the percent change from the same month of the previous year as reported by the DOT.
As the DOT noted, miles driven in February 2010 were down -2.9% compared to February 2009.
 The second graph shows the moving 12 month total of miles driven (to remove seasonality).
The moving 12 month total peaked in November 2007. The impact on vehicle miles of the gasoline shortages in the '70s are clear - in the late '70s and early '80s, it took 40 months before vehicle miles returned to the peak of April 1979.
Blame it on the snow - except this is the 2nd month in a row with a year-over-year decline in miles driven. If vehicle miles continues to decline on a year-over-year basis, it might suggest high gasoline prices are starting to impact the economy.
Saturday, April 10, 2010
Hamilton: "Do rising oil prices threaten the economic recovery?"
by Calculated Risk on 4/10/2010 05:17:00 PM
From Professor Hamilton at Econbrowser: Do rising oil prices threaten the economic recovery?
Ten of the 11 recessions in the United States since World War II have been preceded by a sharp increase in the price of crude petroleum. Oil had been holding around $80/barrel over the last month, but traded as high as $87 last week, leading the Financial Times to ask whether oil could give the "kiss of death to recovery." Here is how I would answer that question.See Hamilton's post for his analysis with several graphs. He concludes:
$87 oil is certainly not helping the recovery. But I would be very surprised if it proves to be the kiss of death.And with the opposite view from the Financial Times article:
Olivier Jakob, of Swiss consultant Petromatrix, said in a note that the “recovery of 2009 was fuelled with crude oil at $62 a barrel, not at $90 a barrel or $100 a barrel. We fear that the latest run on WTI will be the kiss of death for a global economy that was trying to avoid the possibility of a double-dip recession.”I tend to agree with Dr. Hamilton. However I also vehicle watch miles driven from the Department of Transportation (DOT), and the DOT recently reported that vehicle miles driven in January were down from January 2009:
excerpted with permission
Travel on all roads and streets changed by -1.6% (-3.7 billion vehicle miles) for January 2010 as compared with January 2009. Travel for the month is estimated to be 222.8 billion vehicle miles.Here is a repeat of the graph I posted last month:
 Click on graph for larger image in new window.
This graph shows the percent change from the same month of the previous year as reported by the DOT.
As the DOT noted, miles driven in January 2010 were down -1.6% compared to January 2009, and miles driven have declined 2.9% compared to January 2008, and are down 4.7% compared to January 2007.
If miles driven continues to decline, I'll be more concerned about oil prices.
Monday, March 22, 2010
DOT: Vehicle Miles Driven decline in January
by Calculated Risk on 3/22/2010 09:45:00 AM
Yesterday we discussed the impact of high oil prices on vehicle miles driven.
And today the Department of Transportation (DOT) reported that vehicle miles driven in January were down from January 2009:
Travel on all roads and streets changed by -1.6% (-3.7 billion vehicle miles) for January 2010 as compared with January 2009. Travel for the month is estimated to be 222.8 billion vehicle miles.
Click on graph for larger image in new window.This graph shows the percent change from the same month of the previous year as reported by the DOT.
As the DOT noted, miles driven in January 2010 were down -1.6% compared to January 2009, and miles driven have declined 2.9% compared to January 2008, and are down 4.7% compared to January 2007. This is a multi-year decline, and miles driven appear to be falling again.
Sunday, March 21, 2010
Oil Prices and Vehicle Miles
by Calculated Risk on 3/21/2010 05:03:00 PM
Something for a Sunday - in the weekly look ahead post I forgot to mention that the Department of Transportation (DOT) will release the vehicle miles driven report for January this week.
In early 2008 there was sharp drop in U.S. vehicle miles driven and that was one of the key signs of demand destruction for oil that led me to predict oil prices would decline sharply in the 2nd half of 2008.
First a look at oil prices ... Click on graph for larger image in new window.
This graph shows the daily Cushing, OK WTI Spot Price FOB from the Energy Information Administration (EIA).
With oil prices hoovering around $80 per barrel, I've started looking for possible signs of demand destruction again (see: Oil Prices Push Above $81 per Barrel). Of course there are other factors - like China - but vehicle miles is something to watch in the U.S. The second graph shows monthly oil prices and vehicle miles (month over the same month of the previous year with a 3 month centered average).
Although vehicle miles driven are noisy month to month, it appear that miles driven responds to spikes in oil prices.
For December 2009 - the last month of data - the DOT reported that miles driven were unchanged compared to December 2008 after increasing in 5 of the 6 pervious months. This slow down in miles driven could be because of the sluggish recovery, or it could be because oil prices are starting to impact miles driven.
Friday, February 19, 2010
DOT: Vehicle Miles Driven unchanged in December
by Calculated Risk on 2/19/2010 02:28:00 PM
In early 2008 there was sharp drop in U.S. vehicle miles driven. That was one of the key signs of demand destruction for oil that led me to predict oil prices would decline sharply in the 2nd half of 2008.
With oil prices at $77 per barrel, I've started looking for possible signs of demand destruction again (see: Oil Prices Push Above $81 per Barrel).
The Department of Transportation (DOT) reports that vehicle miles driven in December were unchanged from December 2008:
Travel on all roads and streets changed by 0.0% (-0.1 billion vehicle miles) for December 2009 as compared with December 2008. ... Cumulative Travel for 2009 changed by +0.2% (6.6 billion vehicle miles).
 Click on graph for larger image in new window.
This graph shows the comparison of month to the same month in the previous year as reported by the DOT.
As the DOT noted, miles driven in Dovember 2009 were unchanged compared to December 2008, and miles driven have declined 1.0% compared to December 2007 - and are down 3.2% compared to December 2006. This is a multi-year decline.
So far there is no evidence of significant demand destruction for oil, however the lack of growth in miles driven is suggesting a sluggish recovery.
Tuesday, January 26, 2010
Oil Prices and China
by Calculated Risk on 1/26/2010 01:50:00 PM
Two weeks ago I suggested it might be time to start looking for signs of demand destruction for oil (like we did in the first half of 2008). So far domestic demand (as far as vehicle miles) is still increasing slightly, however demand growth in China might be slowing ...
From MarketWatch: Oil slumps on expected rise in supplies, China worries
Oil futures fell on Tuesday, pressured by concerns that China's attempt to slow its growth will curb demand and expectations that U.S. crude-oil supplies are rising.I think that needs a graph!
...
"China is really the driving force in this market," said Dan Flynn, energy trader at PFGBest.
...
Broad concerns about weak growth and demand globally were also heightened ahead of supply data due Tuesday and Wednesday, Flynn said.
"We still have an oil glut in the market place. All in all, [oil trading] should remain sideways to lower," he said.
 Click on graph for larger image in new window.
This graph shows the Shanghai SSE Composite Index and the Cushing, OK WTI Spot Price oil prices on a weekly basis (in blue).
The SSE Composite Index closed down 2.42% to 3,019.39 and oil prices are off from the recent high.
There appears to be a relationship between the two although the Shanghai Composite turned down in last 2007 and early 2008 - well before oil prices collapsed.
Wednesday, January 20, 2010
DOT: Vehicle Miles increase slightly in November
by Calculated Risk on 1/20/2010 02:25:00 PM
With oil prices near $80 per barrel, I've started looking for signs of demand destruction (see: Oil Prices Push Above $81 per Barrel). One of the key signs in early 2008, was the sharp drop in miles driven in the U.S.
So far miles driven (through November) are up slightly year-over-year. The Department of Transportation (DOT) reports:
Travel on all roads and streets changed by +1.4% (3.2 billion vehicle miles) for November 2009 as compared with November 2008. ... Cumulative Travel for 2009 changed by +0.3% (7.6 billion vehicle miles).
 Click on graph for larger image in new window.
The first graph shows the rolling 12 month of U.S. vehicles miles driven.
By this measure (used to remove seasonality) vehicle miles declined sharply in 2008, and have been increasing slowly in recent months.
 The second graph shows the comparison of month to the same month in the previous year as reported by the DOT.
 As the DOT noted, miles driven in November 2009 were 1.4% greater than in November 2008, however miles driven are still down 3.9% compared to November 2007.
So far miles driven is not showing any evidence of demand destruction for oil, but the slow increase in miles is suggesting a sluggish recovery.
Monday, January 18, 2010
Oil Prices and Domestic Petroleum Exploration and Wells Investment
by Calculated Risk on 1/18/2010 11:05:00 AM
In late 2008 we discussed that the dramatic decline in oil prices would lead to a sharp decline in domestic investment in petroleum exploration and wells. Sure enough domestic investment was cut by 50% in the 2nd half of 2009 ...
The following graph compares real oil prices (data from the St. Louis Fed, adjusted with CPI) and real investment in petroleum exploration and wells in the U.S. (data from the BEA).
This doesn't include investment in alternative energy sources. Click on graph for larger image in new window.
Not surprisingly there is a strong correlation between oil prices and investment. With oil prices now around $80 per barrel again, domestic investment will probably increase in 2010.
The increase in oil prices is also concerning. Notice that large increases in oil prices have frequently been followed by recessions. This is a topic that Professor Hamilton has researched and discussed several times over the years, see: Will rising oil prices derail the recovery? Of course oil prices are still far below the peak.
Note: right scale doesn't start at zero to show the correlation between the series.
Monday, January 04, 2010
Oil Prices Push Above $81 per Barrel
by Calculated Risk on 1/04/2010 05:51:00 PM
From the NY Times: Oil Surges Above $81, Driven by Several Factors
A combination of frigid weather, expectations of an improving economy and new tensions between Russia and Belarus catapulted crude oil prices above $81 a barrel on Monday.Higher prices could impact the U.S. economic recovery (it is probably time to start watching U.S. vehicle miles driven again). Here is a graph of nominal oil prices ...
 Click on graph for larger image in new window.
These are spot prices for Cushing WTI from the EIA (source).
Back in the Spring of 2008, we started seeing many signs of potential demand destruction - including fewer U.S miles driven, Asian countries reducing gasoline subsidies, and China stock piling oil for the Olympics.
And maybe we are seeing the first signs of demand destruction again, since the Dept of Transportation reports that U.S. vehicle miles declined in October: Traffic Volume Trends
Travel on all roads and streets changed by -0.5% (-1.4 billion vehicle miles) for October 2009 as compared with October 2008. ...
Cumulative Travel for 2009 changed by +0.2% (4.8 billion vehicle miles).
 The second graph shows the comparison of month to the same month in the previous year as reported by the DOT.
 Miles driven in October 2009 were 0.5% less than in October 2008, the first year-over-year decline since May 2009.
Still - I haven't seen any stories like the following from the NY Times on June 28, 2008: Cruise Night, Without the Car
For car-loving American teenagers, this is turning out to be the summer the cruising died.There couldn't have been a clearer sign of a top in oil!
...
From coast to coast, American teenagers appear to be driving less this summer. Police officers who keep watch on weekend cruising zones say fewer youths are spending their time driving around in circles...
Wednesday, September 23, 2009
DOT: Vehicle Miles increase in July
by Calculated Risk on 9/23/2009 10:49:00 AM
Although vehicle miles increased in July 2009 compared to July 2008, miles driven are still 1.3% below the peak for the month of July in 2007.
The Dept of Transportation reports on U.S. Traffic Volume Trends:
Travel on all roads and streets changed by +2.3% (5.8 billion vehicle miles) for July 2009 as compared with July 2008. Travel for the month is estimated to be 263.4 billion vehicle miles.
Cumulative Travel for 2009 changed by 0.0% (-0.6 billion vehicle miles).
 Click on graph for larger image in new window.
The first graph shows the rolling 12 month of U.S. vehicles miles driven.
By this measure (used to remove seasonality) vehicle miles declined sharply, and are set to slowly increase.
 The second graph shows the comparison of month to the same month in the previous year as reported by the DOT.
 As the DOT noted, miles driven in July 2009 were 2.3% greater than in July 2008.
Year-over-year miles driven started to decline in December 2007, and really fell off a cliff in March 2008. This makes for an easier comparison for July 2009.
Monday, July 20, 2009
DOT: Vehicle Miles Flat YoY
by Calculated Risk on 7/20/2009 03:09:00 PM
This is the second consecutive month were vehicles miles driven were flat, or slightly above, the comparable month in 2008 (May 2009 compared to the May 2008).
The Dept of Transportation reports on U.S. Traffic Volume Trends:
Travel on all roads and streets changed by +0.1% (0.2 billion vehicle miles) for May 2009 as compared with May 2008. Travel for the month is estimated to be 257.3 billion vehicle miles.
 Click on graph for larger image in new window.
The first graph shows the rolling 12 month of U.S. vehicles miles driven. (label corrected: trillions)
By this measure (used to remove seasonality) vehicle miles declined sharply and are now moving sideways.
 The second graph shows the comparison of month to the same month in the previous year as reported by the DOT.
 As the DOT noted, miles driven in May 2009 were 0.1% greater than in May 2008.
Year-over-year miles driven started to decline in December 2007, and really fell off a cliff in March 2008. This makes for an easier comparison for May 2009.
Friday, July 03, 2009
One Year Ago: Oil Prices Peaked at $145 per Barrel
by Calculated Risk on 7/03/2009 05:13:00 PM
 Click on graph for larger image in new window.
These are spot prices for Cushing WTI from the EIA (source).
It is fun to look back ... I started speculating in March '08 about a sharp decline in oil prices in the 2nd half of 2008.
And I posted many times in the late spring about demand destruction (like fewer U.S miles driven), Asian countries reducing gasoline subsidies, China stock piling oil for the Olympics, etc.
But this story was probably the key clue that oil prices were peaking (from June 28, 2008). From the NY Times: Cruise Night, Without the Car
For car-loving American teenagers, this is turning out to be the summer the cruising died.We knew it was almost over when teenagers stopped cruising!
...
From coast to coast, American teenagers appear to be driving less this summer. Police officers who keep watch on weekend cruising zones say fewer youths are spending their time driving around in circles...
Friday, May 22, 2009
The Oil Cushion: Getting Smaller
by Calculated Risk on 5/22/2009 03:09:00 PM
Last year I wrote a post about how falling oil prices would provide some cushion for the U.S. economy: The Oil Cushion. Here is another update ...
The following graph shows the monthly personal consumption expenditures (PCE) at a seasonally adjusted annual rate (SAAR) for gasoline, oil and other energy goods compared to the U.S. spot price for oil (monthly). Click on graph for larger image in new window.
Last quarter I noted:
"The good news is at current oil prices (U.S. spot prices averaged about $39 per barrel in February), oil related PCE will be in the $250 billion seasonally adjusted annual rate (SAAR) range in Q1 - well below the $440 billion SAAR of the first 8 months of 2008.
This is a savings of about $16 billion per month compared to the first 8 months of 2008. That savings will definitely provide a cushion for consumers."
As expected, the BEA reported "PCE, Gasoline, fuel oil, and other energy goods" at $265 billion (SAAR) in Q1.
Now, with spot prices pushing $60 per barrel, oil related PCE will probably come in close to $300 billion (SAAR) in Q2.
That is still provides a sizable cushion compared to the first eight months of 2008 (about $11 billion per month), but this is a drag compared to Q1.
Data sources:
PCE from BEA underlying detail tables: Table 2.4.5U. Personal Consumption Expenditures by Type of Product line 117.
Oil prices from EIA U.S. Spot Prices.
Wednesday, May 20, 2009
D.O.T.: U.S. Vehicle Miles off 1.2% YoY in March
by Calculated Risk on 5/20/2009 01:32:00 PM
The Dept of Transportation reports on U.S. Traffic Volume Trends:
Travel on all roads and streets changed by -1.2% (-3.1 billion vehicle miles) for March 2009 as compared with March 2008. Travel for the month is estimated to be 245.1 billion vehicle miles.
 Click on graph for larger image in new window.
The first graph shows the annual change in the rolling 12 month average of U.S. vehicles miles driven. Note: the rolling 12 month average is used to remove noise and seasonality.
By this measure, vehicle miles driven are off 3.3% Year-over-year (YoY); the decline in miles driven was worse than during the early '70s and 1979-1980 oil crisis. However miles driven - compared to the same month of 2008 - has only been off about 1% for the last couple months.
 The second graph shows the comparison of month to the same month in the previous year as reported by the DOT.
 As the DOT noted, miles driven in March 2009 were 1.2% less than in March 2008.
Year-over-year miles driven started to decline in December 2007, and really fell off a cliff in March 2008. Although this data isn't seasonally adjusted, it appears that miles driven has stabilized.


