 RSS Feed
 by Calculated Risk on 1/13/2011 11:59:00 AM
Showing posts with label Foreclosure. Show all posts
Showing posts with label Foreclosure. Show all posts
Thursday, January 13, 2011
Record Foreclosure activity in 2010
From RealtyTrac: 2010 Year-End Foreclosure Report
RealtyTrac® ... today released its Year-End 2010 U.S. Foreclosure Market Report™, which shows a total of 3,825,637 foreclosure filings — default notices, scheduled auctions and bank repossessions — were reported on a record 2,871,891 U.S. properties in 2010, an increase of nearly 2 percent from 2009 and an increase of 23 percent from 2008. ...And from Jon Prior at HousingWire:
Foreclosure filings were reported on 257,747 U.S. properties in December, a decrease of nearly 2 percent from the previous month and down 26 percent from December 2009 — the biggest annual drop in foreclosure activity since RealtyTrac began publishing its foreclosure report in January 2005 and giving December the lowest monthly total since June 2008.
...
“Total properties receiving foreclosure filings would have easily exceeded 3 million in 2010 had it not been for the fourth quarter drop in foreclosure activity — triggered primarily by the continuing controversy surrounding foreclosure documentation and procedures that prompted many major lenders to temporarily halt some foreclosure proceedings,” said James J. Saccacio, chief executive officer of RealtyTrac. “Even so, 2010 foreclosure activity still hit a record high for our report, and many of the foreclosure proceedings that were stopped in late 2010 — which we estimate may be as high as a quarter million — will likely be re-started and add to the numbers in early 2011.”
Daren Blomquist, who edits the RealtyTrac monthly reports, said the record set in 2010 will not last for long.Activity slowed down in Q4, but will probably pick up again in Q1.
"We don’t think we’ve peaked yet nationwide," Blomquist told HousingWire. "We’re expecting the 2011 numbers to be slightly higher than 2010, and then start the downward trend toward 'normalcy' in 2012."
Tuesday, October 26, 2010
DataQuick: California Mortgage Defaults Rise in Third Quarter
by Calculated Risk on 10/26/2010 07:44:00 PM
 Click on graph for larger image in new window.
This graph shows the Notices of Default (NOD) by year through 2009, and for the first three quarters of 2010, in California from DataQuick.
Although the pace of filings has slowed from the previous two years, it is still very high by historical standards.
From DataQuick: California Mortgage Defaults Rise in Third Quarter
The number of foreclosure proceedings initiated by lenders between July and September edged higher on a quarter-to-quarter basis for the first time since early last year. But the number of home owners who went all the way through that process to foreclosure dipped from the previous quarter and a year ago, a real estate information service reported.As prices fall later this year, we might see another increase in NODs. Although NODs will decline in 2010 from 2009, the number will still be very high and 2010 will be the third highest on record (only behind 2009 and 2008).
A total of 83,261 Notices of Default ("NODs") were recorded at county recorder offices during the July-through-September period. That was up 18.9 percent from 70,051 in the prior quarter, and down 25.5 percent from 111,689 in third-quarter 2009, according to San Diego-based MDA DataQuick.
...
"Over the past year, with some minor ups and downs, financial institutions and their servicers have been processing a fairly steady number of defaults each quarter. That probably has more to do with their capacity to process defaults, than with higher or lower levels of incoming distress," said John Walsh, DataQuick president.
...
The number of Trustees Deeds ("TDs") recorded, which reflects the number of houses and condos foreclosed on, totaled 45,377 during the third quarter. That was down 4.8 percent from 47,669 for the prior quarter, and down 9.3 percent from 50,013 for third-quarter 2009. The all-time peak for TDs was 79,511 in third-quarter 2008.
There are many details in the press release - the median origination month was August 2006, Countrywide made the most bad loans (no surprise), and the top beneficiaries were Bank of America (15,992), Wells Fargo (10,069), MERS (5,292), and JP Morgan Chase (5,172).
It will be interesting to see what happens in Q4. Since this is the first stage of the foreclosure process, and almost all foreclosures in California are non-judicial, I'd expect little or no impact from "foreclosure-gate".
Sunday, October 24, 2010
Short Sales vs. Foreclosures
by Calculated Risk on 10/24/2010 11:03:00 PM
Posted earlier:
Michael Powell at the NY Times looks at short sales and foreclosures: Owners Seek to Sell at a Loss, but Bankers Push Foreclosure
The article offers two explanations for why lenders seem to prefer foreclosures: 1) short sale fraud, and 2) some incentives might favor foreclosure.
From Powell:
[F]inancial incentives can push toward a foreclosure rather than a short sale. Servicers can reap high fees from foreclosures. And lenders can try to collect on private mortgage insurance.In a more normal environment, servicers can "reap high fees" from foreclosures, but in the current environment there is a less of an incentive (since investors are reviewing all expenses closely). And mortgage insurance is a definite stumbling block to some short sales. But there is little evidence of the banks sitting on REOs to avoid taking losses (there just aren't that many REOs on their balance sheets) - so I think that point is incorrect.
Some advocates and real estate agents also point to an April 2009 regulatory change in an obscure federal accounting law. The change, in effect, allowed banks to foreclose on a home without having to write down a loss until that home was sold. By contrast, if a bank agrees to a short sale, it must mark the loss immediately.
When I've spoken to lenders / servicers, short sale fraud is always the first thing they mention. There are all kinds of possible frauds - from non-arms length transactions (selling to friends or relatives), off the record kickbacks to the owner, and "flopping", where the agent presents an offer to the bank from a partner - even though the agents has received higher offers, and then the partner flips the house after the short sale splitting the profits with the agent.
Even with all these problems, and the long waits for buyers, short sales have increased significantly this year.
Thursday, August 26, 2010
MBA Q2 2010: 14.42% of Mortgage Loans Delinquent or in Foreclosure
by Calculated Risk on 8/26/2010 01:30:00 PM
The MBA reports that 14.42 percent of mortgage loans were either one payment delinquent or in the foreclosure process in Q2 2010 (seasonally adjusted). This is down slightly from the record 14.69 percent in Q1 2010.
From the MBA: Delinquencies and Foreclosure Starts Decrease in Latest MBA National Delinquency Survey
The delinquency rate for mortgage loans on one-to-four-unit residential properties dropped to a seasonally adjusted rate of 9.85 percent of all loans outstanding as of the end of the second quarter of 2010, a decrease of 21 basis points from the first quarter of 2010, and an increase of 61 basis points from one year ago, according to the Mortgage Bankers Association’s (MBA) National Delinquency Survey.Note: 9.85% (SA) and 4.57% equals 14.42%.
...
The percentage of loans in the foreclosure process at the end of the second quarter was 4.57 percent, a decrease of six basis points from the first quarter of 2010, but an increase of 27 basis points from one year ago.
Much was made at the end of 2009 about the decline in the 30 day delinquency "bucket" (percent of loans between 30 and 60 days delinquent). Unfortunately the seasonally adjusted 30 day delinquency rate increased again in Q2 2010.
And much was made on the conference call this morning about the declines in the other "buckets", however the total percent of loans delinquent or in the foreclosure process declined only slightly in Q2 from Q1 - and is the second highest on record.
Note: there are some questions about the seasonal adjustment, especially for the 90 day bucket since we've never seen numbers this high before, but the adjustment for the 30 and 60 day periods are probably reasonable.
 Click on graph for larger image in new window.
Loans 30 days delinquent increased to 3.51%, and this is about the same levels as in Q4 2008 (slightly below the peak of 3.77% in Q1 2009).
Delinquent loans decreased in all other buckets - especially in the 90+ day bucket. MBA Chief Economist Jay Brinkmann suggested the decline in the 90+ day bucket was because of some successful modifications - since the lenders reported the loans as delinquent until the modification was made permanent.
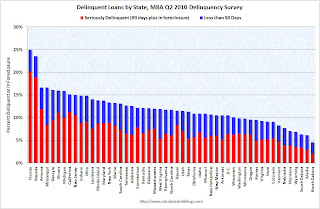 The second graph shows the delinquency rate by state (red is seriously delinquent: 90+ days or in foreclosure, blue is delinquent less than 90 days).
 Clearly Florida and Nevada have a large percentage of loans delinquent or in foreclosure. But the delinquency problem is widespread with 36 states and D.C. all having total delinquency rates above 10%.
When asked if he expected the slight improvements to continue, Brinkmann said "Improvements are more of a hope". He said the problem is jobs, and he is revising down his economic forecasts. He also the improvement in the 90+ day bucket might be because of modifications - and that might not continue.
With house prices falling - and growth slowing - the delinquency rate will probably increase later this year.
Monday, August 09, 2010
REO Inventory including private-label RMBS
by Calculated Risk on 8/09/2010 09:24:00 PM
Earlier I posted a graph of Fannie, Freddie and FHA inventory (new record total in Q2).
Economist Tom Lawler has added private-label RMBS REO in the following graph.
Note: The private-label securities have one advantage - they essentially stopped making new loans in mid-2007! (see Figure 3 from San Francisco Fed Senior Economist John Krainer: Recent Developments in Mortgage Finance)
Update: The private-label securities are the ones securitized by Wall Street. This was the worst of the worst securities. Click on graph for larger image in new window.
From Tom Lawler:
As the chart indicates, the SF REO inventory of “the F’s” has increased sharply since the end of 2008, while the SF REO inventory held in private-label RMBS has fallen considerably. This chart, of course, does NOT include anything close to all REO, as SF REO properties owned by banks, thrifts, credit unions, VA, USDA, finance companies, and “other” mortgage lenders/investors are not included.
Fannie, Freddie, FHA REO Inventory Increases 13% in Q2 from Q1 2010
by Calculated Risk on 8/09/2010 11:25:00 AM
The combined REO (Real Estate Owned) inventory for Fannie, Freddie and the FHA increased by 13% in Q2 2010 from Q1 2010. The REO inventory (lender Real Estate Owned) increased 74% compared to Q2 2009 (year-over-year comparison). Click on graph for larger image in new window.
This graph shows the REO inventory for Fannie, Freddie and FHA through Q2 2010.
The REO inventory for the "Fs" has increased sharply over the last year, from 135,868 at the end of Q2 2009 to 236,338 at the end of Q2 2010.
This is a new record for Fannie and Freddie; the FHA's REO inventory decreased slightly in Q2 2010.
Remember this is just a portion of the total REO inventory. Private label securities and banks and thrifts also hold a substantial number of REOs.
Thursday, July 22, 2010
DataQuick: California Notice of Default Filings Decline in Q2
by Calculated Risk on 7/22/2010 09:47:00 PM

Click on graph for larger image in new window.
This graph shows the Notices of Default (NOD) by year through 2009, and for the first half of 2010, in California from DataQuick.
Although the pace of filings has slowed, it is still very high by historical standards.
From DataQuick: California Mortgage Defaults Hit Three-Year Low; Foreclosures Rise
The number of California homes pushed into the formal foreclosure process between April and June dropped for the fifth consecutive quarter to the lowest level in three years. The declines were greatest in the most affordable areas, where foreclosure activity continues to fall from extremely high levels over the past two years, a real estate information service reported.As I've noted before, in terms of new NOD filings the peak was probably in 2009. A few key points:
A total of 70,051 Notices of Default ("NODs") were filed at county recorder offices during the April-to-June period. That was down 13.6 percent from 81,054 for the prior quarter, and down 43.8 percent from 124,562 in second-quarter 2009, according to San Diego-based MDA DataQuick.
Last quarter's total was the lowest since second-quarter 2007, when 53,943 NODs were recorded. The peak was in first-quarter 2009 when 135,431 homeowners received foreclosure notices.
"Obviously, motivated sellers and accommodating lenders have played a part in bringing the default filings down, especially when it comes to short sales. Public policy has also been a factor. We also need to remember that prices have come up off bottom over the past year. If they continue to rise, fewer homeowners will find themselves under water, which is a significant factor in letting a home go," said John Walsh, DataQuick president.
...
The number of Trustees Deeds (TDs) recorded, which reflect the number of houses or condo units lost at the end of the foreclosure process, totaled 47,669 during the second quarter. That was up 11.2 percent from 42,857 for the prior quarter, and up 4.4 percent from 45,667 for second-quarter 2009. The all-time peak was 79,511 in third- quarter 2008.
Tuesday, July 06, 2010
LPS: Mortgage Delinquencies and Foreclosures increase to 12.38% in May
by Calculated Risk on 7/06/2010 03:19:00 PM
From Lender Processing Services: LPS' May Mortgage Monitor Report: Increase in Rate of New Delinquencies; Decline in Number of Delinquent Loans Becoming Current
The May Mortgage Monitor report released today by Lender Processing Services, Inc. ... shows a 2.3 percent month-over-month increase in the nation's home loan delinquency rate to 9.2 percent in May 2010, and that early-stage delinquencies are increasing as normal seasonal improvements taper off. This report includes data as of May 31, 2010.LPS shows 9.2% delinquent and another 3.18% in foreclosure for a total of 12.38%. I'm not sure about the days to foreclosure numbers (other sources show fewer), but they have steadily increased. For delinquency rates I usually use the quarterly report from the MBA.
According to the Mortgage Monitor report, the percentage of mortgage loans in default beyond 90 days increased slightly, while both delinquency and foreclosure rates continue to remain relatively stable at historically high levels. There are currently more than 7.3 million loans currently in some stage of delinquency or REO.
The report also shows that the average number of days for a loan to move from 30-days delinquent to foreclosure sale continues to increase, and is now at an all-time high of 449 days, resulting in an increase in "shadow" foreclosure inventory.
Here is the LPS monthly report. The increase in early stage delinquencies might be seasonal, but it is definitely bad news. And what happens when house prices start falling again later this year as I expect?
For more, from Diana Golobay at HousingWire: National Mortgage Delinquency Rate Swells to 9.2% in May: LPS
And from Diana Olick at CNBC: New Loan Delinquencies on the Rise Again
Sunday, July 04, 2010
Investors buying foreclosures in Phoenix
by Calculated Risk on 7/04/2010 05:22:00 PM
Here is an article from the AP about investors buying foreclosures in the Phoenix area: Finding gold in them thar foreclosures (ht Ian).
I can add a little to this story: I know of an individual investor (through a close friend) in the Phoenix area who has bought almost 100 homes over the last 18 months. The investor has shared with me his portfolio. He has only bought single family homes, no condos. His average purchase price was under $35,000 and most of the homes are 3 br / 2 ba.
He is renting the homes, many by the room. Yeah, they sound like flophouses! The investor is starting to have a vacancy problem that he attributes to the new Arizona immigration law that takes effect on July 29th.
I reviewed the public records of some of the homes this investor bought - as an example he bought a 3 br / 2 ba 1,200 sq ft home for about $35,000 a couple of months ago - and that is about the average for the homes he has been buying. Very basic, dirt yards ... not the best area.
He paid in the low $20,000s for a home he bought last summer that sold for over $180,000 in 2006! That is almost 90% off the peak price (the house sold for $62,000 in 2004, so I'm guessing fraud in 2006 - and maybe in 2004 too).
Note: all numbers changed a little - the investor wants to remain anonymous.
Friday, June 25, 2010
Year of the Short Sale, and Deed in lieu
by Calculated Risk on 6/25/2010 09:45:00 PM
From Kenneth Harney in the WaPo: Foreclosure alternative gaining favor (ht ghostfaceinvestah)
There are two programs in Home Affordable Foreclosure Alternatives (HAFA), short sales and deed in lieu of foreclosure.
Harney writes:
Some of the largest mortgage servicers and lenders in the country are gearing up campaigns to reach out to carefully targeted borrowers with cash incentives that sometimes range into five figures, plus a simple message: Let's bypass the time-consuming hassles of short sales and foreclosures. Just deed us the title to your underwater home, and we'll call it a deal. ...The deal can be quick, and the first lender will agree not to pursue a deficiency judgment. However 2nds are a problem, and "deed in lieu" transactions still hit the borrower's credit history.
Borrowers with 2nds considering a "deed in lieu" transaction should contact the 2nd lien holders. HAFA offers a payout to 2nd lien holders in deed in lieu transactions who agree to release borrowers from debt (see point 4 here for payouts under deed in lieu).
Under the HAFA deed in lieu program, the borrower needs to be proactive with 2nd lien holders.
The deed in lieu program is gaining in popularity, from Harney:
Bank of America, has mailed 100,000 deed-in-lieu solicitations to customers in the past 60 days, and its volume of completed transactions is breaking company records, according to officials. ... To sweeten the pot, Bank of America is offering cash incentives that range from $3,000 to $15,000 ... [Matt Vernon, Bank of America's top short sale and deed-in-lieu executive] said.On the credit impact, from Carolyn Said at the San Francisco Chronicle:
[Craig Watts, a spokesman for FICO] said it is a "widespread myth" that short sales and deeds in lieu of foreclosure have less impact on credit scores than do foreclosures.And a video from HAMP / HAFA: "Your Graceful Exit"
"Generally speaking, when you can't pay your mortgage, in the eyes of the FICO score what matters is that you were not able to fill your obligation as you originally agreed and that failure is highly predictive of future risk," he said.
Wednesday, June 16, 2010
WaPo on Foreclosures and Deficiencies
by Calculated Risk on 6/16/2010 01:44:00 PM
From Dina ElBoghdady at the WaPo: Lenders go after money lost in foreclosures
Here is an excerpt:
Carlos Cortez and his wife['s] ... second lender came after them for $70,000 when their short sale was completed on his Manassas Park townhouse in 2008.Tanta (my former co-blogger an a mortgage banker) sent me an email about this in 2007:
Cortez knew that was a possibility, but he went through with the sale because his real estate agent said the lender was engaging in scare tactics.
James Scruggs, an attorney at Legal Services of Northern Virginia, said the lender appears to have backed off after Cortez argued that that the loan officer falsely qualified him and his wife for a home-equity line by fabricating key details about their finances.
Back in my day working for a servicer ... the absolute all time last possible thing you could get me to do is send an attorney barging into court demanding a deficiency judgment if I had any reason whatsoever to fear that my own effing loan officer was implicated in fraud on the original loan application. Any borrower with half a brain will raise that as a defense, and any judge even slightly awake will not only deny the deficiency but probably make the lender pay all costs, or worse. And I'd call that justice.It is unclear how often lenders are pursuing borrowers for deficiencies - but it is clearly happening more often now. This is one reason why people involved in short sales or considering "walking away" should consult an attorney. I suspect this is part of the reason for the recent surge in personal bankruptcy filings.
Wednesday, June 02, 2010
Research: 270 Days is Optimal Time in Foreclosure
by Calculated Risk on 6/02/2010 11:54:00 PM
BofA executive Jack Schakett made some interesting comments earlier today:
"There is a huge incentive for customers to walk away because getting free rent and waiting out foreclosure can be very appealing to customers."Schakett noted that the foreclosure process is currently taking 13 to 14 months ...
For many the timeframe is apparently much longer. On Monday David Streitfeld wrote in the NY Times: Owners Stop Paying Mortgages, and Stop Fretting
The average borrower in foreclosure has been delinquent for 438 days before actually being evicted, up from 251 days in January 2008, according to LPS Applied Analytics.These long foreclosure time lines can have a significant adverse impact on housing.
...
More than 650,000 households had not paid in 18 months, LPS calculated earlier this year. With 19 percent of those homes, the lender had not even begun to take action to repossess the property ...
Housing economist Tom Lawler alerted me to a 2008 research paper by Freddie Mac economists Amy Crews Cutts and William A. Merrill: Interventions in Mortgage Default: Policies and Practices to Prevent Home Loss and Lower Costs. They studied the foreclosure time lines and costs in several states and found that 270 days is sufficient time to allow the borrower to cure, and any more time actually incentivizes the borrower to strategically default:
There are many challenges that policy makers, investors, servicers and borrowers face in minimizing the incidence of home loss through foreclosure. Among them is the tension between too little time in the foreclosure process, such that some borrowers are unable to recover from relatively mild setbacks before they lose the home but investors minimize pre-foreclosure time related costs, and too much time in the foreclosure process, such that the borrower is incented to let the home go to foreclosure sale during which no mortgage payments are made (in essence, free rent for a significant time) and investor costs rise rapidly.One of unintended consequences of the government foreclosure delaying strategy (probably aimed at limiting supply and supporting house prices), is that strategic defaults have gained fairly widespread acceptance. And that means the eventual cost to the taxpayer will be higher than if the lenders had either modified the loans, or foreclosed, or approved a short sale, within about 270 days.
...
A sweet spot for the optimal time in foreclosure likely exists around a statutory timeline of 120 days (the current national median, and equivalent to 270 days after adding in 150 days for pre-referral loss mitigation activities by servicers through workouts) in which the borrower’s incentives are aligned with both a high probability of curing out of the foreclosure and keeping the pre-foreclosure costs to the investor contained.
Tuesday, June 01, 2010
Fannie Mae: Serious Delinquencies decline in March
by Calculated Risk on 6/01/2010 08:17:00 PM
Breaking a trend ... Click on graph for larger image in new window.
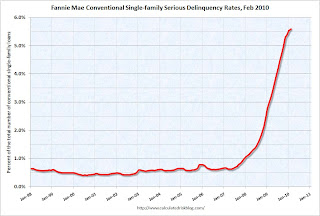
Fannie Mae reported today that the rate of serious delinquencies - at least 90 days behind - for conventional loans in its single-family guarantee business decreased to 5.47% in March, down from 5.59% in February - and up from 3.13% in March 2009.
"Includes seriously delinquent conventional single-family loans as a percent of the total number of conventional single-family loans."
This is the first decline since early 2006 and could be because Fannie (and Freddie and the FHA) are moving ahead with foreclosures.
As noted last month, the combined REO (Real Estate Owned) inventory for Fannie, Freddie and the FHA increased by 22% in Q1 2010 from Q4 2009. The REO inventory (foreclosed homes) increased 59% compared to Q1 2009 (year-over-year comparison). This graph shows the REO inventory for Fannie, Freddie and FHA through Q1 2010.
Even with all the delays in foreclosure, the REO inventory has increased sharply over the last three quarters, from 135,868 at the end of Q2 2009, to 153,007 in Q3 2009, 172,357 at the end of Q4 2009 and now 209,500 at the end of Q4 2010.
These are new records for all three agencies.
Distressed House Sales: Movin' on up!
by Calculated Risk on 6/01/2010 12:58:00 PM
From Carolyn Said at the San Francisco Chronicle: Foreclosures shifting to affluent ZIP codes
Foreclosures are going upscale across the Bay Area. ... Even more striking is the growth of mortgage defaults - the first step in the foreclosure process - in affluent ZIP codes.Option ARMs were very popular in the mid-to-high end bubble areas.
While the high-end numbers are far shy of the massive wave of lower-priced foreclosures, the growth reflects a significant shift in the foreclosure landscape ... Mortgage distress has moved upstream in part because of economic conditions ... Also in play [are] option ARM (adjustable rate mortgage) that's just beginning to cause problems.
Previous Chronicle analyses have found that option ARMs were heavily used in the Bay Area, accounting for 20 percent of all homes bought or refinanced here from 2004 to 2008. They were used for homes averaging about $823,000 in value.Although many of these loans already recast - or were refinanced - there are still quite a few that will recast over the next couple of years. Since Option ARMs were frequently used as "affordability products", many homeowners will not be able to afford the higher payments when the loans recast.
Carolyn Said also notes that banks prefer short sales to foreclosures in the mid-to-high end areas. So just tracking foreclosures doesn't tell the entire story. I'm seeing more and more high end homes listed as short sales ... and this means there are more distressed sales coming in certain mid-to-high end bubble areas and also more price declines.
Wednesday, May 19, 2010
MBA Q1 2010: Record 14.69% of Mortgage Loans Delinquent or in Foreclosure
by Calculated Risk on 5/19/2010 10:00:00 AM
The MBA reports a record 14.69 percent of mortgage loans were either one payment delinquent or in the foreclosure process in Q1 2010 (seasonally adjusted).
From the MBA: Delinquencies, Foreclosure Starts Fall in Latest MBA National Delinquency Survey
The delinquency rate for mortgage loans on one-to-four-unitAlthough this is a new record, Jay Brinkmann, MBA’s chief economist added a caution on the seasonal adjustment (see press release).
residential properties increased to a seasonally adjusted rate of 10.06 percent of all loans outstanding as of the end of the first quarter of 2010, an increase of 59 basis points from the fourth quarter of 2009, and up 94 basis points from one year ago, according to the Mortgage Bankers Association’s (MBA) National Delinquency Survey. The non-seasonally adjusted delinquency rate decreased 106 basis points from 10.44 percent in the fourth quarter of 2009 to 9.38 percent this quarter.
The percentage of loans on which foreclosure actions were started during the first quarter was 1.23 percent, up three basis points from last quarter but down 14 basis points from one year ago.
The delinquency rate includes loans that are at least one payment past due but does not include loans in the process of foreclosure. The percentage of loans in the foreclosure process at the end of the first quarter was 4.63 percent, an increase of five basis points from the fourth quarter of 2009 and 78 basis points from one year ago. This represents another record high.
The combined percentage of loans in foreclosure or at least one payment past due was 14.01 percent on a non-seasonally adjusted basis, a decline from 15.02 percent last quarter.
The serious delinquency rate, the percentage of loans that are 90 days or more past due or in the process of foreclosure, was 9.54 percent, a decrease of 13 basis points from last quarter, but an increase of 230 basis points from the first quarter of last year.
I'll have notes from the conference call and graphs soon.
Thursday, May 13, 2010
RealtyTrac: Record REOs in April, NODs Decline Sharply
by Calculated Risk on 5/13/2010 09:51:00 AM
The phrase "foreclosure activity" can be confusing.
There are three key stages in the process: 1) Notice of Default (or Lis Pendens depending on state), 2) Notice of Trustee Sale or Notice of Foreclosure Sale, and 3) actual foreclosure (Real Estate Owned). Usually we abbreviate these stages as NOD, NTS and REO.
To calculate "foreclosure activity", RealtyTrac adds the notices together. If a property goes all the way to REO, it will be counted at least 3 times (sometimes more if multiple NODs or NTS are filed).
What this report shows is that REO is at record levels (actual foreclosures), but the initial stage (NODs) has declined substantially. The decline in NODs is good news, but the servicers are still working through a huge backlog of previously filed NODs - and REO activity (or short sales) will be high for a long time.
From RealtyTrac: Foreclosure Activity Decreases 9 Percent in April
RealtyTrac® ... today released its U.S. Foreclosure Market Report™ for April 2010, which shows that foreclosure filings — default notices, scheduled auctions and bank repossessions — were reported on 333,837 properties in April, a 9 percent decrease from the previous month and a 2 percent decrease from April 2009. One in every 387 U.S. housing units received a foreclosure filing during the month.
“There were two important milestones in the April numbers that show foreclosure activity has begun to plateau — but at a very high level that will not drop off in the near future,” said James J. Saccacio, chief executive officer of RealtyTrac. “April was the first month in the history of our report with an annual decrease in U.S. foreclosure activity. Secondly, bank repossessions, or REOs, hit a record monthly high for the report even while default notices dropped substantially on a monthly and annual basis. We expect a similar pattern to continue for most of this year, with the overall numbers staying at a high level and ripples of activity hitting the various stages of the foreclosure process as lenders systematically work through the backlog of distressed properties.”
Monday, May 10, 2010
Fannie, Freddie, FHA REO Inventory Surges 22% in Q1 2010
by Calculated Risk on 5/10/2010 03:55:00 PM
The combined REO (Real Estate Owned) inventory for Fannie, Freddie and the FHA increased by 22% in Q1 2010 from Q4 2009. The REO inventory (foreclosed homes) increased 59% compared to Q1 2009 (year-over-year comparison). Click on graph for larger image in new window.
This graph (ht Tom Lawler) shows the REO inventory for Fannie, Freddie and FHA through Q1 2010.
Even with all the delays in foreclosure, the REO inventory has increased sharply over the last three quarters, from 135,868 at the end of Q2 2009, to 153,007 in Q3 2009, 172,357 at the end of Q4 2009 and now 209,500 at the end of Q4 2010.
These are new records for all three agencies.
Remember this is just a portion of the total REO inventory. Private label securities and banks and thrifts hold an even larger number of REOs. For more, see Tom Lawler's earlier post: REO: Agencies vs. Private Label and from James Hagerty at the WSJ in March writing about a Barclays Capital report: Supply of Foreclosed Homes on the Rise Again.
Fannie Mae: $11.5 billion loss, sees no profits for "indefinite future"
by Calculated Risk on 5/10/2010 08:58:00 AM
For a EU / ECB summary, please see previous post: Euro Summary
From Fannie Mae:
Fannie Mae (FNM/NYSE) reported a net loss of $11.5 billion in the first quarter of 2010, compared with a net loss of $15.2 billion in the fourth quarter of 2009. Including $1.5 billion of dividends on our senior preferred stock held by the U.S. Department of Treasury, the net loss attributable to common stockholders was $13.1 billion ...Foreclosure activity is increasing:
We acquired 61,929 single-family real estate-owned properties through foreclosure in the first quarter of 2010, compared with 47,189 in the fourth quarter of 2009. As of March 31, 2010, our inventory of single-family real estate owned properties was 109,989, compared with 86,155 as of December 31, 2009.Greg Morcroft at MarketWatch reports:
Fannie sees no profits for the "indefinite future" ... financial sustainability uncertain.Here is the monthly Fannie Mae seriously delinquent graph through February ...
 Click on graph for larger image in new window.
Fannie Mae reported that the rate of serious delinquencies - at least 90 days behind - for conventional loans in its single-family guarantee business increased to 5.59% in February, up from 5.52% in January - and up from 2.96% in February 2009.
"Includes seriously delinquent conventional single-family loans as a percent of the total number of conventional single-family loans."
It does appear the increases in the delinquency rate have slowed.
Wednesday, April 21, 2010
Distressed Sales: Sacramento as an Example, March Update
by Calculated Risk on 4/21/2010 12:13:00 PM
The Sacramento Association of REALTORS® is breaking out monthly resales by equity sales (conventional resales), and distressed sales (Short sales and REO sales), and I'm following this series as an example to see mix changes in a distressed area.
Starting last month First American Corelogic has started releasing a distressed sales report - and that shows the trend in short sales and REOs nationally. Click on graph for larger image in new window.
Here is the March data.
The Sacramento Association started breaking out REO sales in 2008, but they have only broken out short sales since June 2009. Almost 65% of all resales (single family homes and condos) were distressed sales in March.
Note: This data is not seasonally adjusted, although the increase in sales in March is slightly above normal because of the tax credit. The second graph shows the percent of REO, short sales and conventional sales. The percent of short sales is near the high set in December. This will probably continue to increase this year (2010 is the year of the short sale!).
Also total sales in March were off 3.4% compared to March 2009; the tenth month in a row with declining YoY sales - even with a surge from tax credit buying this year!
On financing, nearly 60 percent were either all cash (27.1%) or FHA loans (31.5%), suggesting most of the activity in distressed former bubble areas like Sacramento is first time home buyers using government-insured FHA loans, and investors paying cash.
Tuesday, April 20, 2010
DataQuick: Foreclosures moving to mid-to-high end
by Calculated Risk on 4/20/2010 04:00:00 PM
As a followup to the previous post, here is some more data from DataQuick:
"We are seeing signs that the worst may be over in the hard-hit entry-level markets, while problems are slowly spreading to more expensive neighborhoods. We're also seeing some lenders become more accommodating to work-outs or short sales, while others appear to be getting stricter about delinquencies. It's very noisy out there," [John Walsh, DataQuick president] said.The foreclosure rates in the mid-to-high end areas will never be as high as in the low end areas, but the percentage of total foreclosures will probably continue to increase. I also expect the average time in the foreclosure process to start to decrease this year as the lenders start clearing out the backlog.
The state's most affordable sub-markets, which represent 25 percent of the state's housing stock, accounted for 47.5 percent of all default activity a year ago. In first-quarter 2010 that fell to 40.9 percent.
California's mid- to high-end housing markets were more likely to have seen a rise in mortgage defaults last quarter, though the concentration of default activity - measured by defaults per 1,000 homes - remained relatively low in those areas.
For example, zip codes statewide with median home sale prices of $500,000-plus saw mortgage defaults buck the overall trend and rise 1.5 percent last quarter compared with the prior quarter, while year-over-year the decline was 19 percent (versus a 40.2 percent marketwide annual decrease). Collectively, these zips saw 4.5 default notices filed for every 1,000 homes in the community, compared with the overall market's rate of 9.3 NODs for every 1,000 homes statewide.
In zip codes with medians below $500,000, mortgage default filings fell 5.8 percent from the prior quarter and declined nearly 43 percent from a year earlier. However, collectively these zips saw 10.5 NODs filed for every 1,000 homes - more than double the default rate for the zips with $500,000-plus medians.
On average, homes foreclosed on last quarter spent 7.5 months winding their way through the formal foreclosure process, beginning with an NOD. A year ago it was 6.8 months. The increase could reflect, among other things, lender backlogs and extra time needed to pursue possible loan modifications and short sales.
Foreclosure resales accounted for 42.6 percent of all California resale activity last quarter. It was up from a revised 40.6 percent the prior quarter, and down from 57.8 percent a year ago, the peak.


