 RSS Feed
 by Calculated Risk on 2/01/2011 12:45:00 PM
Showing posts with label Construction Spending. Show all posts
Showing posts with label Construction Spending. Show all posts
Tuesday, February 01, 2011
Private Construction Spending decreases in December
Catching up ... the Census Bureau reported this morning that overall construction spending decreased in December compared to November.
[C]onstruction spending during December 2010 was estimated at a seasonally adjusted annual rate of $787.9 billion, 2.5 percent (±1.3%) below the revised November estimate of $807.8 billion.Private construction spending also decreased in December:
Spending on private construction was at a seasonally adjusted annual rate of $486.9 billion, 2.2 percent (±1.1%) below the revised November estimate of $498.0 billion. Residential construction was at a seasonally adjusted annual rate of $226.4 billion in December, 4.1 percent (±1.3%) below the revised November estimate of $236.1 billion. Nonresidential construction was at a seasonally adjusted annual rate of $260.5 billion in December, 0.5 percent (±1.1%)* below the revised November estimate of $261.9 billion.
 Click on graph for larger image in graph gallery.
This graph shows private residential and nonresidential construction spending since 1993. Note: nominal dollars, not inflation adjusted.
Both private residential and non-residential construction spending decreased in December.
Residential spending is 66.5% below the peak in early 2006, and non-residential spending is 37% below the peak in January 2008.
Sometime this year (in 2011), residential construction spending will probably pass non-residential spending. Although I expect the recovery in residential spending to be sluggish, residential investment will probably make a positive contribution to GDP and employment growth in 2011 for the first time since 2005. And that is one of the reasons I think growth (both GDP and employment) will be better in 2011 than in 2010.
Wednesday, December 01, 2010
Private Construction Spending increases in October
by Calculated Risk on 12/01/2010 11:00:00 AM
The Census Bureau reported overall construction spending increased in October compared to September.
[C]onstruction spending during October 2010 was estimated at a seasonally adjusted annual rate of $802.3 billion, 0.7 percent (±1.4%)* above the revised September estimate of $797.1 billion.Private construction spending also increased in October:
Spending on private construction was at a seasonally adjusted annual rate of $481.8 billion, 0.8 percent (±1.1%)* above the revised September estimate of $477.8 billion.
 Click on graph for larger image in new window.
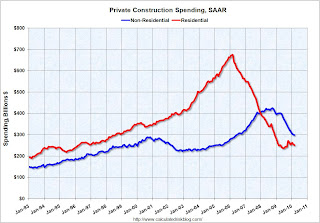
This graph shows private residential and nonresidential construction spending since 1993. Note: nominal dollars, not inflation adjusted.
Private residential spending increased in October; private non-residential construction spending is still declining. Residential spending is 66% below the peak early 2006, and non-residential spending is 39% below the peak in January 2008.
Residential investment (RI) will probably be a minimal drag on Q4 GDP growth (or even make a slight positive contribution), and even though the recovery in RI will be sluggish, I expect RI will make a positive contribution to GDP growth in 2011. Non-residential investment will probably bottom sometime next year, but stay depressed for some time.
Monday, November 01, 2010
Private Construction Spending Flat in September: July and August Revised Down
by Calculated Risk on 11/01/2010 10:53:00 AM
The Census Bureau reported overall construction spending increased in September compared to August.
[C]onstruction spending during September 2010 was estimated at a seasonally adjusted annual rate of $801.7 billion, 0.5 percent (±1.9%)* above the revised August estimate of $797.5 billion.However private construction spending was about the same as the downwardly revised August rate:
Spending on private construction was at a seasonally adjusted annual rate of $482.0 billion, nearly the same as (±1.1%)* the revised August estimate of $481.9 billion. [revised down from $498.2 billion]
 Click on graph for larger image in new window.
This graph shows private residential and nonresidential construction spending since 1993. Note: nominal dollars, not inflation adjusted.
Residential spending is 65.7% below the peak early 2006, and non-residential spending is 39.5% from the peak in January 2008.
The downward revisions to construction spending in July and August were significant.
These downward revisions will negatively impact Q3 GDP for both residential investment, and non-residential investment in structures.
Friday, October 01, 2010
Private Construction Spending declines in August
by Calculated Risk on 10/01/2010 12:30:00 PM
Catching up with all the data this morning ...
The Census Bureau reported overall construction spending increased slightly in August.
[C]onstruction spending during August 2010 was estimated at a seasonally adjusted annual rate of $811.8 billion, 0.4 percent (±1.8%)* above the revised July estimate of $808.6 billion.However private construction spending declined again:
Spending on private construction was at a seasonally adjusted annual rate of $498.2 billion, 0.9 percent (±1.1%)* below the revised July estimate of $502.6 billion. Residential construction was at a seasonally adjusted annual rate of $238.5 billion in August, 0.3 percent (±1.3%)* below the revised July estimate of $239.1 billion. Nonresidential construction was at a seasonally adjusted annual rate of $259.7 billion in August, 1.4 percent (±1.1%) below the revised July estimate of $263.5 billion.
 Click on graph for larger image in new window.
This graph shows private residential and nonresidential construction spending since 1993. Note: nominal dollars, not inflation adjusted.
Both residential and non-residential private construction spending declined in August. Residential spending is 64.7% below the peak early 2006, and 4.7% above the recent low in 2009.
Non-residential spending is 37.3% from the peak in January 2008.
 On a year-over-year basis, residential spending has turned slightly negative after the tax credit expired - and this indicates residential investment (RI) will be a drag on Q3 GDP.
 Non-residential spending is still off sharply from last year (down 24%), but the rate of decline might be slowing. As major projects are completed, I expect private non-residential spending to fall below residential spending later this year or in early 2011.
Wednesday, September 01, 2010
Construction Spending declines in July
by Calculated Risk on 9/01/2010 10:15:00 AM
Note: the ISM PMI increased to 56.3 from 55.5 in July (I'll have more later).
Overall construction spending decreased in July.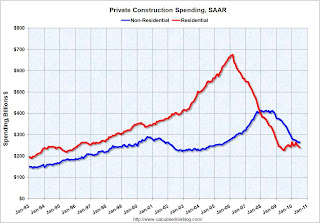 Click on graph for larger image in new window.
This graph shows private residential and nonresidential construction spending since 1993. Note: nominal dollars, not inflation adjusted.
From the Census Bureau: July 2010 Construction at $805.2 Billion Annual Rate
The U.S. Census Bureau of the Department of Commerce announced today that construction spending during July 2010 was estimated at a seasonally adjusted annual rate of $805.2 billion, 1.0 percent (±1.4%)* below the revised June estimate of $813.1 billion. The July figure is 10.7 percent (±1.8%) below the July 2009 estimate of $901.2 billion.Private residential construction spending has turned down again - after the tax credit expired - and residential investment (RI) will be a drag on Q3 GDP. The "good" news is the overall drag from RI will be much smaller than during 2006, 2007 and 2008.
...
Spending on private construction was at a seasonally adjusted annual rate of $506.4 billion, 0.8 percent (±1.3%)* below the revised June estimate of $510.7 billion. Residential construction was at a seasonally adjusted annual rate of $240.3 billion in July, 2.6 percent (±1.3%) below the revised June estimate of $246.7 billion. Nonresidential construction was at a seasonally adjusted annual rate of $266.1 billion in July, 0.8 percent (±1.3%)* above the revised June estimate of $264.0billion.
Monday, August 02, 2010
Private Construction Spending declines in June
by Calculated Risk on 8/02/2010 12:06:00 PM
Overall construction spending increased slightly in June, and private construction spending, both residential and non-residential, decreased in June. Click on graph for larger image in new window.
This graph shows private residential and nonresidential construction spending since 1993. Note: nominal dollars, not inflation adjusted.
Residential spending is now 62% below the peak of early 2006.
Private non-residential construction was revised down for both April and May, and spending is now 35% below the peak of late 2008.
From the Census Bureau: June 2010 Construction at $836.0 Billion Annual Rate
The U.S. Census Bureau of the Department of Commerce announced today that construction spending during June 2010 was estimated at a seasonally adjusted annual rate of $836.0 billion, 0.1 percent (±1.6%)* above the revised May estimate of $834.8 billion.I expect:
...
Spending on private construction was at a seasonally adjusted annual rate of $527.6 billion, 0.6 percent (±1.3%)* below the revised May estimate of $530.9 billion. Residential construction was at a seasonally adjusted annual rate of $258.3 billion in June, 0.8 percent (±1.3%)* below the revised May estimate of $260.3 billion. Nonresidential construction was at a seasonally adjusted annual rate of $269.3 billion in June, 0.5 percent (±1.3%)* below the revised May estimate of $270.6 billion.
Residential spending will probably exceed non-residential later this year (or early 2011), but that will be mostly because of weakness in non-residential construction, as opposed to any significant increases in residential spending.
Thursday, July 01, 2010
Construction Spending declined in May
by Calculated Risk on 7/01/2010 12:25:00 PM
Overall construction spending declined in May, and private construction spending, both residential and non-residential, also decreased. From the Census Bureau: May 2010 Construction at $841.9 Billion Annual Rate
The U.S. Census Bureau of the Department of Commerce announced today that construction spending during May 2010 was estimated at a seasonally adjusted annual rate of $841.9 billion, 0.2 percent below the revised April estimate of $843.3 billion.
...
Spending on private construction was at a seasonally adjusted annual rate of $536.3 billion, 0.5 percent below the revised April estimate of $538.9 billion. Residential construction was at a seasonally adjusted annual rate of $260.8 billion in May, 0.4 percent below the revised April estimate of $261.7 billion. Nonresidential construction was at a seasonally adjusted annual rate of $275.6 billion in May, 0.6 percent below the revised April estimate of $277.2 billion.
 Click on graph for larger image in new window.
This graph shows private residential and nonresidential construction spending since 1993. Note: nominal dollars, not inflation adjusted.
Private residential construction spending appears to have bottomed in early 2009, but has only increased gradually since then. Residential spending is now 61% below the peak of early 2006.
Private non-residential construction spending is now 33% below the peak of late 2008.
Residential spending will probably exceed non-residential later this year (or early 2011), but that will be mostly because of weakness in non-residential construction, as opposed to any significant increase in residential spending.
Tuesday, June 01, 2010
Construction Spending increases in April
by Calculated Risk on 6/01/2010 10:30:00 AM
Overall construction spending increased in April, and private construction spending, both residential and non-residential, also increased in April. From the Census Bureau: April 2010 Construction at $847.3 Billion Annual Rate
The U.S. Census Bureau of the Department of Commerce announced today that construction spending during April 2010 was estimated at a seasonally adjusted annual rate of $869.1 billion, 2.7 percent (±1.4%) above the revised March estimate of $845.9 billion. The April figure is 10.5 percent (±1.6%) below the April 2009 estimate of $971.4 billion. ... Spending on private construction was at a seasonally adjusted annual rate of $565.8 billion, 2.9 percent (±1.1%) above the revised March estimate of $549.7 billion.
 Click on graph for larger image in new window.
The first graph shows private residential and nonresidential construction spending since 1993. Note: nominal dollars, not inflation adjusted.
Private residential construction spending appears to have bottomed in early 2009, but has been mostly moving sideways since then. Residential spending is now 61% below the peak of early 2006.
Private non-residential construction spending is now 29% below the peak of late 2008.
 The second graph shows the year-over-year change for private residential and nonresidential construction spending.
Nonresidential spending is off 24.6% on a year-over-year (YoY) basis.
Residential construction spending is now up 4.1% from a year ago (easy comparison), and will probably decline slightly later this year.
Private residential spending will probably exceed non-residential spending later this year - mostly because of continued declines in non-residential spending. Private construction will be a weak sector for some time.
Monday, May 03, 2010
Private Construction Spending Declines in March
by Calculated Risk on 5/03/2010 10:28:00 AM
Overall construction spending increased in March, with a boost from public spending, however private construction spending - both residential and non-residential - declined in March. From the Census Bureau: March 2010 Construction at $847.3 Billion Annual Rate
The U.S. Census Bureau of the Department of Commerce announced today that construction spending during March 2010 was estimated at a seasonally adjusted annual rate of $847.3billion, 0.2 percent (±1.3%)* above the revised February estimate of $845.5 billion. ... Spending on private construction was at a seasonally adjusted annual rate of $550.8 billion, 0.9 percent (±1.4%)* below the revised February estimate of $555.7 billion.
 Click on graph for larger image in new window.
The first graph shows private residential and nonresidential construction spending since 1993. Note: nominal dollars, not inflation adjusted.
Private residential construction spending appears to have bottomed in early 2009, but has been mostly moving sideways since then. Residential spending is now 62.8% below the peak of early 2006.
Private non-residential construction spending continues to decline as major projects are completed. Non-residential spending is now 29.9% below the peak of late 2008.
 The second graph shows the year-over-year change for private residential and nonresidential construction spending.
Nonresidential spending is off 25.5% on a year-over-year (YoY) basis.
Residential construction spending is now up slightly from a year ago.
Private residential spending will probably exceed non-residential spending later this year - mostly because of continued declines in non-residential spending. Private consturction will be a weak sector for some time.
Thursday, April 01, 2010
Construction Spending Declines in February
by Calculated Risk on 4/01/2010 10:20:00 AM
Private residential construction spending has turned down again over the last few months. I expect some growth in residential spending in 2010, but the increases will probably be sluggish until the large overhang of existing inventory is reduced.
Private non-residential spending decreased in February, and is now at the lowest level since July 2006. The collapse in non-residential construction spending continues ...  Click on graph for larger image in new window.
The first graph shows private residential and nonresidential construction spending since 1993. Note: nominal dollars, not inflation adjusted.
Private residential construction spending is now 62.9% below the peak of early 2006.
Private non-residential construction spending is 29.0% below the peak of late 2008. The second graph shows the year-over-year change for private residential and nonresidential construction spending.
Nonresidential spending is off 24.3% on a year-over-year (YoY) basis.
Residential construction spending is down 3.8% from a year ago, and the negative YoY change is getting smaller.
Residential spending will probably exceed non-residential spending later this year - mostly because of continued declines in non-residential spending as major projects are completed.
Here is the report from the Census Bureau: February 2010 Construction at $846.2 Billion Annual Rate
The U.S. Census Bureau of the Department of Commerce announced today that construction spending during February 2010 was estimated at a seasonally adjusted annual rate of $846.2 billion, 1.3 percent below the revised January estimate of $857.8 billion. The February figure is 12.8 percent below the February 2009 estimate of $970.4 billion.
Monday, March 01, 2010
Construction Spending Declines in January
by Calculated Risk on 3/01/2010 10:30:00 AM
Private residential construction spending was up slightly in January, but is mostly moving sideways. I expect some growth in residential spending in 2010, but the increases will probably be sluggish until the large overhang of existing inventory is reduced.
Non-residential spending decreased in January, and is now at the lowest level since November 2006. The collapse in non-residential construction spending continues ...  Click on graph for larger image in new window.
The first graph shows private residential and nonresidential construction spending since 1993. Note: nominal dollars, not inflation adjusted.
Residential construction spending increased slighltly in January, and nonresidential spending declined.
Monday, February 01, 2010
Construction Spending Declines in December
by Calculated Risk on 2/01/2010 10:21:00 AM
Residential construction spending was off slightly in December, and is now about 10% above the bottom in June 2009. I expect some growth in residential spending in 2010, but the increases will probably be sluggish until the large overhang of existing inventory is reduced.
Non-residential increased slightly in December, but the trend is clearly down. The collapse in non-residential construction spending continues ...  Click on graph for larger image in new window.
The first graph shows private residential and nonresidential construction spending since 1993. Note: nominal dollars, not inflation adjusted.
Residential construction spending decreased in December, and nonresidential spending increased slightly.
Private residential construction spending is now 61.5% below the peak of early 2006.
Private non-residential construction spending is 22.0% below the peak of October 2008. The second graph shows the year-over-year change for private residential and nonresidential construction spending.
Nonresidential spending is off 17.7% on a year-over-year (YoY) basis.
Residential construction spending is down 10.3% from a year ago, and the negative YoY change is getting smaller.
Only over the last few months - for the first time since the housing bust started - has nonresidential spending been off more on a YoY basis than residential.
Here is the report from the Census Bureau: December 2009 Construction at $902.5 Billion Annual Rate
Monday, January 04, 2010
Construction Spending Declines in November
by Calculated Risk on 1/04/2010 10:23:00 AM
Through November construction spending has followed the expected script for 2009: a likely bottom for residential construction spending, and a collapse in private non-residential construction.
Residential construction spending was off slightly in November, and is now only 5.8% above the bottom earlier in 2009. I expect some residential spending growth in 2010, but the increases in spending will probably be sluggish until the large overhang of existing inventory is reduced.
Non-residential appeared flat in November, but that was only because of a downward revision to October spending. The collapse in non-residential construction spending continues ...  Click on graph for larger image in new window.
The first graph shows private residential and nonresidential construction spending since 1993. Note: nominal dollars, not inflation adjusted.
Residential construction spending decreased in November, and nonresidential spending continued to decline.
Private residential construction spending is now 62.9% below the peak of early 2006.
Private non-residential construction spending is 22.5% below the peak of October 2008. The second graph shows the year-over-year change for private residential and nonresidential construction spending.
Nonresidential spending is off 22.5% on a year-over-year (YoY) basis.
Residential construction spending is still off 22.2% from a year ago, but the negative YoY change is getting smaller.
For the first time since the housing bust started, nonresidential spending is off more on a YoY basis than residential.
Here is the report from the Census Bureau: November 2009 Construction at $900.1 Billion Annual Rate
Tuesday, December 01, 2009
Construction Spending Flat in October
by Calculated Risk on 12/01/2009 10:00:00 AM
We started the year looking for two key construction spending stories: a likely bottom for residential construction spending, and the collapse in private non-residential construction.
It appears residential construction spending may have bottomed, although any growth in spending will probably be sluggish until the large overhang of existing inventory is reduced.
And the collapse in non-residential construction spending continues, and there will be further declines as projects are completed. Click on graph for larger image in new window.
The first graph shows private residential and nonresidential construction spending since 1993. Note: nominal dollars, not inflation adjusted.
Residential construction spending increased in October, and nonresidential spending continued to decline.
Private residential construction spending is now 63% below the peak of early 2006.
Private non-residential construction spending is 20.6% below the peak of last October.  The second graph shows the year-over-year change for private residential and nonresidential construction spending.
Nonresidential spending is off 20.6% on a year-over-year basis.
Residential construction spending is still off 23.6% from a year ago, although the negative YoY change will get smaller going forward.
Here is the report from the Census Bureau: October 2009 Construction at $910.8 Billion Annual Rate
Monday, November 02, 2009
Construction Spending increases in September
by Calculated Risk on 11/02/2009 10:26:00 AM
We started the year looking for two key construction spending stories: a likely bottom for residential construction spending, and the collapse in private non-residential construction.
It appears residential construction spending may have bottomed, although any growth in spending will probably be sluggish until the large overhang of existing inventory is reduced.
And the collapse in non-residential construction spending has started, and there will be further declines to come as projects are completed. Click on graph for larger image in new window.
The first graph shows private residential and nonresidential construction spending since 1993. Note: nominal dollars, not inflation adjusted.
Residential construction spending increased in September, and nonresidential spending continued to decline.
Private residential construction spending is now 62.2% below the peak of early 2006.
Private non-residential construction spending is still only 16.0% below the peak of last September.  The second graph shows the year-over-year change for private residential and nonresidential construction spending.
Nonresidential spending is off 15.4% on a year-over-year basis.
Residential construction spending is still off significantly from a year ago, although the negative YoY change will get smaller going forward.
Here is the report from the Census Bureau: September 2009 Construction at $940.3 Billion Annual Rate
Thursday, October 01, 2009
Construction Spending increases in August
by Calculated Risk on 10/01/2009 10:26:00 AM
We started the year looking for two key construction spending stories: a likely bottom for residential construction spending, and the collapse in private non-residential construction. This report shows further evidence of both stories. Click on graph for larger image in new window.
The first graph shows private residential and nonresidential construction spending since 1993. Note: nominal dollars, not inflation adjusted.
Residential construction spending increased in August, and nonresidential spending continued to decline.
Private residential construction spending is now 63.1% below the peak of early 2006. Although it appears residential construction spending may have bottomed, any growth in spending will probably be sluggish until the large overhang of existing inventory is reduced.
Private non-residential construction spending is still only 12.6% below the peak of last September. The second graph shows the year-over-year change for private residential and nonresidential construction spending.
Nonresidential spending is off 10.5% on a year-over-year basis, and will turn strongly negative as projects are completed. Residential construction spending is still declining YoY, although the negative YoY change will get smaller going forward.
From the Census Bureau: August 2009 Construction at $941.9 Billion Annual Rate
The U.S. Census Bureau of the Department of Commerce announced today that construction spending during August 2009 was estimated at a seasonally adjusted annual rate of $941.9 billion, 0.8 percent (±1.8%) above the revised July estimate of $934.6 billion. The August figure is 11.6 percent (±1.8%) below the August 2008 estimate of $1,066.1 billion.
Tuesday, September 01, 2009
Construction Spending in July
by Calculated Risk on 9/01/2009 10:29:00 AM
Two of the key stories in 2009 are the probable bottom for residential construction spending, and the collapse in private non-residential construction. Both stories are still developing ... but this report shows further evidence of both stories. Click on graph for larger image in new window.
The first graph shows private residential and nonresidential construction spending since 1993. Note: nominal dollars, not inflation adjusted.
Residential construction spending increased in July, and nonresidential spending continued to decline.
Private residential construction spending is now 63.7% below the peak of early 2006.
Private non-residential construction spending is still only 9.7% below the peak of last September. The second graph shows the year-over-year change for private residential and nonresidential construction spending.
Nonresidential spending is off 8.3% on a year-over-year basis, and will turn strongly negative as projects are completed. Residential construction spending is still declining YoY, although the negative YoY change will get smaller going forward.
From the Census Bureau: July 2009 Construction at $958 Billion Annual Rate
Monday, August 03, 2009
Construction Spending Increases Slightly in June
by Calculated Risk on 8/03/2009 10:21:00 AM
Private residential construction spending increased slightly in June and is now 63.6%% below the peak of early 2006.
Private non-residential construction spending declined in June, but is only off 6.7% below the peak of last September.
Overall construction spending increased with a boost from public spending. Click on graph for larger image in new window.
The first graph shows private residential and nonresidential construction spending since 1993. Note: nominal dollars, not inflation adjusted.
Residential construction spending increased slightly in June, and nonresidential spending declined a little. From other data (new housing starts), it appears that residential spending has stabilized and might increase in Q3 - however private nonresidential construction will be falling off a cliff. The second graph shows the year-over-year change for private residential and nonresidential construction spending.
Nonresidential spending is off 4.8% on a year-over-year basis, and will turn strongly negative as projects are completed. Residential construction spending is still declining YoY, although the negative YoY change will get smaller going forward.
As I've noted before, these will probably be two key stories for late 2009: the collapse in private non-residential construction, and the probable bottom for residential construction spending. Both stories are still developing ...
From the Census Bureau: June 2009 Construction at $965.7 Billion Annual Rate
Spending on private construction was at a seasonally adjusted annual rate of $643.9 billion, 0.1 percent (±1.1%)* below the revised May estimate of $644.8 billion. Residential construction was at a seasonally adjusted annual rate of $246.1 billion in June, 0.5 percent (±1.3%)* above the revised May estimate of $244.7 billion. Nonresidential construction was at a seasonally adjusted annual rate of $397.9 billion in June, 0.5 percent (±1.1%)* below the revised May estimate of $400.0 billion.
In June, the estimated seasonally adjusted annual rate of public construction spending was $321.7 billion, 1.0 percent (±2.4%)* above the revised May estimate of $318.5 billion.
Wednesday, July 01, 2009
Constructon Spending Declines in May
by Calculated Risk on 7/01/2009 10:15:00 AM
Private residential construction spending is 64.5% below the peak of early 2006.
Private non-residential construction spending is only off 4.1% below the peak of last September. Click on graph for larger image in new window.
The first graph shows private residential and nonresidential construction spending since 1993. Note: nominal dollars, not inflation adjusted.
Residential construction spending fell further in May, and nonresidential spending was up a little (because of private spending on power), but will probably decline sharply over the next two years. The second graph shows the year-over-year change for private residential and nonresidential construction spending.
Nonresidential spending is off 3.3% on a year-over-year basis, and will turn strongly negative as projects are completed. Residential construction spending is still declining YoY, although the negative YoY change should be smaller going forward.
As I've noted before, these will probably be two key stories for late 2009: the collapse in private non-residential construction, and the probable bottom for residential construction spending. Both stories are still developing ...
From the Census Bureau: May 2009 Construction at $968.7 Billion Annual Rate
Spending on private construction was at a seasonally adjusted annual rate of $649.2 billion, 1.0 percent (±1.1%)* below the revised April estimate of $655.6 billion. Residential construction was at a seasonally adjusted annual rate of $240.2 billion in May, 3.4 percent (±1.3%) below the revised April estimate of $248.8 billion. Nonresidential construction was at a seasonally adjusted annual rate of $409.0 billion in May, 0.5 percent (±1.1%)* above the revised April estimate of $406.9 billion.
Monday, June 01, 2009
Construction Spending in April
by Calculated Risk on 6/01/2009 10:17:00 AM
Private residential construction spending is 63.2% below the peak of early 2006.
Private non-residential construction spending is 4.4% below the peak of last September. Click on graph for larger image in new window.
The first graph shows private residential and nonresidential construction spending since 1993. Note: nominal dollars, not inflation adjusted.
Residential construction spending was up slightly in April (compared to March), and nonresidential spending has peaked and will probably decline sharply over the next two years. The second graph shows the year-over-year change for private residential and nonresidential construction spending.
Nonresidential spending is essentially flat on a year-over-year basis, and will turn strongly negative as projects are completed. Residential construction spending is still declining YoY, although the YoY change is starting to be less negative.
As I've noted before, these will probably be two key stories for 2009: the collapse in private non-residential construction, and the probable bottom for residential construction spending. Both stories are just developing ...
From the Census Bureau: April 2009 Construction at $968.7 Billion Annual Rate
Spending on private construction was at a seasonally adjusted annual rate of $657.3 billion, 1.4 percent (±1.3%) above the revised March estimate of $648.2 billion. Residential construction was at a seasonally adjusted annual rate of $249.2 billion in April, 0.7 percent (±1.3%)* above the revised March estimate of $247.4 billion. Nonresidential construction was at a seasonally adjusted annual rate of $408.2 billion in April, 1.8 percent (±1.3%) above the revised March estimate of $400.8 billion.


