by Calculated Risk on 5/04/2009 10:01:00 AM
Monday, May 04, 2009
Private Construction Spending Declines Slightly in March
Private residential construction spending is 61.8% below the peak of early 2006.
Private non-residential construction spending is 5.7% below the peak of last September. Click on graph for larger image in new window.
The first graph shows private residential and nonresidential construction spending since 1993. Note: nominal dollars, not inflation adjusted.
Residential construction spending is still declining, and now nonresidential spending has peaked and will probably decline sharply over the next 18 months to two years. The second graph shows the year-over-year change for private residential and nonresidential construction spending.
Nonresidential spending is essentially flat on a year-over-year basis, and will turn strongly negative going forward. Residential construction spending is still declining, although the YoY change will probably be less negative going forward.
As I've noted before, these will probably be two key stories for 2009: the collapse in private non-residential construction, and the probable bottom for residential construction spending. Both stories are just developing ...
From the Census Bureau: February 2009 Construction at $967.5 Billion Annual Rate
Spending on private construction was at a seasonally adjusted annual rate of $661.0 billion, 0.1 percent (±1.4%) below the revised February estimate of $661.6 billion. Residential construction was at a seasonally adjusted annual rate of $258.4 billion in March, 4.2 percent (±1.3%) below the revised February estimate of $269.6 billion. Nonresidential construction was at a seasonally adjusted annual rate of $402.6 billion in March, 2.7 percent (±1.4%) above the revised February estimate of $392.0 billion.
Wednesday, April 01, 2009
Construction Spending Declines in February
by Calculated Risk on 4/01/2009 10:00:00 AM
Residential construction spending is 59.3% below the peak of early 2006.
Non-residential construction spending is 8.5% below the peak of last September. Click on graph for larger image in new window.
The first graph shows private residential and nonresidential construction spending since 1993. Note: nominal dollars, not inflation adjusted.
Residential construction spending is still declining, and now nonresidential spending has peaked and will probably decline sharply over the next 18 months to two years. The second graph shows the year-over-year change for private residential and nonresidential construction spending.
Nonresidential spending is now slightly negative on a year-over-year basis, and will turn strongly negative going forward. Residential construction spending is still declining, although the YoY change will probably be less negative going forward.
These are two key stories for 2009: the collapse in private non-residential construction, and the probably bottom for residential construction spending.
From the Census Bureau: February 2009 Construction at $967.5 Billion Annual Rate
Spending on private construction was at a seasonally adjusted annual rate of $665.9 billion, 1.6 percent (±1.1%) below the revised January estimate of $676.9 billion. Residential construction was at a seasonally adjusted annual rate of $275.1 billion in February, 4.3 percent (±1.3%) below the revised January estimate of $287.4 billion. Nonresidential construction was at a seasonally adjusted annual rate of $390.7 billion in February, 0.3 percent (±1.1%)* above the revised January estimate of $389.5 billion.
Monday, March 02, 2009
Construction Spending: Non-Residential Cliff Diving
by Calculated Risk on 3/02/2009 10:01:00 AM
 Click on graph for larger image in new window.
The first graph shows private residential and nonresidential construction spending since 1993. Note: nominal dollars, not inflation adjusted.
Residential construction spending is still declining, and now nonresidential spending has peaked and will probably decline sharply over the next 18 months to two years. The second graph shows the year-over-year change for private residential and nonresidential construction spending.
Nonresidential spending is now at the year ago level and will turn strongly negative going forward. Residential construction spending is still declining, although the YoY change will probably be less negative going forward.
These are two key stories for 2009: the collapse in private non-residential construction, and the probably bottom for residential construction spending.
From the Census Bureau: January 2009 Construction at $986.2 Billion Annual Rate
Spending on private construction was at a seasonally adjusted annual rate of $682.6 billion, 3.7 percent (±1.1%) below the revised December estimate of $709.0 billion. Residential construction was at a seasonally adjusted annual rate of $291.5 billion in January, 2.9 percent (±1.3%) below the revised December estimate of $300.3 billion. Nonresidential construction was at a seasonally adjusted annual rate of $391.0 billion in January, 4.3 percent (±1.1%) below the revised December estimate of $408.7 billion.
Monday, February 02, 2009
Construction Spending: Private Nonresidential has Peaked
by Calculated Risk on 2/02/2009 10:00:00 AM
From the Census Bureau: December 2008 Construction at $1,053.7 Billion Annual Rate
Spending on private construction was at a seasonally adjusted annual rate of $737.1 billion, 1.7 percent (±1.1%) below the revised November estimate of $749.6 billion. Residential construction was at a seasonally adjusted annual rate of $319.2 billion in December, 3.2 percent (±1.3%) below the revised November estimate of $329.9 billion. Nonresidential construction was at a seasonally adjusted annual rate of $417.9 billion in December, 0.4 percent (±1.1%)* below the revised November estimate of $419.7 billion.
The value of private construction in 2008 was $770.4 billion, 9.4 percent (±1.8%)below the $850.0 billion spent in 2007. Residential construction in 2008 was $358.4 billion, 27.2 percent (±2.2%) below the 2007 figure of $492.5 billion and nonresidential construction was $412.0 billion, 15.3 percent (±1.8%) above the $357.5 billion in 2007..
 Click on graph for larger image in new window.
The first graph shows private residential and nonresidential construction spending since 1993. Note: nominal dollars, not inflation adjusted.
Residential construction spending is still declining, and now nonresidential spending has peaked and will probably decline sharply over the next 18 months.

The second graph shows the year-over-year change for private residential and nonresidential construction spending.
The YoY change in nonresidential spending is slowing down and will probably turn negative in the first half of 2009. Residential construction spending is still declining, but the rate of decline has slowed.
This shows hints of two key stories for 2009: 1) a collapse in private nonresidential construction spending, and 2) and the possibility of a bottom in private residential construction spending (It might not happen in '09, but we can finally start looking).
Wednesday, January 28, 2009
Architecture Billings Index as a Leading Indicator of Construction Spending
by Calculated Risk on 1/28/2009 05:59:00 PM
Back in 2005, Kermit Baker and Diego Saltes of the American Institute of
Architects wrote a white paper: Architecture Billings as a Leading Indicator of Construction
Here is a graph from their paper: Click on graph for larger image in new window.
This graph from 2005 compares the Architecture Billings Index from the American Institute of Architects and year-over-year change in non-residential construction spending from the Census Bureau. The correlation is pretty strong (see the paper for more).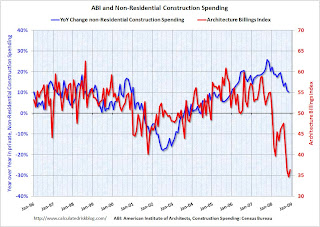 The second graph is an update through Dec 2008 for the ABI, and Nov 2008 for construction spending.
I've had to change the scale to fit the collapse in the ABI on the graph.
The ABI typically leads construction spending by about 9 to 12 months according to AIA chief economist Kermit Baker. This graph also suggests the collapse will be very sharp, and although there isn't enough data to know if this is predictive of the percentage decline in spending, it does suggest a possible year-over-year decline of perhaps 30% in non-residential construction spending.
In November, private non-residential construction spending was at $428.2 billion annual rate. A 30% decline would be to an annual rate of $300 billion or so. Ouch.
Monday, January 05, 2009
Construction Spending Declines in November
by Calculated Risk on 1/05/2009 10:00:00 AM
From the Census Bureau: November 2008 Construction at $1,078.4 Billion Annual Rate
Spending on private construction was at a seasonally adjusted annual rate of $756.4 billion, 1.5 percent (±1.1%) below the revised October estimate of $767.7 billion. Residential construction was at a seasonally adjusted annual rate of $328.3 billion in November, 4.2 percent (±1.3%) below the revised October estimate of $342.6 billion. Nonresidential construction was at a seasonally adjusted annual rate of $428.2 billion in November, 0.7 percent (±1.1%)* above the revised October estimate of $425.1 billion.
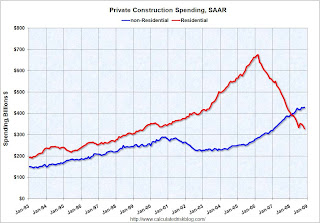 Click on graph for larger image in new window.
The first graph shows private residential and nonresidential construction spending since 1993.
Nonresidential spending is still holding up as builders complete projects, but there is substantial evidence of a slowdown - less lending for new projects, less work for architects - and it appears that non-residential spending has peaked. On the graph nonresidential spending has been relatively flat for the last few months, but I expect some serious cliff diving over the next 18 months.

The second graph shows the year-over-year change for private residential and non-residential construction spending.
The YoY change in non-residential spending is starting to slow down and will probably turn negative early in 2009. Residential construction spending is still declining, but the rate of decline has slowed.
Also - it now looks like investment in non-residential structures might be neutral for GDP in Q4.
Monday, December 01, 2008
Construction Spending Declines in October
by Calculated Risk on 12/01/2008 10:00:00 AM
The Census Bureau reported this morning that private non-residential construction decreased in October with declines in both residential and non-residential spending. I expect that non-residential investment will decline sharply over the next year or two.
From the Census Bureau: September 2008 Construction at $1,060.1 Billion Annual Rate
Spending on private construction was at a seasonally adjusted annual rate of $756.5 billion, 2.0 percent (±1.1%) below the revised September estimate of $771.9 billion. Residential construction was at a seasonally adjusted annual rate of $338.8 billion in October, 3.5 percent (±1.3%) below the revised September estimate of $351.2 billion. Nonresidential construction was at a seasonally adjusted annual rate of $417.7 billion in October, 0.7 percent (±1.1%)* below the revised September estimate of $420.6 billion.
 Click on graph for larger image in new window.
The graph shows private residential and nonresidential construction spending since 1993.
Nonresidential spending had been strong as builders completed projects, but there is substantial evidence of a slowdown - less lending for new projects, less work for architects - and it appears the expected slowdown in non-residential spending has arrived. On the graph nonresidential spending has been relatively flat for the last few months, but I expect some serious cliff diving over the next 18 months.

The second graph shows the year-over-year change for private residential and non-residential construction spending.
The YoY change in non-residential spending is starting to slow down and will probably turn negative later this year or early in 2009.
It now looks like investment in non-residential structures will negatively impact GDP in Q4. This had been one of the few bright spots for the economy.
Tuesday, November 04, 2008
UK Construction Activity Declines Sharply
by Calculated Risk on 11/04/2008 12:21:00 PM
From The Times: Job cuts rise amid record construction fall
Construction activity in the UK fell at a record rate last month as demand for new houses and commercial property continued to wane amid the global financial turmoil, according to a key industry survey.Synchronized cliff diving ...
The CIPS/Construction Purchasing Managers' Index measured construction activity at 35.1 in October — the eighth consecutive monthly fall this year.
Demand for new housing again showed the greatest decline, while commercial property also performed poorly, with activity levels declining at a series-record pace.
Wednesday, October 01, 2008
Non-Residential Construction Spending Declines
by Calculated Risk on 10/01/2008 10:00:00 AM
It now appears that private non-residential construction has peaked, and I expect non-residential investment will decline sharply over the next year.
From the Census Bureau: August 2008 Construction at 1,072.1 Billion Annual Rate
Spending on private construction was at a seasonally adjusted annual rate of $759.6 billion, 0.3 percent below the revised July estimate of $761.8 billion.
Residential construction was at a seasonally adjusted annual rate of $343.6 billion in August, 0.3 percent above the revised July estimate of $342.5 billion.
Nonresidential construction was at a seasonally adjusted annual rate of $416.0 billion in August, 0.8 percent below the revised July estimate of $419.3 billion.
 Click on graph for larger image in new window.
The graph shows private residential and nonresidential construction spending since 1993.
Nonresidential spending has been strong as builders complete projects, but there is substantial evidence of a looming slowdown - less lending for new projects, less work for architects - and it appears the expected slowdown in non-residential spending has arrived.

The second graph shows the year-over-year change for private residential and non-residential construction spending.
The YoY change in non-residential spending is starting to slow down and will probably turn negative later this year or early in 2009.
Not only has Personal Consumption Expenditures (PCE) turned negative in Q3, but it now looks like non-residential investment in structures is starting to decline. This was one of few bright spots in the economy (along with exports), and a decline in non-residential investment is more evidence of a recession.
Friday, September 19, 2008
Architectural Billing Index: More Negative Conditions
by Calculated Risk on 9/19/2008 05:40:00 PM
From the American Institute of Architects: More Negative Conditions for Architecture Billings Index Click on graph for larger image in new window.
While conditions have improved somewhat for three consecutive months, the Architecture Billings Index (ABI) continues to point to unfavorable conditions for the nonresidential construction market. As a leading economic indicator of construction activity, the ABI shows an approximate nine to twelve month lag time between architecture billings and construction spending. The American Institute of Architects (AIA) reported the August ABI rating was 47.6, up slightly from the 46.8 mark in July (any score above 50 indicates an increase in billings). emphasis addedThe key here is that the index fell off a cliff in early 2008, and that there is "an approximate nine to twelve month lag time between architecture billings and construction spending". We should expect weaker non-residential structure investment in the second half of 2008 and throughout 2009.
Wednesday, September 03, 2008
Construction Spending in July
by Calculated Risk on 9/03/2008 02:23:00 AM
Note: I'm back. I had to cut my hiking trip short due to a minor injury. I'm fine, no worries. My thanks to Paul Jackson and Lama for their guest posts. Best to all. CR
Construction spending declined in June for both residential and non-residential private construction.
From the Census Bureau: July 2008 Construction at $1,084.4 Billion Annual Rate
Residential construction was at a seasonally adjusted annual rate of $357.8 billion in July, 2.3 percent below the revised June estimate of $366.1 billion.
Nonresidential construction was at a seasonally adjusted annual rate of $416.8 billion in July, 0.7 percent below the revised June estimate of $419.8 billion.
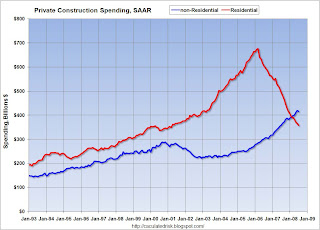 Click on graph for larger image in new window.
This graph shows private residential and nonresidential construction spending since 1993.
It's still too early to call the peak for nonresidential construction spending, but there is substantial evidence of a looming slowdown - less lending for new projects, less work for architects - so June 2008 might have been the peak for this nonresidential construction spending cycle.
Wednesday, August 20, 2008
Architectural Billing Index: "Business Levels Continue to Worsen"
by Calculated Risk on 8/20/2008 02:31:00 PM
From the American Institute of Architects: Architecture Billings Index Continues in Negative Territory Click on graph for larger image in new window.
Despite having its highest score since January, the Architecture Billings Index (ABI) continues to point to difficult conditions for the nonresidential construction market. There have been six consecutive months with negative scores, indicating that business levels at U.S architecture firms continue to worsen. As a leading economic indicator of construction activity, the ABI shows an approximate nine to twelve month lag time between architecture billings and construction spending. The American Institute of Architects (AIA) reported the July ABI rating was 46.8, up slightly from the 46.1 mark in June (any score above 50 indicates an increase in billings). The inquiries for new projects score was 54.6.The key here is that the index fell off a cliff in early 2008, and that there is "an approximate nine to twelve month lag time between architecture billings and construction spending". We should expect weaker non-residential structure investment in the second half of 2008 and throughout 2009.
“Financing for new projects continues to be a problem,” said AIA Chief Economist Kermit Baker, PhD, Hon. AIA. “Many projects are being reconsidered due to construction cost increases. And while there are a good number of projects still in the queue, owners are taking longer to proceed to the next phase of the design process.”
emphasis added
Friday, August 01, 2008
Construction Spending in June
by Calculated Risk on 8/01/2008 10:15:00 AM
Construction spending declined in June for residential, but increased slightly for non-residential private construction.
From the Census Bureau: June 2008 Construction at $1,081.9 Billion Annual Rate
Spending on private construction was at a seasonally adjusted annual rate of $780.6 billion, 0.4 percent below the revised May estimate of $783.9 billion.
Residential construction was at a seasonally adjusted annual rate of $372.5 billion in June, 1.8 percent (±1.3%) below the revised May estimate of $379.1 billion.
Nonresidential construction was at a seasonally adjusted annual rate of $408.1 billion in June, 0.8 percent above the revised May estimate of $404.8 billion.
 Click on graph for larger image in new window.
The graph shows private residential and nonresidential construction spending since 1993. Private non-residential construction spending has now passed residential construction spending for the first time (since the Census Bureau started tracking spending).
Nonresidential spending has been strong as builders complete projects, but there is substantial evidence of a looming slowdown - less lending for new projects, less work for architects - and the expected slowdown in non-residential spending will happen in the 2nd half of 2008.
Tuesday, July 01, 2008
Construction Spending in May
by Calculated Risk on 7/01/2008 10:00:00 AM
Construction spending declined in May for residential, but increased slightly for non-residential private construction.
From the Census Bureau: May 2008 Construction at $1,085.2 Billion Annual Rate
Spending on private construction was at a seasonally adjusted annual rate of $784.2 billion, 0.7 percent below the revised April estimate of $789.4 billion.
Residential construction was at a seasonally adjusted annual rate of $378.9 billion in May, 1.6 percent below the revised April estimate of $385.1 billion.
Nonresidential construction was at a seasonally adjusted annual rate of $405.3 billion in May, 0.2 percent above the revised April estimate of $404.3 billion.
 Click on graph for larger image in new window.
The graph shows private residential and nonresidential construction spending since 1993. With revisions, private non-residential construction spending has now passed residential construction spending for the first time (since the Census Bureau started tracking spending).
Nonresidential spending has been strong as builders complete projects, but there is substantial evidence of a looming slowdown - less lending for new projects, less work for architects - and the expected slowdown in non-residential spending will happen in the 2nd half of 2008.
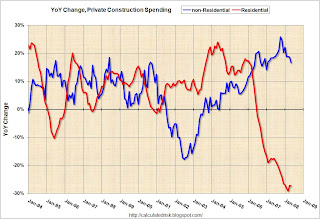
The second graph shows the year-over-year change for private residential and non-residential construction spending.
The YoY change in non-residential spending is starting to slow down and will probably turn negative later this year.
Monday, June 02, 2008
Construction Spending Declines in April
by Calculated Risk on 6/02/2008 10:11:00 AM
Construction spending declined in April for residential, but increased to for non-residential private construction.
From the Census Bureau: March 2008 Construction Spending at $1,123.5 Billion Annual Rate
Spending on private construction was at a seasonally adjusted annual rate of $823.8 billion, 0.5 percent below the revised March estimate of $827.7 billion.
Residential construction was at a seasonally adjusted annual rate of $435.8 billion in April, 2.3 percent below the revised March estimate of $445.8 billion.
Nonresidential construction was at a seasonally adjusted annual rate of $388.0 billion in April, 1.6 percent above the revised March estimate of $381.8 billion.
 Click on graph for larger image.
 The graph shows private residential and nonresidential construction spending since 1993.
Over the last couple of years, as residential spending has declined, nonresidential has been very strong. It appeared earlier this year that the expected slowdown in non-residential spending had arrived.
However, non-residential spending in April set a new nominal record (seasonally adjusted annual rate). This is a little surprising given tighter lending standards and reduced capital spending plans.
Thursday, May 01, 2008
Construction Spending Declines in March
by Calculated Risk on 5/01/2008 09:59:00 AM
Spending declined in March for residential, but increased to for non-residential private construction. The increase in March - to a new record high for non-residential spending - followed three straight months of spending declines.
From the Census Bureau: March 2008 Construction Spending at $1,123.5 Billion Annual Rate
Spending on private construction was at a seasonally adjusted annual rate of $827.4 billion,1.7 percent below the revised February estimate of $842.0 billion.
Residential construction was at a seasonally adjusted annual rate of $445.0 billion in March, 4.6 percent below the revised February estimate of $466.7 billion.
Nonresidential construction was at a seasonally adjusted annual rate of $382.3 billion in March, 1.9 percent above the revised February estimate of $375.3 billion.
 Click on graph for larger image.
 The graph shows private residential and nonresidential construction spending since 1993.
Over the last couple of years, as residential spending has declined, nonresidential has been very strong. It appeared - over the last three months - that the expected slowdown in non-residential spending had arrived.
However, non-residential spending in March set a new nominal record (seasonally adjusted annual rate). This is a little surprising given tighter lending standards and reduced capital spending plans - and perhaps the numbers for March will be revised downwards in the next release.
Saturday, April 05, 2008
Non-Residential Structure Investment in Q1
by Calculated Risk on 4/05/2008 05:19:00 PM
Earlier this week, the Census Bureau reported that private non-residential construction spending had declined for the third straight month. Click on graph for larger image.
The graph shows private residential and nonresidential construction spending since 1993.
Over the last couple of years, as residential spending has declined, nonresidential has been very strong. However, it now appears that non-residential construction spending is declining.
Looking ahead to the Q1 GDP report from the BEA, this implies that real non-residential investment (non-RI) will probably decline in Q1 2008. This follows a number of quarters of positive contributions to GDP from non-RI in structures. Over the last three quarters, non-RI in structures added 0.78% to GDP in Q2, 0.52% in Q3, and 0.41% in Q4 2007. This graph compares the nominal Census Bureau non-residential construction spending with the BEA non-residential investment in structures. Note: Construction spending numbers are not available for March yet.
Although the data sets are different, there is a high correlation between the two series. These are nominal numbers, and in real terms this suggests strongly that non-residential investment declined in Q1.
Tuesday, April 01, 2008
Normalized Construction Spending
by Calculated Risk on 4/01/2008 02:30:00 PM
Earlier this morning, I posted a couple of graphs on construction spending (see Construction Spending Declines in February). The key point was that non-residential construction spending appears to have peaked, and this appears to be the beginning of the non-residential construction slowdown!
There were a couple of requests to see the first chart normalized by population. Yes, sometimes we do requests.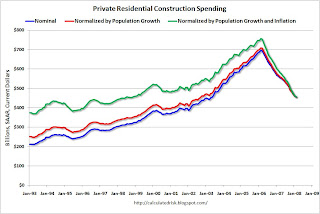 Click on graph for larger image.
The first graph shows the nominal numbers in blue (seasonally adjusted annual rate) from the Census Bureau for private residential construction spending.
The red line is adjusting for population growth based on the monthly population number from the BEA (see line 32).
The green line is adjusting for inflation (using CPI from the BLS). We could use other inflation adjustments too (like the PCE deflator or CPI less shelter).
Clearly the inflation adjustment is more important than the population adjustment.
Another measure of new housing investment is Residential Investment (RI) as a percent of GDP. I expect RI as percent of GDP to bottom towards the end of 2008. (note: this says nothing about existing home prices - those will likely fall for some time).
The second graph shows the same three lines for private non-residential construction spending.
Once again, the inflation adjustment is more significant than the population adjustment.
It appears non-residential construction spending has peaked and will now probably decline throughout 2008.
Construction Spending Declines in February
by Calculated Risk on 4/01/2008 10:00:00 AM
Spending declined in February for both residential and non-residential private construction. This is additional evidence that the non-residential slowdown is here.
From the Census Bureau: February 2008 Construction Spending at $1,121.6 Billion Annual Rate
Spending on private construction was at a seasonally adjusted annual rate of $826.6 billion, 0.5 percent below the revised January estimate of $831.2 billion.
Residential construction was at a seasonally adjusted annual rate of $456.9 billion in February, 0.9 percent below the revised January estimate of $461.1 billion.
Nonresidential construction was at a seasonally adjusted annual rate of $369.7 billion in February, 0.1 percent below the revised January estimate of $370.1 billion.
 Click on graph for larger image.
 The graph shows private residential and nonresidential construction spending since 1993.
Over the last couple of years, as residential spending has declined, nonresidential has been very strong. This is additional evidence - along with the Fed's Loan Officer Survey and other data - that suggests the slowdown in nonresidential spending is here.
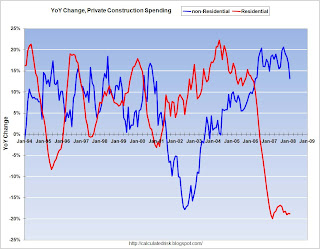 The second graph shows the year-over-year change in residential and non-residential private construction spending.
From a year-over-year perspective, residential is off 19% and non-residential is still up 13%. However non-residential spending has now declined for three straight months, and will probably show a year-over-year decline by mid-summer.
Wednesday, March 19, 2008
Architecture Index Points to Downturn in Commercial Construction
by Calculated Risk on 3/19/2008 09:48:00 AM
From the American Institute of Architects: Architecture Billings Index Points to Major Downturn in Commercial Construction 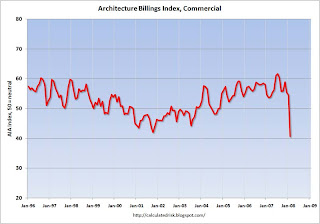 Click on graph for larger image.
Added graph of index (hat tip smalltown guy)
[T]he Architecture Billings Index (ABI) tumbled almost nine points in February. As a leading economic indicator of construction activity, the ABI shows an approximate nine to twelve month lag time between architecture billings and construction spending. The American Institute of Architects (AIA) reported the February ABI rating fell to 41.8, its lowest level since October 2001, and down dramatically from the 50.7 mark in January.Commercial construction has been one of the bright spots for the economy, and this slowdown in construction spending will probably impact construction employment significantly.
...
"This is a clear indication that there could be tougher times ahead for design firms and a noticeable slowdown in commercial construction projects coming online in the foreseeable future," said AIA Chief Economist Kermit Baker, Ph.D., Hon. AIA. "Interestingly enough, we have also had some survey members reporting that their business is in great shape from a billings and demand standpoint. The one bright spot continues to be the institutional sector with continued positive conditions for construction projects such as schools, hospitals and government buildings."
The normal historical pattern is for residential investment (housing) to lead non-residential structure investment (commercial) by 5 to 8 quarters - both up and down. So this commercial construction slump is right on schedule.


