 RSS Feed
 by Calculated Risk on 9/30/2014 08:01:00 PM
Tuesday, September 30, 2014
Wednesday: Vehicle Sales, ISM Manufacturing, ADP Employment, Q3 Office Vacancies, Construction Spending
Wednesday will be busy! First, from the National Restaurant Association: Restaurant Performance Index Registers August Gain
Driven by stronger same-store sales and customer traffic levels and a more optimistic outlook among restaurant operators, the National Restaurant Association’s Restaurant Performance Index (RPI) posted a solid gain in August. The RPI – a monthly composite index that tracks the health of and outlook for the U.S. restaurant industry – stood at 101.9 in August, up 1.0 percent from July and its first gain in three months. In addition, the RPI stood above 100 for the 18th consecutive month, which signifies expansion in the index of key industry indicators.
“The August gain in the RPI was fueled by stronger same-store sales and customer traffic results, aided by continued improving economic conditions,” said Hudson Riehle, senior vice president of the Research and Knowledge Group for the Association. “Looking forward, restaurant operators remain generally optimistic about continued sales growth, while a majority plans to make a capital expenditure in the next six months. However, operators still report food costs and government among top challenges that continue to negatively affect the operating environment.”
emphasis added
 Click on graph for larger image.
The index increased to 101.9 in August, up from 101.0 in July. (above 100 indicates expansion).
Restaurant spending is discretionary, so even though this is "D-list" data, I like to check it every month. This is a solid reading.
Wednesday:
• At 7:00 AM ET, the Mortgage Bankers Association (MBA) will release the results for the mortgage purchase applications index.
• All day, Light vehicle sales for September. The consensus is for light vehicle sales to decrease to 16.8 million SAAR in September from 17.4 million in August (Seasonally Adjusted Annual Rate).
• 8:15 AM, the ADP Employment Report for September. This report is for private payrolls only (no government). The consensus is for 200,000 payroll jobs added in September, down from 205,000 in August.
• Early, Reis Q3 2014 Office Survey of rents and vacancy rates.
• At 10:00 AM, the ISM Manufacturing Index for September. The consensus is for a decrease to 58.0 from 59.0 in August. The ISM manufacturing index indicated expansion in August at 59.0%. The employment index was at 58.1%, and the new orders index was at 66.7%.
• At 10:00 AM, Construction Spending for August. The consensus is for a 0.5% increase in construction spending.
Fannie Mae: Mortgage Serious Delinquency rate below 2% in August, Lowest since October 2008
by Calculated Risk on 9/30/2014 04:11:00 PM
Fannie Mae reported today that the Single-Family Serious Delinquency rate declined slightly in August to 1.99% from 2.00% in July. The serious delinquency rate is down from 2.61% in August 2013, and this is the lowest level since October 2008.
The Fannie Mae serious delinquency rate peaked in February 2010 at 5.59%.
Freddie Mac has not reported for August yet.
Note: These are mortgage loans that are "three monthly payments or more past due or in foreclosure".
 Click on graph for larger image
The Fannie Mae serious delinquency rate has fallen 0.62 percentage points over the last year, and at that pace the serious delinquency rate will be under 1% in 2016 - although the rate of decline has slowed recently.
Note: The "normal" serious delinquency rate is under 1%.
Maybe serious delinquencies will be close to normal in 2016.
House Prices: Real Prices and Price-to-Rent Ratio decline in July
by Calculated Risk on 9/30/2014 01:44:00 PM
I started 2014 expecting a slowdown in year-over-year (YoY) prices as "For Sale" inventory increases, and the price slowdown is very obvious! The Case-Shiller Composite 20 index was up 6.7% YoY in July; the smallest YoY increase since November 2012 (the National index was up 5.6%, also the slowest YoY increase since November 2012.
I expect YoY prices to slow further over the next several months.
It is also important to look at prices in real terms (inflation adjusted). Case-Shiller, CoreLogic and others report nominal house prices. As an example, if a house price was $200,000 in January 2000, the price would be close to $280,000 today adjusted for inflation (40%). That is why the second graph below is important - this shows "real" prices (adjusted for inflation).
Nominal House Prices
 The first graph shows the monthly Case-Shiller National Index SA, the monthly Case-Shiller Composite 20 SA, and the CoreLogic House Price Indexes (through July) in nominal terms as reported.
In nominal terms, the Case-Shiller National index (SA) is back to February 2005 levels, and the Case-Shiller Composite 20 Index (SA) is back to September 2004 levels, and the CoreLogic index (NSA) is back to February 2005.
Real House Prices
 The second graph shows the same three indexes in real terms (adjusted for inflation using CPI less Shelter). Note: some people use other inflation measures to adjust for real prices.
In real terms, the National index is back to July 2002 levels, the Composite 20 index is back to June 2002, and the CoreLogic index back to March 2003.
In real terms, house prices are back to early '00s levels.
Price-to-Rent
In October 2004, Fed economist John Krainer and researcher Chishen Wei wrote a Fed letter on price to rent ratios: House Prices and Fundamental Value. Kainer and Wei presented a price-to-rent ratio using the OFHEO house price index and the Owners' Equivalent Rent (OER) from the BLS.
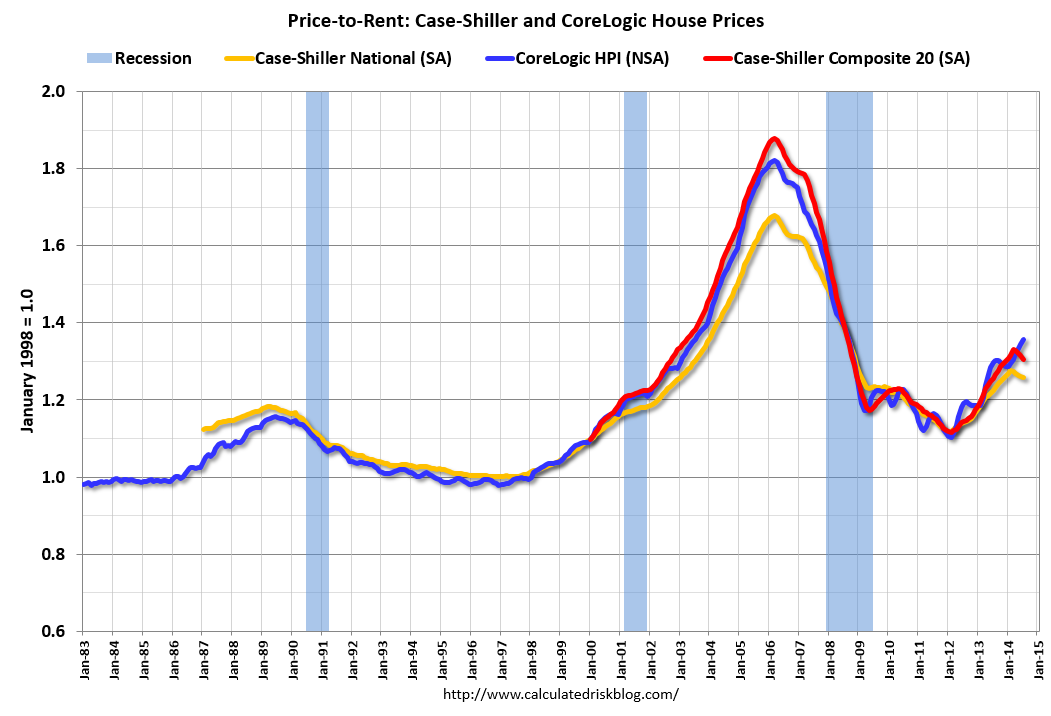 Here is a similar graph using the Case-Shiller National, Composite 20 and CoreLogic House Price Indexes.
This graph shows the price to rent ratio (January 1998 = 1.0).
On a price-to-rent basis, the Case-Shiller National index is back to December 2002 levels, the Composite 20 index is back to September 2002 levels, and the CoreLogic index is back to July 2003.
In real terms, and as a price-to-rent ratio, prices are mostly back to early 2000 levels.
A few comments on the Seasonal Pattern for House Prices
by Calculated Risk on 9/30/2014 11:20:00 AM
A few key points:
1) There is a clear seasonal pattern for house prices.
2) The surge in distressed sales during the housing bust distorted the seasonal pattern.
3) Even though distressed sales are down significantly, the seasonal factor is based on several years of data - and the factor is now overstating the seasonal change.
4) Still the seasonal index is probably a better indicator of actual price movements than the Not Seasonally Adjusted (NSA) index.
For in depth description of these issues, see Trulia chief economist Jed Kolko's article "Let’s Improve, Not Ignore, Seasonal Adjustment of Housing Data"
The housing crisis substantially changed the seasonal pattern of housing activity: relative to conventional home sales, which peak in summer, distressed home sales are more evenly spread throughout the year and sell at a discount. As a result, in years when distressed sales constitute a larger share of overall sales, the seasonal swings in home prices get bigger while the seasonal swings in sales volumes get smaller.Kolko proposed an improved seasonal adjustment. For July, the reported seasonally adjusted month-to-month change for the Composite 20 was -0.5%, but using Kolko's method prices were flat. For the National index, the reported change was +0.2%, and Kolko's method would yield 0.3%.
Sharply changing seasonal patterns create problems for seasonal adjustment methods, which typically estimate seasonal adjustment factors by averaging several years’ worth of observed seasonal patterns. A sharp but ultimately temporary change in the seasonal pattern for housing activity affects seasonal adjustment factors more gradually and for more years than it should. Despite the recent normalizing of the housing market, seasonal adjustment factors are still based, in part, on patterns observed at the height of the foreclosure crisis, causing home price indices to be over-adjusted in some months and under-adjusted in others.
Unfortunately, many have concluded that the solution to the problem of changing seasonal patterns is to downplay or ignore seasonally adjusted housing data until the foreclosure crisis is far enough in the past that it is no longer averaged into seasonal adjustment factors. Standard and Poor’s, publishers of the Case-Shiller home-price index, themselves warned in 2010 that “the unadjusted series is a more reliable indicator and, thus, reports should focus on the year-over-year changes where seasonal shifts are not a factor. Additionally, if monthly changes are considered, the unadjusted series should be used.” Even today, Case-Shiller home-price index press releases continue to emphasize non-seasonally-adjusted (NSA) changes over seasonally adjusted (SA) changes.
But ignoring seasonality during and after the foreclosure crisis is the opposite of what we should be doing. Changing seasonal patterns make seasonal adjustment more important.
Note: I was one of several people to question the change in the seasonal factor (here is a post in 2009) - and this led to S&P Case-Shiller questioning the seasonal factor too (from April 2010).
 Click on graph for larger image.
This graph shows the month-to-month change in the CoreLogic and NSA Case-Shiller National index since 1987 (both through July). The seasonal pattern was smaller back in the '90s and early '00s, and increased since the bubble burst.
It appears we've already seen the strongest month this year (NSA) for both Case-Shiller NSA and CoreLogic. This suggests both indexes will turn negative seasonally (NSA) earlier this year than the previous two years - perhaps in the August reports.
 The second graph shows the seasonal factors for the Case-Shiller National index since 1987. The factors started to change near the peak of the bubble, and really increased during the bust.
 It appears the seasonal factor has started to decrease, and I expect that over the next several years - as the percent of distressed sales declines further and recent history is included in the factors - the seasonal factors will move back towards more normal levels.
However, as Kolko noted, there will be a lag with the seasonal factor since it is based on several years of recent data.
Case-Shiller: National House Price Index increased 5.6% year-over-year in July
by Calculated Risk on 9/30/2014 09:00:00 AM
S&P/Case-Shiller released the monthly Home Price Indices for July ("July" is a 3 month average of May, June and July prices).
This release includes prices for 20 individual cities, and two composite indices (for 10 cities and 20 cities) and the new monthly National index.
Note: Case-Shiller reports Not Seasonally Adjusted (NSA), I use the SA data for the graphs.
From S&P: Broad-Based Easing of Home Price Gains in July According to the S&P/Case-Shiller Home Price Indices
Data through July 2014, released today by S&P Dow Jones Indices for its S&P/Case-Shiller Home Price Indices ... show a significant slowdown in price increases. Nineteen of the 20 cities saw lower annual returns in July. Las Vegas, Miami and San Francisco were the only cities to report double-digit annual gains. Cleveland’s rate remained unchanged at +0.9% for the 12 months ending July 2014.
In July, the 10-City and 20-City Composites increased 0.6% and the National Index 0.5%. Although all cities but one gained on a monthly basis, 17 saw smaller increases in July as compared to last month. Although New York saw a lower gain this month, it was the only city where prices rose over one percent. San Francisco posted its largest decline of 0.4% since February 2012. ...
The S&P/Case-Shiller U.S. National Home Price Index, which covers all nine U.S. census divisions, recorded a 5.6% annual gain in July 2014. The 10- and 20-City Composites posted year-over-year increases of 6.7%.
 Click on graph for larger image.
 The first graph shows the nominal seasonally adjusted Composite 10, Composite 20 and National indices (the Composite 20 was started in January 2000).
The Composite 10 index is off 18.7% from the peak, and down 0.5% in July (SA). The Composite 10 is up 23.1% from the post bubble low set in Jan 2012 (SA).
The Composite 20 index is off 17.9% from the peak, and down 0.5% (SA) in July. The Composite 20 is up 23.7% from the post-bubble low set in Jan 2012 (SA).
The National index is off 11.4% from the peak, and up 0.2% (SA) in July. The National index is up 19.7% from the post-bubble low set in Dec 2012 (SA).
 The second graph shows the Year over year change in all three indices.
The Composite 10 SA is up 6.7% compared to July 2013.
The Composite 20 SA is up 6.7% compared to July 2013.
The National index SA is up 5.6% compared to July 2013.
Prices increased (SA) in 5 of the 20 Case-Shiller cities in July seasonally adjusted. (Prices increased in 19 of the 20 cities NSA) Prices in Las Vegas are off 42.6% from the peak, and prices in Denver and Dallas are at new highs (SA).
This was lower than the consensus forecast for a 7.5% YoY increase for the Composite 20 index, and suggests a further slowdown in price increases. I'll have more on house prices later.
Monday, September 29, 2014
Tuesday: Case-Shiller House Prices, Chicago PMI
by Calculated Risk on 9/29/2014 08:19:00 PM
Tuesday:
• At 9:00 AM ET, S&P/Case-Shiller House Price Index for July. Although this is the June report, it is really a 3 month average of May, June and July. The consensus is for a 7.5% year-over-year increase in the Composite 20 index (NSA) for July. The Zillow forecast is for the Composite 20 to increase 7.0% year-over-year, and for prices to increase 0.1% month-to-month seasonally adjusted.
• At 9:45 AM, the Chicago Purchasing Managers Index for September. The consensus is for a reading of 61.5, down from 64.3 in August.
Note:S&P is now releasing the National house price index monthly, and I expect reporting to shift from the Composite 20 to the National index. The National index was up 6.2% year-over-year in June. Below is a graph with the National and both composite indexes.

Earlier today I posted a table of the year-over-year changes for the Black Knight index (showing year-over-year prices have been slowing for 10 months). Here is a table for Case-Shiller showing year-over-year price changes peaked at the end of 2013, and have been slowing for months:
| Year-over-year Price Changes | |||
|---|---|---|---|
| Month | Composite 10 | Composite 20 | National Index |
| Jan-13 | 7.3% | 8.2% | 7.7% |
| Feb-13 | 8.6% | 9.4% | 8.4% |
| Mar-13 | 10.0% | 10.7% | 8.9% |
| Apr-13 | 11.3% | 11.9% | 9.0% |
| May-13 | 11.6% | 12.0% | 9.0% |
| Jun-13 | 11.7% | 11.9% | 9.2% |
| Jul-13 | 12.1% | 12.3% | 9.7% |
| Aug-13 | 12.7% | 12.8% | 10.2% |
| Sep-13 | 13.2% | 13.2% | 10.7% |
| Oct-13 | 13.6% | 13.6% | 10.9% |
| Nov-13 | 13.9% | 13.7% | 10.8% |
| Dec-13 | 13.6% | 13.4% | 10.8% |
| Jan-14 | 13.5% | 13.2% | 10.5% |
| Feb-14 | 13.2% | 12.9% | 10.2% |
| Mar-14 | 12.6% | 12.4% | 8.9% |
| Apr-14 | 10.8% | 10.8% | 7.9% |
| May-14 | 9.3% | 9.3% | 7.0% |
| Jun-14 | 8.1% | 8.1% | 6.2% |
Black Knight (formerly LPS): House Price Index up 0.2% in July, Up 5.1% year-over-year
by Calculated Risk on 9/29/2014 02:25:00 PM
Note: I follow several house price indexes (Case-Shiller, CoreLogic, Black Knight, Zillow, FHFA, FNC and more). The timing of different house prices indexes can be a little confusing. Black Knight uses the current month closings only (not a three month average like Case-Shiller or a weighted average like CoreLogic), excludes short sales and REOs, and is not seasonally adjusted.
From Black Knight: U.S. Home Prices Up 0.2 Percent for the Month; Up 5.1 Percent Year-Over-Year
Today, the Data and Analytics division of Black Knight Financial Services released its latest Home Price Index (HPI) report, based on July 2014 residential real estate transactions. The Black Knight HPI combines the company’s extensive property and loan-level databases to produce a repeat sales analysis of home prices as of their transaction dates every month for each of more than 18,500 U.S. ZIP codes. The Black Knight HPI represents the price of non-distressed sales by taking into account price discounts for REO and short sales.The year-over-year increases have been getting steadily smaller for the last 10 months - as shown in the table below:
...
- U.S. home prices now just 10.2 percent off 2006 peak
- Year-over-year increases in home appreciation continue to slow
- Seven of 20 largest states register monthly declines in home prices
| Month | YoY House Price Increase |
|---|---|
| Jan-13 | 6.7% |
| Feb-13 | 7.3% |
| Mar-13 | 7.6% |
| Apr-13 | 8.1% |
| May-13 | 7.9% |
| Jun-13 | 8.4% |
| Jul-13 | 8.7% |
| Aug-13 | 9.0% |
| Sep-13 | 9.0% |
| Oct-13 | 8.8% |
| Nov-13 | 8.5% |
| Dec-13 | 8.4% |
| Jan-14 | 8.0% |
| Feb-14 | 7.6% |
| Mar-14 | 7.0% |
| Apr-14 | 6.4% |
| May-14 | 5.9% |
| June-14 | 5.5% |
| July-14 | 5.1% |
The Black Knight HPI is off 10.2% from the peak in June 2006 (not adjusted for inflation).
The press release has data for the 20 largest states, and 40 MSAs.
Black Knight shows prices off 41.7% from the peak in Las Vegas, off 34.6% in Orlando, and 31.8% off from the peak in Riverside-San Bernardino, CA (Inland Empire). Prices are at new highs in Colorado and Texas (Denver, Austin, Dallas, Houston and San Antonio metros). Prices are also at new highs in San Jose, CA and in Nashville, TN.
Note: Case-Shiller for July will be released tomorrow.
Personal Income increased 0.3% in August, Spending increased 0.5%
by Calculated Risk on 9/29/2014 12:31:00 PM
The BEA released the Personal Income and Outlays report for August this morning:
Personal income increased $47.3 billion, or 0.3 percent ... in August, according to the Bureau of Economic Analysis. Personal consumption expenditures (PCE) increased $57.5 billion, or 0.5 percent.The following graph shows real Personal Consumption Expenditures (PCE) through August 2014 (2009 dollars). Note that the y-axis doesn't start at zero to better show the change.
...
Real PCE -- PCE adjusted to remove price changes -- increased 0.5 percent in August, in contrast to a decrease of 0.1 percent in July. ... The price index for PCE decreased less than 0.1 percent in August, in contrast to an increase of 0.1 percent in July. The PCE price index, excluding food and energy, increased 0.1 percent, the same increase as in July. ... The August price index for PCE increased 1.5 percent from August a year ago. The August PCE price index, excluding food and energy, increased 1.5 percent from August a year ago.
 Click on graph for larger image.
The dashed red lines are the quarterly levels for real PCE.
Using the two-month method to estimate Q3 PCE growth, PCE was increasing at a 2.0% annual rate in Q3 2014 (using the mid-month method, PCE was increasing 2.9%). It looks like another quarter of modest PCE growth.
On inflation: The PCE price index increased 1.5 percent year-over-year, and core PCE price index (excluding food and energy) increased 1.5 percent year-over-year in August.
Dallas Fed: "Texas Manufacturing Strengthens" in September
by Calculated Risk on 9/29/2014 11:41:00 AM
From the Dallas Fed: Texas Manufacturing Strengthens
Texas factory activity increased again in September, according to business executives responding to the Texas Manufacturing Outlook Survey. The production index, a key measure of state manufacturing conditions, rose markedly from 6.8 to 17.6, indicating output grew at a faster pace than in August.Here is a graph comparing the regional Fed surveys and the ISM manufacturing index:
Other measures of current manufacturing activity also reflected significantly stronger growth in September. The new orders index climbed 5 points to 7.5. The capacity utilization index surged to 20.2 after dipping to 3.6 in August, with nearly a third of manufacturers noting an increase. The shipments index rebounded to 15.9 after falling to 6.4 last month.
Perceptions of broader business conditions were more optimistic this month. The general business activity index moved up to a reading of 10.8, nearly four points above its nonrecession average of 7. The company outlook index rose from 1.5 to 5.8, due to a larger share of firms noting an improved outlook in September than in August.
Labor market indicators reflected continued employment growth and longer workweeks. The September employment index posted a fourth robust reading, holding fairly steady at 10.6.
emphasis added
 Click on graph for larger image.
The New York and Philly Fed surveys are averaged together (dashed green, through September), and five Fed surveys are averaged (blue, through September) including New York, Philly, Richmond, Dallas and Kansas City. The Institute for Supply Management (ISM) PMI (red) is through August (right axis).
Four of the five regional surveys showed stronger expansion in September than August (the Philly Fed was very strong, but not as strong as August). and it seems likely the ISM index will be solid again this month. The ISM index for September will be released Wednesday, October 1st and the consensus is for a decrease to 58.0 from 59.0 in August.
NAR: Pending Home Sales Index decreased 1.0% in August, down 2.2% year-over-year
by Calculated Risk on 9/29/2014 11:31:00 AM
NOTE: We've had a power outage in my neighborhood. I'll be catching up on some earlier releases.
From the NAR: Pending Home Sales Fall Slightly in August
The Pending Home Sales Index, a forward-looking indicator based on contract signings, fell 1.0 percent to 104.7 in August from 105.8 in July, and is now 2.2 percent below August 2013 (107.1). Despite the slight decline, the index is above 100 – considered an average level of contract activity – for the fourth consecutive month and is at the second-highest level since last August.Note: Contract signings usually lead sales by about 45 to 60 days, so this would usually be for closed sales in September and October.
...
The PHSI in the Northeast slipped 3.0 percent to 86.5 in August, but is still 1.6 percent above a year ago. In the Midwest the index fell 2.1 percent to 102.4 in August, and is 7.6 percent below August 2013.
Pending home sales in the South decreased 1.4 percent to an index of 117.0 in August, unchanged from a year ago. The index in the West rose for the fourth consecutive month (2.6 percent) in August to 102.1, but still remains 2.6 percent below August 2013.
Sunday, September 28, 2014
Monday: Personal Income and Outlays, Pending Home Sales
by Calculated Risk on 9/28/2014 08:21:00 PM
From CNBC: Bill Clinton: I know why US incomes are stagnant
"Median income hasn't gone up for three reasons," Clinton said. "One is the labor markets aren't tight enough, and we haven't raised the minimum wage as we should. And the second reason is we haven't changed the job mix enough, to raise the median income and have more poor people working into it. The combination of jobs has to pay, on average, higher wages."
"Gross domestic product growth doesn't lead to growth in median incomes because company after company takes more of its profits and spends it on dividends, stock buybacks, management increases … and less on sharing it with the employees broadly," said Clinton ...

Here is a graph from the Census report: Income and Poverty in the United States:
"In 2013, real median household income was 8.0 percent lower than in 2007, the year before the most recent recession."My view is slack in the labor market is probably the main cause - and I expect real wages to increase as the unemployment rate falls further.
Monday:
• At 8:30 AM ET, Personal Income and Outlays for August. The consensus is for a 0.3% increase in personal income, and for a 0.4% increase in personal spending. And for the Core PCE price index to be unchanged.
• At 10:00 AM, Pending Home Sales Index for August. The consensus is for a 0.3% decrease in the index.
• At 10:30 AM, Dallas Fed Manufacturing Survey for September. This is the last of the regional manufacturing surveys for September, and so far the results have been solid.
Weekend:
• Schedule for Week of September 28th
• Q3 Review: Ten Economic Questions for 2014
From CNBC: Pre-Market Data and Bloomberg futures: the S&P futures are down 3 and DOW futures are also down 15 (fair value).
Oil prices were mixed over the last week with WTI futures at $93.11 per barrel and Brent at $97.00 per barrel. A year ago, WTI was at $103, and Brent was at $109 - so prices are down 10%+ year-over-year.
Below is a graph from Gasbuddy.com for nationwide gasoline prices. Nationally prices are around $3.34 per gallon (down about 10 cents from a year ago). If you click on "show crude oil prices", the graph displays oil prices for WTI, not Brent; gasoline prices in most of the U.S. are impacted more by Brent prices.
| Orange County Historical Gas Price Charts Provided by GasBuddy.com |
Q3 Review: Ten Economic Questions for 2014
by Calculated Risk on 9/28/2014 11:35:00 AM
At the end of last year, I posted Ten Economic Questions for 2014. I followed up with a brief post on each question. The goal was to provide an overview of what I expected in 2014 (I don't have a crystal ball, but I think it helps to outline what I think will happen - and then try to understand why I was wrong).
By request, here is a Q3 review. I've linked to my posts from the beginning of the year, with a brief excerpt and a few comments:
10) Question #10 for 2014: Downside Risks
Happily, looking forward, it seems the downside risks have diminished significantly. China remains a key risk ... There are always potential geopolitical risks (war with Iran, North Korea, or turmoil in some oil producing country). Right now those risks appear small, although it is always hard to tell. ...There are international risks - China remains a downside risk, Europe (and the Euro) are still a mess, and the situations in the Ukraine and Iraq are serious, but overall it appears that downside risks to the U.S. economy have diminished this year.
When I look around, I see few obvious downside risks for the U.S. economy in 2014. No need to borrow trouble - diminished downside risks are a reason for cheer.
9) Question #9 for 2014: How much will housing inventory increase in 2014?
Right now my guess is active inventory will increase 10% to 15% in 2014 (inventory will decline seasonally in December and January, but I expect to see inventory up 10% to 15% year-over-year toward the end of 2014). This will put active inventory close to 6 months supply this summer. If correct, this will slow house price increases in 2014.The NAR reported inventory was up 4.5% year-over-year in August. Note: I used to follow "Housing Tracker" weekly, but the site had some data problems and they discontinued the series. It looks like a 10% to 15% increase this year might be close - but a little high - based on the NAR reports.
8) Question #8 for 2014: Housing Credit: Will we see easier mortgage lending in 2014?
Bottom line: I expect lending standards to loosen a bit in 2014 from the tight level of the last few years. It will be difficult to measure, but I'll be watching what Mel Watt says, what private lenders say, comments from mortgage brokers, and MEW.We may be seeing a little loosening according to the most recent Fed Senior Loan Officer survey showed some loosening of standards:
A moderate net fraction of domestic banks reported having eased their standards on prime residential mortgages, on net, while most indicated that standards on nontraditional mortgages and home equity lines of credit (HELOCs) were relatively little changed. Banks reported having experienced stronger demand, on balance, for prime residential mortgages for the first time since a year ago...But this is just for prime mortgages.
emphasis added
7) Question #7 for 2014: What will happen with house prices in 2014?
In 2014, inventories will probably remain low, but I expect inventories to continue to increase on a year-over-year basis. This suggests more house price increases in 2014, but probably at a slow pace.We only have Case-Shiller data through June (8.1% year-over-year gain for Composite 20), and it appears price increases are slowing. My prediction still seems OK, but if anything, house prices might slow more than I expected.
As Khater noted, some of the "bounce back" in certain areas is probably over, also suggesting slower price increases going forward. And investor buying appears to have slowed. A positive for the market will probably be a little looser mortgage credit.
All of these factors suggest further prices increases in 2014, but at a slower rate than in 2013. There tends to be some momentum for house prices, and I expect we will see prices up mid-to-high single digits (percentage) in 2014 as measured by Case-Shiller.
6) Question #6 for 2014: How much will Residential Investment increase?
New home sales will still be competing with distressed sales (short sales and foreclosures) in some judicial foreclosure states in 2014. However, unlike last year when I reported that some builders were land constrained (not enough finished lots in the pipeline), land should be less of an issue this year. Even with the foreclosures, I expect another solid year of growth for new home sales.Through August, new home sales were up 2.7% over 2013, and housing starts were only up 8.6% year-over-year. There was a slow start to 2014 mostly due to higher mortgage rates, higher prices and supply constraints in some areas - and a little bit due to the weather. I still think fundamentals support a higher level of starts, and I still expect starts and new home sales to be up this year (but not as much as I initially expected). An optimistic view is that this means more growth next year!
... I expect growth for new home sales and housing starts in the 20% range in 2014 compared to 2013. That would still make 2014 the tenth weakest year on record for housing starts (behind 2008 through 2012 and few other recession lows).
5) Question #5 for 2014: Monetary Policy: Will the Fed end QE3 in 2014?
[E]ven though the Fed is data-dependent, I currently expect the Fed to reduce their asset purchases by $10 billion per month (or so) at each meeting this year and conclude QE3 at the end of the 2014.QE3 will end in October.
4) Question #4 for 2014: Will too much inflation be a concern in 2014?
[C]urrently I think inflation (year-over-year) will increase a little in 2014 as growth picks up, but too much inflation will not be a concern in 2014.Inflation is not a concern this year.
3) Question #3 for 2014: What will the unemployment rate be in December 2014?
My guess is the participation rate will stabilize or only decline slightly in 2014 (less than in 2012 and 2013) ... it appears the unemployment rate will decline to the low-to-mid 6% range by December 2014.The unemployment rate was 6.1% in August and it looks like I was too pessimistic.
2) Question #2 for 2014: How many payroll jobs will be added in 2014?
Both state and local government and construction hiring should improve further in 2014. Federal layoffs will be a negative, but most sectors should be solid. So my forecast is somewhat above the previous three years, and I expect gains of about 200,000 to 225,000 payroll jobs per month in 2014.Through August 2014, the economy has added 1,723,000 jobs, or 215,000 per month. So far this is at the expected pace.
1) Question #1 for 2014: How much will the economy grow in 2014?
I expect PCE to pick up again into the 3% to 4% range, and this will give a boost to GDP. This increase in consumer spending should provide an incentive for business investment. Add in the ongoing housing recovery, some increase in state and local government spending, and 2014 should be the best year of the recovery with GDP growth at or above 3%The first quarter was very disappointing, but economic activity picked up in Q2. However PCE hasn't picked up as much as I expected (only 2.5% in Q2). GDP should be solid in Q3 (and probably in Q4 too), but growth will probably be closer to 2% again this year.
Saturday, September 27, 2014
Schedule for Week of September 28th
by Calculated Risk on 9/27/2014 01:11:00 PM
This will be a busy week for economic data. The key report is the September employment report on Friday.
Other key reports include the August Personal Income and Outlays report on Monday, the July Case-Shiller House Price Index on Tuesday, the ISM manufacturing index and September vehicle sales both on Wednesday, and the August Trade Deficit and September ISM non-manufacturing index on Friday.
Also, Reis is scheduled to release their Q3 surveys of rents and vacancy rates for apartments, offices and malls.
8:30 AM: Personal Income and Outlays for August. The consensus is for a 0.3% increase in personal income, and for a 0.4% increase in personal spending. And for the Core PCE price index to be unchanged.
10:00 AM ET: Pending Home Sales Index for August. The consensus is for a 0.3% decrease in the index.
10:30 AM: Dallas Fed Manufacturing Survey for September.
 9:00 AM: S&P/Case-Shiller House Price Index for July. Although this is the June report, it is really a 3 month average of May, June and July.
NOTE: S&P is now releasing the National house price index monthly, and I expect reporting to shift from the Composite 20 to the National index. The National index was up 6.2% year-over-year in June.
This graph shows the nominal seasonally adjusted Composite 10 and Composite 20 indexes through the June 2014 report (the Composite 20 was started in January 2000).
The consensus is for a 7.5% year-over-year increase in the Composite 20 index (NSA) for July. The Zillow forecast is for the Composite 20 to increase 7.0% year-over-year, and for prices to increase 0.1% month-to-month seasonally adjusted.
9:45 AM: Chicago Purchasing Managers Index for September. The consensus is for a reading of 61.5, down from 64.3 in August.
7:00 AM: The Mortgage Bankers Association (MBA) will release the results for the mortgage purchase applications index.
 All day: Light vehicle sales for September. The consensus is for light vehicle sales to decrease to 16.8 million SAAR in September from 17.4 million in August (Seasonally Adjusted Annual Rate).
This graph shows light vehicle sales since the BEA started keeping data in 1967. The dashed line is the August sales rate.
8:15 AM: The ADP Employment Report for September. This report is for private payrolls only (no government). The consensus is for 200,000 payroll jobs added in September, down from 205,000 in August.
Early: Reis Q3 2014 Office Survey of rents and vacancy rates.
 10:00 AM: ISM Manufacturing Index for September. The consensus is for a decrease to 58.0 from 59.0 in August
Here is a long term graph of the ISM manufacturing index.
The ISM manufacturing index indicated expansion in August at 59.0%. The employment index was at 58.1%, and the new orders index was at 66.7%.
10:00 AM: Construction Spending for August. The consensus is for a 0.5% increase in construction spending.
Early: Reis Q3 2014 Apartment Survey of rents and vacancy rates.
8:30 AM: The initial weekly unemployment claims report will be released. The consensus is for claims to increase to 297 thousand from 293 thousand.
10:00 AM: Manufacturers' Shipments, Inventories and Orders (Factory Orders) for August. The consensus is for a 9.4 decrease in August orders.
8:30 AM: Employment Report for September. The consensus is for an increase of 215,000 non-farm payroll jobs added in September, up from the 142,000 non-farm payroll jobs added in August.
The consensus is for the unemployment rate to be unchanged at 6.1% in September.
 This graph shows the year-over-year change in total non-farm employment since 1968.
In August, the year-over-year change was 2.482 million job, and it generally appears the pace of hiring is increasing.
Right now it looks possible that 2014 will be the best year since 1999 for both total nonfarm and private sector employment growth.
As always, a key will be the change in real wages - and as the unemployment rate falls, wage growth should eventually start to pickup.
Early: Reis Q3 2014 Mall Survey of rents and vacancy rates.
 8:30 AM: Trade Balance report for August from the Census Bureau.
 Imports and exports increased in July.
The consensus is for the U.S. trade deficit to be at $40.7 billion in August from $40.5 billion in July.
10:00 AM: ISM non-Manufacturing Index for September. The consensus is for a reading of 58.8, down from 59.6 in August. Note: Above 50 indicates expansion.
Unofficial Problem Bank list declines to 432 Institutions
by Calculated Risk on 9/27/2014 08:12:00 AM
This is an unofficial list of Problem Banks compiled only from public sources.
Here is the unofficial problem bank list for Sept 26, 2014.
Changes and comments from surferdude808:
The FDIC provided us with an update on its enforcement action activities through August. The update led to five removals and two additions that leave the Unofficial Problem Bank List at 432 institutions with assets of $136.8 billion. A year ago, the list held 690 institutions with assets of $240.5 billion. For the month, the list declined by seven institutions after eight action terminations, two mergers, and three additions. Over the past 28 months, the list has been declining but the drop this month is the smallest over this period.CR Note: The first unofficial problem bank list was published in August 2009 with 389 institutions. The list peaked at 1,002 institutions on June 10, 2011, and is now down to 432.
The FDIC terminated actions against The Bank of Elk River, Elk River, MN ($350 million); Flathead Bank of Bigfork, Montana, Bigfork, MT ($209 million); First State Bank, Wrens, GA ($90 million); Waterman State Bank, Waterman, IL ($42 million); and Marshall County State Bank, Varna, IL ($28 million).
The FDIC issued actions against Independence Bank, East Greenwich, RI ($53 million) and Alamerica Bank, Birmingham, AL ($39 million).
Next week should be light in terms of changes to the list but we will bring an update to the problem bank transition matrix.
Friday, September 26, 2014
Trivial: Bill Gross and Yoga in 2007
by Calculated Risk on 9/26/2014 04:44:00 PM
Several years ago, I occasionally attended the same yoga class as former PIMCO CIO Bill Gross.
In June 2007 (a few months before the recession started), I was waiting for a yoga class and happened to be standing right next to Mr. Gross.
Some random guy walked up to Gross and asked him if it was time to buy distressed bonds (Tanta and I were writing about the coming recession and how many financial institutions would be in trouble or gone).
Gross answered "probably" (time to buy distressed bonds) ... and I almost screamed "No". Then I realized maybe Gross didn't like that guy ... or he didn't like being asked about bonds at a yoga class.
Of course neither of them knew me - but I called Tanta after the class and told her what Gross said. And that was the source of Tanta's joke in this post: BONG HiTS 4 BILL GROSS!
Merrill and Nomura Forecasts for September Non-Farm Payrolls
by Calculated Risk on 9/26/2014 12:05:00 PM
The September employment report will be released next Friday, October 3rd, and the consensus is that 200 thousand payroll jobs were added in September and the unemployment rate was unchanged at 6.1%.
Here are two forecasts:
From Merrill Lynch:
The September employment report is likely to reveal solid job growth of 235,000 with possible upward revisions to prior months. Job growth was disappointing in August, only increasing 142,000, notably below the recent trend. There has been a pattern of upward revisions to the jobs report in August, averaging about 30,000. Our forecast for September combined with likely positive revisions should keep the 3-month moving average for payrolls above 200,000. Among the components, we think government jobs will be up 10,000 while private payrolls expand 225,000. We forecast a strong gain in manufacturing jobs, reflecting healthy improvement in the survey data. Job growth in the retail sector should also be solid after a decline in August. The continued modest improvement in housing construction should continue to support hiring in the sector.From Nomura:
We forecast the unemployment rate to hold steady at 6.1% in September. The labor force participation rate fell in August while household jobs were particularly soft. We do not expect the same for September, although there is a great deal of uncertainty in the monthly forecasts of labor force participation. Average hourly earnings are likely to continue to increase at a trend 0.2% mom rate, which will push the yoy rate up to 2.2%. While this is a pickup from the annual pace in August, it is within the recent range for growth in average hourly earnings.
emphasis added
Payroll growth surprised to the downside in August. However, incoming labor market indicators released since the last jobs report have been generally more favorable for payroll growth. Initial jobless and continuing claims are still near pre-recession levels. In addition, regional manufacturing surveys released thus far in September suggest that manufacturing employment continued to increase.CR Note: In August, a strike at Market Basket in New England negatively impacted the employment report. From BLS Commissioner Erica Groshen:
Based on these labor market readings in September, we forecast a 200k increase in private payrolls, with a 10k increase in government jobs, implying that total nonfarm payrolls will gain 210k. Furthermore, given the solid momentum implied by regional manufacturing surveys, we expect manufacturing employment to grow by 15k. We forecast that average hourly earnings for private employees rose by 0.25% again in September, supporting our forecast of a gradual pick-up in wage inflation. Lastly, based on the improvement in continuing jobless claims, we expect the household survey to show that the unemployment rate fell 0.1pp to 6.0%.
Within retail, employment declined in food and beverage stores (-17,000); this industry was impacted by employment disruptions at a grocery store chain in New England.The disruption ended quickly, and food and beverage employment should bounce back in September.
Final September Consumer Sentiment at 84.6
by Calculated Risk on 9/26/2014 09:55:00 AM

Click on graph for larger image.
The final Reuters / University of Michigan consumer sentiment index for September was at 84.6, unchanged from the preliminary reading of 84.6, and up from 82.5 in August.
This was at the consensus forecast of 84.6. Sentiment has generally been improving following the recession - with plenty of ups and downs - and a big spike down when Congress threatened to "not pay the bills" in 2011.
Q2 GDP Revised Up to 4.6% Annual Rate
by Calculated Risk on 9/26/2014 08:36:00 AM
From the BEA: Gross Domestic Product: Second Quarter 2014 (Third Estimate)
Real gross domestic product -- the output of goods and services produced by labor and property located in the United States -- increased at an annual rate of 4.6 percent in the second quarter of 2014, according to the "third" estimate released by the Bureau of Economic Analysis. In the first quarter, real GDP decreased 2.1 percent.Here is a Comparison of Third and Second Estimates.
The GDP estimate released today is based on more complete source data than were available for the "second" estimate issued last month. In the second estimate, the increase in real GDP was 4.2 percent. With the third estimate for the second quarter, the general picture of economic growth remains the same; increases in nonresidential fixed investment and in exports were larger than previously estimated ...
The increase in real GDP in the second quarter primarily reflected positive contributions from personal consumption expenditures (PCE), exports, private inventory investment, nonresidential fixed investment, state and local government spending, and residential fixed investment. Imports, which are a subtraction in the calculation of GDP, increased.
Real GDP increased 4.6 percent in the second quarter, after decreasing 2.1 percent in the first. This upturn in the percent change in real GDP primarily reflected upturns in exports and in private inventory investment, accelerations in nonresidential fixed investment and in PCE, and upturns in state and local government spending and in residential fixed investment that were partly offset by an acceleration in imports.
Thursday, September 25, 2014
Friday: Revised Q2 GDP, Consumer Sentiment
by Calculated Risk on 9/25/2014 08:55:00 PM
From Merrill Lynch:
We look for 2Q GDP growth to be revised up yet again, likely by another 0.6pp bringing GDP growth to 4.8% qoq saar. Revisions to construction data suggest greater investment in nonresidential structures and slightly more residential construction. We also expect the trade data to be adjusted to show a narrower deficit. Inventories should also be revised lower, perhaps adding 1.3pp to growth versus the prior estimate of 1.7pp. Spending on consumer services will also likely be revised, but there is uncertainty on the magnitude.Friday:
• At 8:30 AM ET, Gross Domestic Product, 2nd quarter 2014 (third estimate). The consensus is that real GDP increased 4.6% annualized in Q2, up from 4.2% in the second estimate.
• At 9:55 AM, Reuter's/University of Michigan's Consumer sentiment index (final for September). The consensus is for a reading of 84.6, unchanged from the preliminary reading of 84.6, and up from the August reading of 82.5.
Lawler on ACS: Sharp Slowdown in Household Growth in 2013 Mainly Attributable to Fewer Folks Living Alone, Big Increases in “Doubling (and more) Up
by Calculated Risk on 9/25/2014 05:52:00 PM
From housing economist Tom Lawler:
ACS: Sharp Slowdown in Household Growth in 2013 Mainly Attributable to Fewer Folks Living Alone, Big Increases in “Doubling (and more) Up”
As I noted last week, ACS for 2013 suggested that there was a sharp slowdown in the growth of the number of households in 2013.
That sharp slowdown was not because of slower population growth, but instead was attributable to a significant jump in the average household size – though that in and of itself is not insightful, since if the growth rate in households is below the growth rate in the household population, ...
While I hope to send out a write up tomorrow, the table below I believe provides some significant insights into the jump in average household size/slowdown in household growth.
The table compares changes in household populations and households for various households/relationships from 2012 to 2013 with annual average changes from 2010 to 2012. Certain really significant differences are in bold type.
| Households and Household Populations by Various Types, ACS | |||||
|---|---|---|---|---|---|
| Annual Change | |||||
| 2013 | 2012 | 2010 | 2012-2013 | 2010-2012 (Average) | |
| Population in Households | 308,099,169 | 305,885,362 | 301,362,366 | 2,213,807 | 2,261,498 |
| Households | 116,291,033 | 115,969,540 | 114,567,419 | 321,493 | 701,061 |
| Average Household Size | 2.649 | 2.638 | 2.630 | 0.012 | 0.004 |
| Population in Family Households | 256,991,641 | 255,379,222 | 252,364,729 | 1,612,419 | 1,507,247 |
| Family Households | 76,680,463 | 76,509,262 | 76,089,045 | 171,201 | 210,109 |
| One-Person Households | 32,242,369 | 32,256,217 | 31,403,342 | -13,848 | 426,438 |
| Population in 2+ Non-Family Households | 18,865,159 | 18,249,923 | 17,594,295 | 615,236 | 327,814 |
| 2+ Non-Family Households | 7,368,201 | 7,204,061 | 7,075,032 | 164,140 | 64,515 |
| Population in Family Households | 256,991,641 | 255,379,222 | 252,364,729 | 1,612,419 | 1,507,247 |
| Householder, Spouse, Child | 226,742,233 | 226,165,010 | 223,905,638 | 577,223 | 1,129,686 |
| Other Relative (including In-Laws) | 22,938,742 | 22,275,332 | 21,610,953 | 663,410 | 332,190 |
| Nonrelatives | 7,310,666 | 6,938,880 | 6,848,138 | 371,786 | 45,371 |
| Population in 2+ Non-Family Households | 18,865,159 | 18,249,923 | 615,236 | 615,236 | 8,817,344 |
| Householder | 7,368,201 | 7,204,061 | 7,075,032 | 164,140 | 64,515 |
| Unmarried Partner | 3,952,380 | 3,909,449 | 3,809,564 | 42,931 | 49,943 |
| Other | 11,447,016 | 11,045,862 | 10,519,263 | 401,154 | 263,300 |
| Average Household Size, 2+ Non-Family Household | 2.560 | 2.533 | 2.487 | 0.027 | 0.023 |
| Roomer or boarder | 1,694,477 | 1,567,268 | 1,595,106 | 127,209 | -13,919 |
| In Family Household | 673,210 | 612,741 | 671,299 | 60,469 | -29,279 |
| In Non-Family Household | 1,021,267 | 954,527 | 923,807 | 66,740 | 15,360 |
| Housemate or Roommate | 5,978,352 | 5,793,412 | 5,587,176 | 184,940 | 103,118 |
| In Family Household | 1,206,366 | 1,189,913 | 1,180,670 | 16,453 | 4,622 |
| In Non-Family Household | 4,771,986 | 4,603,499 | 4,406,506 | 168,487 | 98,497 |
| Other non-partner/non-foster child Non-relative | 3,813,499 | 3,435,254 | 3,129,423 | 378,245 | 152,916 |
| In Family Household | 2,097,727 | 1,895,833 | 1,796,638 | 201,894 | 49,598 |
| In Non-Family Household | 1,715,772 | 1,539,421 | 1,332,785 | 176,351 | 103,318 |
Vehicle Sales Forecasts: Over 16 Million SAAR again in September
by Calculated Risk on 9/25/2014 02:29:00 PM
The automakers will report September vehicle sales on Wednesday, Oct 1st. Sales in August were at 17.45 million on a seasonally adjusted annual rate basis (SAAR), and it appears sales in September will be solidly above 16 million SAAR again.
Note: There were 24 selling days in September this year compared to 23 last year.
Here are a few forecasts:
From J.D. Power: Summer Sizzle Continues as New-Vehicle Sales in August Forecast to Hit Highest Levels of the Year
New-vehicle retail sales in September 2014 are projected to come in at 1.0 million units, a 94,000-unit increase from September 2013 and 6 percent growth on a selling-day adjusted basis (September 2014 has 24 selling days, compared with 23 in September 2013). The retail seasonally adjusted annualized rate (SAAR) in September is expected to be 13.5 million units—which is 1.2 million units more than in September 2013—marking the seventh consecutive month in which the SAAR has exceeded 13 million units. Retail transactions are the most accurate measure of true underlying consumer demand for new vehicles.From Kelley Blue Book: New-Vehicle Sales To Climb 9 Percent In September; Kelley Blue Book Adjusts 2014 Forecast To 16.4 Million
The strong sales pace in September is noteworthy as it follows an exceptionally strong August when retail sales reached 1,378,588.
“Vehicle sales typically fall sharply immediately following the Labor Day holiday before recovering later in the month, but the decline this September has been smaller than in prior years,” said John Humphrey, senior vice president of the global automotive practice at J.D. Power. “While the strong sales pace is an indicator of the health of the industry, it is being complemented by record transaction prices for the month of September.” [Total forecast 16.5 million SAAR]
New-vehicle sales are expected to increase 9.1 percent year-over-year to a total of 1.24 million units, resulting in an estimated 16.4 million seasonally adjusted annual rate (SAAR), according to Kelley Blue Book ... "Following an extraordinarily strong month of sales in August, with the industry above 17 million SAAR for the first time in eight years, Kelley Blue Book expects sales to level out in September," said Alec Gutierrez, senior analyst for Kelley Blue Book. "Sales will remain strong and show healthy year-over-year improvement. Rising incentive spend in recent months has been more than offset by increasing retail transaction prices, signaling continued consumer demand."From TrueCar: TrueCar Forecasts Continued Strong New Vehicle Sales Growth in September; Up 9.7% Compared to Last Year
Seasonally Adjusted Annualized Rate ("SAAR") of 16.4 million new vehicle sales.Another solid month for auto sales, and this should be the best year since 2006.
TrueCar's 2014 Annual Sales Forecast remains at 16.4 million vehicles as well.
Kansas City Fed: Regional Manufacturing "Activity Edged Higher" in September
by Calculated Risk on 9/25/2014 11:10:00 AM
From the Kansas City Fed: Growth in Tenth District Manufacturing Activity Edged Higher
The Federal Reserve Bank of Kansas City released the September Manufacturing Survey today. According to Chad Wilkerson, vice president and economist at the Federal Reserve Bank of Kansas City, the survey revealed that growth in Tenth District manufacturing activity edged higher, and producers’ expectations for future activity maintained their recent solid levels.The last regional Fed manufacturing survey for September will be released on Monday, Sept 29th (the Dallas Fed). All of the regional surveys so far have indicated solid growth in September (three out of four higher than in August), and this suggests another strong reading for the ISM manufacturing survey.
“We saw slightly faster growth this month after a sizable easing in August,” Wilkerson said. “This is despite continued sluggish activity in our important food processing segment, driven in part by higher beef costs this year.”
The month-over-month composite index was 6 in September, slightly higher than 3 in August but lower than 9 in July. The composite index is an average of the production, new orders, employment, supplier delivery time, and raw materials inventory indexes. ... The production index increased from 4 to 12, and the shipment index also grew from a reading of 2 in August to 14. The employment index increased significantly from -4 in the last survey period to 7 in September.
emphasis added
CoreLogic: "Nearly 950,000 homes returned to positive equity in the second quarter of 2014"
by Calculated Risk on 9/25/2014 09:30:00 AM
From CoreLogic: CoreLogic Reports 946,000 Residential Properties Regained $1 Trillion in Total Equity in Q2 2014
CoreLogic ... today released new analysis showing nearly 950,000 homes returned to positive equity in the second quarter of 2014, bringing the total number of mortgaged residential properties with equity in the U.S. to more than 44 million. Nationwide, borrower equity increased year over year by approximately $1 trillion in Q2 2014. The CoreLogic analysis indicates that approximately 5.3 million homes, or 10.7 percent of all residential properties with a mortgage, were still in negative equity as of Q2 2014 compared to 6.3 million homes, or 12.7 percent, for Q1 2014. This compares to a negative equity share of 14.9 percent, or 7.2 million homes, in Q2 2013, representing a year-over-year decrease in the number of homes underwater by almost 2 million (1,962,435), or 4.2 percent.
... Of the 44 million residential properties with positive equity, approximately 9 million, or 19 percent, have less than 20-percent equity (referred to as “under-equitied”) and 1.3 million of those have less than 5 percent (referred to as near-negative equity). Borrowers who are “under-equitied” may have a more difficult time refinancing their existing homes or obtaining new financing to sell and buy another home due to underwriting constraints. Borrowers with near-negative equity are considered at risk of moving into negative equity if home prices fall. In contrast, if home prices rose by as little as 5 percent, an additional 1 million homeowners now in negative equity would regain equity. ...
"The increase in borrower equity of $1 trillion from a year earlier is evidence that things are moving solidly in the right direction,” said Sam Khater, deputy chief economist for CoreLogic. “Borrower equity is important because home equity constitutes borrowers’ largest investment segment and, as a result, is driving forward the rise in wealth for the typical homeowner.”
emphasis added
 Click on graph for larger image.
This graph shows the break down of negative equity by state. Note: Data not available for some states. From CoreLogic:
"Nevada had the highest percentage of mortgaged properties in negative equity at 26.3 percent, followed by Florida (24.3 percent), Arizona (19.0 percent), Illinois (15.4 percent) and Rhode Island (14.8). These top five states combined account for 32.8 percent of negative equity in the United States."
Note: The share of negative equity is still very high in Nevada and Florida, but down significantly from a year ago (Q2 2013) when the negative equity share in Nevada was at 36.4 percent, and at 31.5 percent in Florida.
 The second graph shows the distribution of home equity in Q2 compared to Q1 2014. Close to 4% of residential properties have 25% or more negative equity, down from Q1.
In Q2 2013, there were 7.2 million properties with negative equity - now there are 5.3 million. A significant change.
Weekly Initial Unemployment Claims increase to 293,000
by Calculated Risk on 9/25/2014 08:34:00 AM
The DOL reports:
In the week ending September 20, the advance figure for seasonally adjusted initial claims was 293,000, an increase of 12,000 from the previous week's revised level. The previous week's level was revised up by 1,000 from 280,000 to 281,000. The 4-week moving average was 298,500, a decrease of 1,250 from the previous week's revised average. The previous week's average was revised up by 250 from 299,500 to 299,750.The previous week was revised up to 281,000.
There were no special factors impacting this week's initial claims.
The following graph shows the 4-week moving average of weekly claims since January 1971.
 Click on graph for larger image.
The dashed line on the graph is the current 4-week average. The four-week average of weekly unemployment claims decreased to 298,500.
This was below the consensus forecast of 300,000 and in the normal range for an economic expansion.
Black Knight: Mortgage Delinquencies increased in August
by Calculated Risk on 9/25/2014 07:01:00 AM
According to Black Knight's First Look report for August, the percent of loans delinquent increased in August compared to July - mostly due to an increase in short term delinquencies - and declined by 5% year-over-year.
Note: Usually delinquencies increase seasonally in September, but this might have moved to August this year. The increase was mostly in the 30 day bucket.
Also the percent of loans in the foreclosure process declined further in August and were down 32% over the last year. Foreclosure inventory was at the lowest level since March 2008.
Black Knight reported the U.S. mortgage delinquency rate (loans 30 or more days past due, but not in foreclosure) was 5.90% in August, up from 5.64% in July. The normal rate for delinquencies is around 4.5% to 5%.
The percent of loans in the foreclosure process declined to 1.80% in August from 1.85% in July.
The number of delinquent properties, but not in foreclosure, is down 129,000 properties year-over-year, and the number of properties in the foreclosure process is down 428,000 properties year-over-year.
Black Knight will release the complete mortgage monitor for August in early October.
| Black Knight: Percent Loans Delinquent and in Foreclosure Process | ||||
|---|---|---|---|---|
| Aug 2014 | July 2014 | Aug 2013 | Aug 2012 | |
| Delinquent | 5.90% | 5.64% | 6.20% | 6.87% |
| In Foreclosure | 1.80% | 1.85% | 2.66% | 4.12% |
| Number of properties: | ||||
| Number of properties that are 30 or more, and less than 90 days past due, but not in foreclosure: | 1,852,000 | 1,713,000 | 1,836,000 | 1,910,000 |
| Number of properties that are 90 or more days delinquent, but not in foreclosure: | 1,143,000 | 1,136,000 | 1,288,000 | 1,520,000 |
| Number of properties in foreclosure pre-sale inventory: | 913,000 | 935,000 | 1,341,000 | 2,020,000 |
| Total Properties | 3,908,000 | 3,786,000 | 4,465,000 | 5,450,000 |
Wednesday, September 24, 2014
Thursday: Unemployment Claims, Durable Goods
by Calculated Risk on 9/24/2014 08:15:00 PM
On August Durable Goods from MarketWatch: What goes up must come down: Durable-goods orders set to sink
After flying high in July, orders for U.S. durable goods are likely to take a big dive in August.Thursday:
But don’t pay any heed. The record 22.6% surge in orders in July was propelled mainly by a pile of new contracts for Boeing jets. Those orders tumbled in August and will drag orders into deep negative territory. Economists polled by MarketWatch forecast a 17.3% in new orders.
Strip out airplanes and autos, however, and Wall Street expects orders for durable goods to rise by 1% or more in August.
• At 8:30 AM ET, the initial weekly unemployment claims report will be released. The consensus is for claims to increase to 300 thousand from 280 thousand.
• Also at 8:30 AM, Durable Goods Orders for August from the Census Bureau. The consensus is for a 17.1% decrease in durable goods orders (last month durable goods orders were up 22.6% due to aircraft orders).
• At 11:00 AM, the Kansas City Fed manufacturing survey for September.
Lawler on Homebuilder KB Home and New Home Sales Report
by Calculated Risk on 9/24/2014 04:35:00 PM
From housing economist Tom Lawler: KB Home: Net Orders Up 5% YOY, Orders/Community Flat; Deliveries Down on Delays in Construction Schedules and Customer Mortgage Loan Closings
KB Home reported that net home orders in the quarter ended August 31, 2014 totaled 1,827, up 5.2% from the comparable quarter of 2013. Net orders per community were virtually unchanged from a year ago. The company’s sales cancellation rate, expressed as a % of gross orders, was 31% last quarter, down from 33% in the comparable quarter of 2013. Home deliveries last quarter totaled 1,793, down 1.8% from the comparable quarter of 2013, at an average sales price of $327,000, up 9.3% from a year ago. The company’s order backlog at the end of August was 3,432, up 12.9% from last August.
In its press release the company said that “(d)eliveries in the quarter were tempered by delays in construction schedules and customer mortgage loan closings that resulted in some deliveries being deferred to the fourth quarter.” Delays in customer mortgage loans closings were mainly related to a poorly-executed transition to Home Community Mortgage, LLC, the company’s new mortgage banking joint venture (with Nationstar).
The press release also included commentary on the average selling price.
“The overall average selling price rose 9% to $327,000, up from $299,100 for the same period of 2013. The Company's average selling price has now increased on a year-over-year basis for the last 17 quarters.The company’s CEO said that it had seen “(d)uring the third quarter there was an appreciable uptick in our traffic levels,” and in the conference call officials said that traffic last quarter was up 24% from a year ago.
“The average selling price increased primarily due to the Company's continued positioning of its new home communities in land-constrained submarkets that typically feature higher household incomes, higher median home sales prices and stronger demand for larger home sizes, as well as generally favorable market conditions.
“Average selling prices were higher in all of the Company's homebuilding regions compared to the same quarter of 2013, with increases ranging from 9% in the Central and Southeast regions to 21% in the West Coast region.”
In the previous quarter’s earnings conference call on June 27, KB Home’s CEO raised some eyebrows by saying that the company had seen some “re-emergence” of first-time home buyers, though in response to questions he noted that observed increases in first-time home buyers were in a limited number of areas with strong job growth. He did not talk about re-emerging first-time home buyer demand today.
He did, however, mention that household formations have been increasing, which suggests that his staff either hadn’t looked at or didn’t want to show him the latest CPS and ACS data on households.
And from Tom Lawler on the New Home sales report: Census Estimates that New SF Home Sales Jumped in August; Sales Estimate for the West Surged to Fastest Pace in Almost Seven Years, But Will Probably Be Revised Downward
Census estimated that new SF home sales ran at a seasonally adjusted annual rate of 504,000 in August, up 18.0% from July’s upwardly-revised (to 427,000 from 412,000) pace. (Revisions to May and June sales were de minimis). According to Census estimates, new SF home sales in the West ran at a seasonally adjusted annual rate of 153,000, up 50.0% from July’s pace and up 84.3% from last August’s pace, and the highest seasonally-adjusted sales pace since January 2008. Census’ unadjusted estimate for new SF home sales in the West last month was the highest for an August since 2007.
Based on limited anecdotal and builder reports, the Census estimate for new home sales in the West seem way to high, and a significant downward revision next month would not be surprising.
| New Single-Family Home Sales, Census Estimates | |||||
|---|---|---|---|---|---|
| Total | Northeast | Midwest | South | West | |
| 2012 (Full Year) | 368 | 29 | 47 | 195 | 97 |
| 2013 (Full Year) | 429 | 31 | 61 | 233 | 105 |
| July 2014 (SAAR) | 427 | 24 | 58 | 243 | 102 |
| August 2014 (SAAR) | 504 | 31 | 58 | 262 | 153 |
Comments on New Home Sales
by Calculated Risk on 9/24/2014 01:59:00 PM
The new home sales report for August was above expectations at 504 thousand on a seasonally adjusted annual rate basis (SAAR). This was the highest sales rate since May 2008. However, we need to remember this was just one month of data.
Also sales for the previous three months were revised up a combined 16,000 sales SAAR.
The Census Bureau reported that new home sales this year, through August, were 307,000, Not seasonally adjusted (NSA). That is up 2.7% from 299,000 during the same period of 2013 (NSA). Not much of a gain from last year. Right now it looks like sales will barely be up this year (maybe 3% or so for the year).
Sales were up 33.0% year-over-year in August - however sales declined sharply in Q3 2013 as mortgage rates increased - so this was an easy comparison. The comparison for September will be pretty easy too.
 Click on graph for larger image.
This graph shows new home sales for 2013 and 2014 by month (Seasonally Adjusted Annual Rate).
The comparisons to last year are easy right now, and I expect to see year-over-year growth for the 2nd half of 2014.
And here is another update to the "distressing gap" graph that I first started posting several years ago to show the emerging gap caused by distressed sales. Now I'm looking for the gap to close over the next few years.
 The "distressing gap" graph shows existing home sales (left axis) and new home sales (right axis) through June 2014. This graph starts in 1994, but the relationship has been fairly steady back to the '60s.
Following the housing bubble and bust, the "distressing gap" appeared mostly because of distressed sales.
I expect existing home sales to decline or move sideways (distressed sales will continue to decline and be partially offset by more conventional / equity sales). And I expect this gap to slowly close, mostly from an increase in new home sales.
 Another way to look at this is a ratio of existing to new home sales.
This ratio was fairly stable from 1994 through 2006, and then the flood of distressed sales kept the number of existing home sales elevated and depressed new home sales. (Note: This ratio was fairly stable back to the early '70s, but I only have annual data for the earlier years).
In general the ratio has been trending down, and this ratio will probably continue to trend down over the next several years.
Note: Existing home sales are counted when transactions are closed, and new home sales are counted when contracts are signed. So the timing of sales is different.
AIA: "Architecture Billings Index Exhibits Continued Strength" in August
by Calculated Risk on 9/24/2014 11:25:00 AM
Note: This index is a leading indicator primarily for new Commercial Real Estate (CRE) investment.
From AIA: Architecture Billings Index Exhibits Continued Strength
On the heels of recording its strongest pace of growth since 2007, there continues to be an increasing level of demand for design services signaled in the latest Architecture Billings Index (ABI). As a leading economic indicator of construction activity, the ABI reflects the approximate nine to twelve month lead time between architecture billings and construction spending. The American Institute of Architects (AIA) reported the August ABI score was 53.0, down from a mark of 55.8 in July. This score reflects an increase in design activity (any score above 50 indicates an increase in billings). The new projects inquiry index was 62.6, following a very strong mark of 66.0 the previous month.
The AIA has added a new indicator measuring the trends in new design contracts at architecture firms that can provide a strong signal of the direction of future architecture billings. The score for design contracts in August was 56.9.
“One of the key triggers for accelerating growth at architecture firms is that long-stalled construction projects are starting to come back to life in many areas across the country,” said AIA Chief Economist Kermit Baker, Hon. AIA, PhD. “Long awaited access to credit from lending institutions and an increasing comfort level in the overall economy has helped revitalize the commercial real estate sector in recent months. Additionally, though, a crucial component to a broader industry-wide recovery is the emerging demand for new projects such as education facilities, government buildings and, in some cases, hospitals.”
• Regional averages: Northeast (58.1) , South (55.1), West (52.5), Midwest (51.0) [three month average]
emphasis added
 Click on graph for larger image.
This graph shows the Architecture Billings Index since 1996. The index was at 53.0 in August, down from 55.8 in July. Anything above 50 indicates expansion in demand for architects' services.
Note: This includes commercial and industrial facilities like hotels and office buildings, multi-family residential, as well as schools, hospitals and other institutions.
According to the AIA, there is an "approximate nine to twelve month lag time between architecture billings and construction spending" on non-residential construction. So the readings over the last year suggest an increase in CRE investment this year and in 2015.


