 RSS Feed
 by Calculated Risk on 2/28/2005 07:52:00 PM
Monday, February 28, 2005
New Home Sales as Leading Indicator
The Census Bureau announced today that New Home Sales "in January 2005 were at a seasonally adjusted annual rate of 1,106,000" and that "is 9.2 percent below the revised December rate of 1,218,000 and is 4.2 percent below the January 2004 estimate of 1,155,000". Although this decrease could just be normal monthly fluctuations, the volume of New Home Sales is very important to watch over a several month period. Below are several graphs showing the value of watching New Home Sales as a leading indicator for the economy.
There are three main numbers released each month: New Home Sales (Census Bureau), Construction Permits (Census Bureau) and Existing Home Sales (National Association of Realtors). The most important one to watch is New Home Sales. These are reported in the month that the buyer signs the contract, whereas existing home sales are reported at the close of escrow, usually 30 to 60 after the purchase agreement is signed. Permits are inexpensive and are therefore not predictive since they are not indicative of a builder's commitment to a project.
Here is a graph of the last two years of seasonally adjusted New Home Sales volume (Source: Census Bureau)
NOTE: Click on Graph for larger image.
Source: Census Bureau
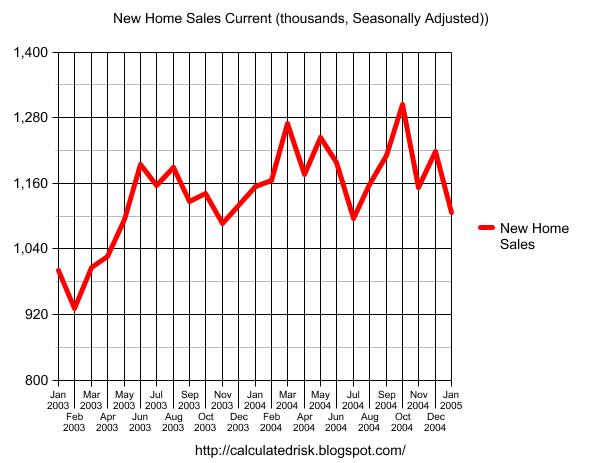
It appears that a peak may have occurred last October, but it could also be another head fake (like last March). A few more months of declining sales would be concerning.
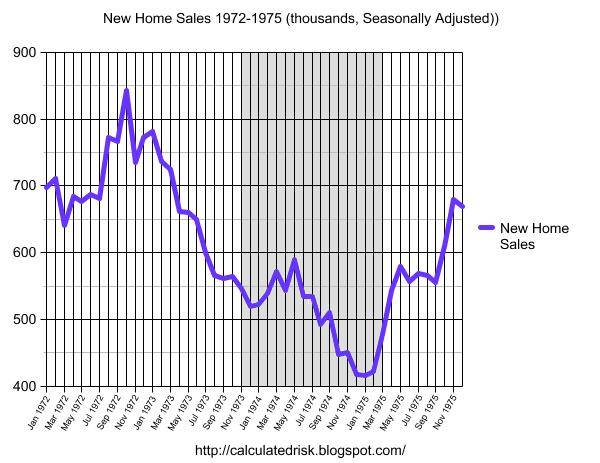
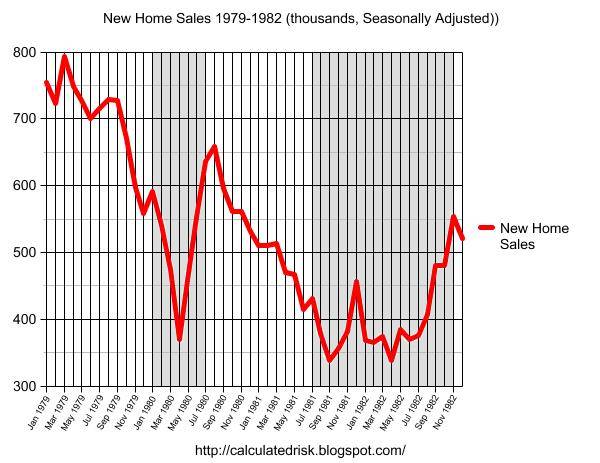
The following are the last three consumer recessions (four counting the '80s double dip). The gray area signifies that the economy was in recession based on the National Bureau of Economic Research's cycle dates. In each of these recessions New Home Sales were falling for 8 to 12 months prior to the onset of the recession. This holds true for the double dip recession of the early '80s; both dips were preceded by significant declines in sales volume.
Source: Census Bureau
Souce: Census Bureau
Source: Census Bureau
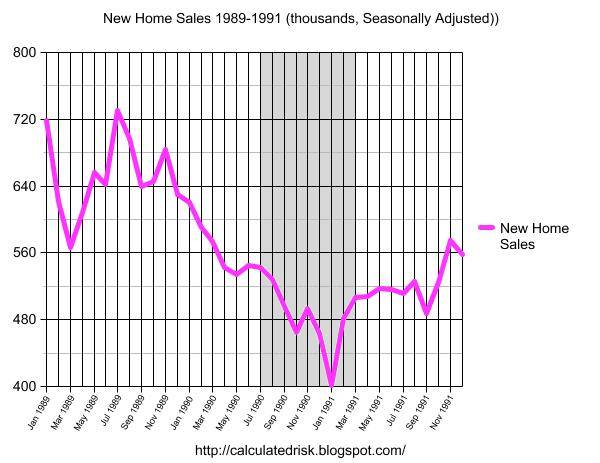
As an aside: Some observers might assume that mortgage interest rates were increasing while housing volumes were declining. This was not true for the '91 recession - mortgage rates were declining from a high of 11% in '89 to under 9% in '91. (See FreddieMac's Mortgage Summary)
If the peak for this housing cycle was in October, then we might see a housing related economic slowdown (even possibly a recession) starting in the 2nd half of 2005. However it also depends on the steepness of the decline. To be concerning volumes would need to drop 20% to 25% or more over a 6 to 8 month period.
We need to see several more months of sales declines, and seasonal volume under one million units, before we start to worry.
Sunday, February 27, 2005
Overview: The National Debt, Budget Deficit and SS Surplus
by Calculated Risk on 2/27/2005 03:21:00 PM
Here is an overview of the National Debt and the Federal Budget deficit. For the purposes of this analysis:
Income to the Federal Government includes all Income taxes, Payroll Taxes, Corporate Taxes, etc, but does NOT include the surplus payments that are credited to the various Trust Funds (like Social Security and military retirement).
Outlays from the Federal Government includes all expenses (including certain off-budget items) but does NOT include payments to the same Trust Funds (as above).
The General Fund Deficit (or Surplus) then equals:
Deficit/Surplus = Income - Outlays.
This is not quite technically correct, but it is very close. Using this approach, the annual increase in the National Debt = General Fund Deficit (Surprise!). For you accountants: Balance!
NOTE: We could account for the Trust Funds the other way: add the surpluses to income and add the credit to the Trust Fund as an outlay. Of course, the Government adds the surpluses to income but doesn't add the Trust Fund credit to outlays. They call this the "unified budget". Under the Unified Budget, the annual deficit does not equal the increase in National Debt. Don't try that in a Public Company or plan on spending time in jail!
Main data sources: U.S. Treasury Historical Monthly Statements, CBO Historical Budget Data, SS Administration: Social Security Trust Funds
Here is a graph of Federal Income vs. Outlay as % of GDP since 1971:
NOTE: Click on graphs for larger image.
Source: U.S. Treasury

In the '80s you can see the impact of the Reagan tax cuts as Federal Government tax receipts dropped significantly. Although Reagan slowed the rate of increase of Government spending, outlays as a % of GDP still were high and the annual deficits grew significantly. In the '90s, under President Clinton, with a combination of higher taxes, lower spending (as a % of GDP) and a healthy economy, the deficit was reduced to close to zero in 2000. It took almost 10 years of fiscal discipline to bring the budget into balance.
After 2000, spending increased and taxes were reduced substantially. Once again this has caused ever larger annual budget deficits. This second graph shows the main two reasons for the lower tax receipts:
Source: U.S. Treasury
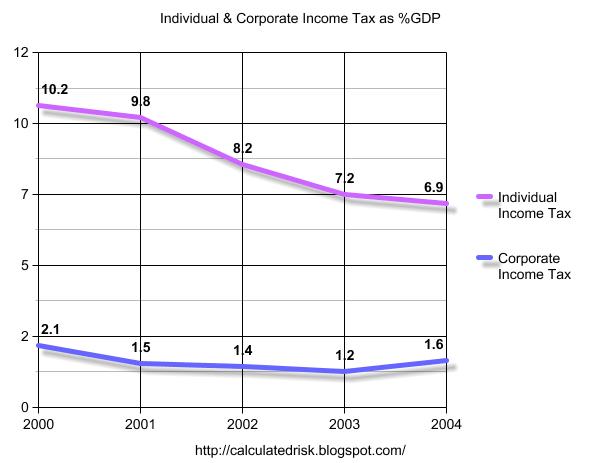
The lower Individual Income taxes are the primary reason for the lower tax receipts. Corporate Income taxes, and a few other sources (mostly other corporate tax breaks), account for most of the remaining fall in Federal income. Record low tax receipts (as a % of GDP) and increased spending has led to budget deficits approaching 6% of GDP.
But what is wrong with including the Trust Fund surplus as part of the Federal Government Income (without a corresponding debit)? First, take a look at just the SS portion of the Trust Fund. The following graph shows the SS payroll tax (income to the SS program) and the SS payments (Outlay).
Source: U.S. Treasury
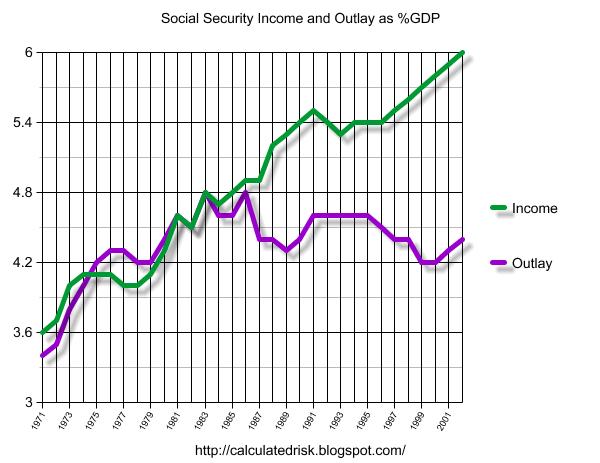
In the '70s and early '80s the SS outlays were increasing faster than SS income for demographic reasons. In fact the SS program ran a deficit for several years (the Purple line higher than the Green line). In 1983, Reagan appointed current Fed Chairman Alan Greenspan to head a commission on SS reform ("The Greenspan Commission"). To satisfy the needs of retirees from 1983 until now, the Greenspan Commission only had to make minor changes. As the graph shows, over the last 20 years outlays have decreased slightly as a % of GDP. However in the next few years outlays will start increasing again. Since the Greenspan Commission was concerned about the retirement of the Baby Boomer generation, they proposed having the Boomers pre-pay a portion of their retirement insurance. That is the increase in the "income" line. The difference between the "income" and "outlays" is the Social Security surplus that is credited to the SS Trust Fund.
If we include the SS overpayment as part of the income for the Federal Government (without including a corresponding debit), then we are using a regressive tax to replace the progressive individual income tax. That substitution doesn't make any economic sense.
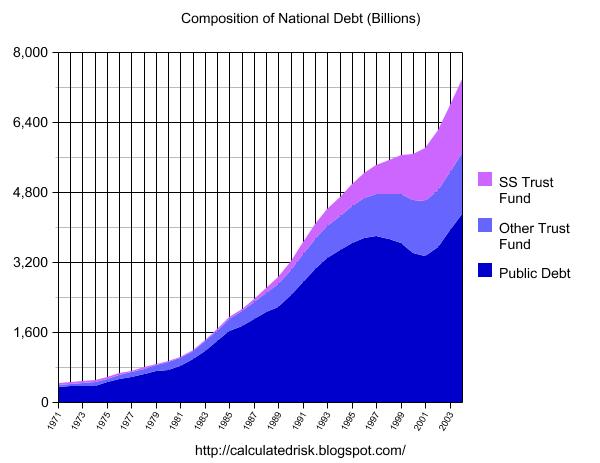
The final graph shows the growth of the SS Trust Fund since 1983. As the program is today, the SS Trust Fund will peak around 2026 and then start declining. It is important to note that SS only accounts for a little over half of the Federal Government Trust Funds. The other portion includes Medicare, Civil Service retirement funds, Military Retirement Funds, Unemployment Insurance, and about 150 other programs.
Source: U.S. Treasury
Hopefully this overview was informative.
Best Regards to All.
Friday, February 25, 2005
Housing: The Good News
by Calculated Risk on 2/25/2005 02:34:00 PM
After a few posts of Gloom and Doom, here are a few positives on the housing market:
From "California January Home Sales" we learn that "Last month was the strongest January in DataQuick's records, which go back to 1988." Also:
"Market stress indicators are still very low: Down payments are stable, speculation buying is moderate, there are no significant shifts in market mix and default rates are low. A recent rise in ARM usage has leveled off. Earlier increases in non owner-occupied purchase activity and flipping activity have leveled off."
And this AP article: "Existing Home Sales Slip in January" was actually positive despite the headline.
"Realtors chief economist David Lereah said even with the small overall decline in sales, demand for homes remained strong. In fact, the supply of homes fell to a record low of 3.7 months, the amount of time it would take to sell all of the homes on the market at the January sales pace."
And finally I'd like to point out the Fed paper by Jonathan McCarthy and Richard W. Peach last year that asked: "Are Home Prices the Next 'Bubble'?" The authors concluded:
"Our analysis of the U.S. housing market in recent years finds
little evidence to support the existence of a national home price bubble. Rather, it appears that home prices have risen in line with increases in personal income and declines in nominal interest rates. Moreover, expectations of rapid price appreciation do not appear to be a major factor behind the strong housing market.
Our observations also suggest that home prices are not likely to plunge in response to deteriorating fundamentals to the extent envisioned by some analysts."
I agree that we are not likely to see a "plunge" in prices; Real Estate prices are sticky and they tend to slowly decline during a bust. Besides I'm more concerned about a slowdown in volume that would impact employment than a "bust". And I disgree about pricing; I think we are seeing a housing bubble.
Thursday, February 24, 2005
More on Housing
by Calculated Risk on 2/24/2005 06:11:00 PM
Here are three interesting stories about credit quality, refinancing and over-supply in the housing market.
From chief economist David Berson, "Data Pointing to Home Sales Slowdown":
"Recent trends in production versus sales are a bit disturbing, and may suggest the excess inventories of unsold homes may have increased in early 2005 from already relatively high levels ... The obvious implication, if these data are indicative of actual trends, is that housing production may be exceeding demand."And this article about Downpayment Aassistance Programs (DAPs): "Plan To Boost Homeownership May Spur Problems, Critics Say" FHA loans are about 10% of all mortgages. They offer a 3% down payment loan - and that is still to0 much. So non-profit organization step in and pay the downpayment ... OK, actually the seller donates the downpayment to the non-profit and the non-profit gives it to the buyer. Amazing. DAPs were essentially non-existent 4 years ago and now make up 25% of FHA loans! See this chart:
Source: IBD

And finally this article related to my previous post "Americans using home equity pile up billions in extra debt". This chart shows Americans using their homes as ATMs:
Source: SacBee

Mortgage Debt and the "Recovery"
by Calculated Risk on 2/24/2005 04:56:00 PM
Is the current recovery built on a "marshland of debt"?
Over the last 4 years, GDP has increased 19%. Meanwhile, mortgage debt (by households) has increased 54% and the National Debt 30%. In dollars, mortgage debt increased $2.6 Trillion and the National Debt $1.7 Trillion. Over that same period, the GDP grew by $1.88 Trillion. So it is easy to imagine that America just "bought" GDP growth by adding debt.
Primarily I've focused on the increases in the National Debt and the astounding increase in mortgage debt over the last 4 years. The following graph shows the increases in the National Debt and Mortgage debt since 1971.
Source: Federal Reserve

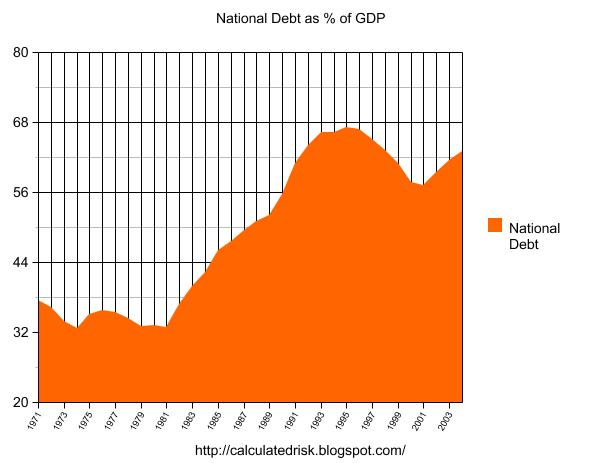
If we normalize the data (by comparing to the GDP), we can really understand what is happening. The following graph shows the enormous increase in National Debt in the '80s and early '90s, followed by a period of declining debt (as a % of GDP). However, starting in 2001, the National Debt started to climb once again. Since the structural General Fund deficit is forecast at almost $650 Billion for fiscal 2005 (ends Sept 30th), so the chart will continue to climb for the foreseeable future.
Source: U.S. Treasury
The following chart shows household mortgage debt as a % of GDP. Although mortgage debt has been increasing for years, the last four years have seen a tremendous increase in debt. Last year alone mortgage debt increased close to $800 Billion - almost 7% of GDP.
Source: Federal Reserve

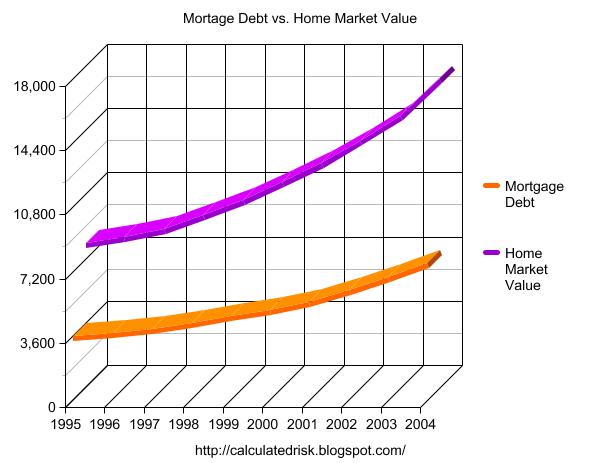
Some obervers have remarked that mortgage debt is still below 50% of household RE assets - and that is an accurate statement. In fact, if you plot mortgage debt vs. household RE assets everything looks reasonable.
Source: Federal Reserve
But lets plot household RE assets as a % of GDP.
Source: Federal Reserve
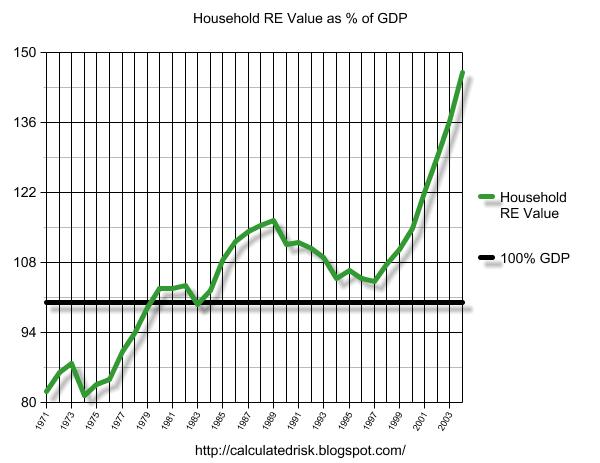
This final graph shows the potential problem. Household assets have really soared in the last few years. Many homeowners have refinanced their homes (or moved and taken cash out), in essense using their homes as an ATM.
It wouldn't take a RE bust to impact the general economy. Just a slowdown in both volume (to impact employment) and in prices (to slow down borrowing) might push the general economy into recession. An actual bust, especially with all of the extensive sub-prime lending, might cause a serious problem.
Wednesday, February 23, 2005
Real Earnings Decline - Again
by Calculated Risk on 2/23/2005 09:48:00 AM
The BLS reports that real weekly earnings declined 0.2% from Dec '04 to Jan '05. For the full year, real weekly earnings decreased by 0.7%.
Average weekly hours declined 0.3% from Dec '04 to Jan '05. This decrease in weekly hours is unusual for a "recovering" economy.
The annual decline in real wages and the decline in hours worked are concerning. One of my points in yesterday's post, A Recovery Built on a Marshland of Debt?, was that "an astounding increase in debt ... has occurred while the median real wage has hardly changed." That trend is continuing.
NOTE: The BLS offers a service that provides News Releases via email. I recommend it.
Tuesday, February 22, 2005
A Recovery Built on a Marshland of Debt?
by Calculated Risk on 2/22/2005 12:12:00 AM
UPDATE:I've received a number of questions about these charts. Thanks to everyone! The first chart is from Barrons (I didn't check the numbers). However the numbers are from this Federal Reserve source: Debt growth, borrowing and debt outstanding tables
Here is what I get (Billions):
Government Debt:
Federal $4317
Trust Fund $3200
State $1670
TOTAL Government $9187
Household Debt:
Mortgage $7261
Consumer Credit $2124
TOTAL Household $9949 (Doesn't add up, must include some small items)
Business Debt: $7671
Financial Sectors: $11,674
TOTAL DEBT: ~$38 Trillion. GDP rate (based on Q4, 2004) is $11,967 Billion.
I agree that some of consumer debt (credit cards) might be double counted. The Financial Sectors debt is also interesting. This is primarily for intermediation so it is probably double counted too.
However, my concern with the burgeoning debt load was primary with the National Debt and the Mortgage debt component of household debt. Both have increased significantly over the last 4 years. These are the components that contribute to the "recovery built on a marshland of debt".
I will try to post some more information on the National Debt (and the structural deficit) and mortgage debt in the next few days.
Best Regards to All! And thanks for the feedback.
Orginal Post:
When discussing Greenspan's Interest Rate Conundrum, I concluded:
"I think the PRIMARY reason for Greenspan's conundrum is that the economy is weaker than it appears. Using GDP growth and unemployment, the US economy is healthy. But the level of debt (both consumer and government), the real estate "boom" that seems based on leverage and loose credit (see Volcker's recent comments), and the poor employment situation (especially the low level of participation) indicate an unhealthy economy. I believe this recovery is being built on a marshland of debt and the bond market is reflecting this weakness."
So here is the story in pictures: First from Barrons (via infoproc):
Source: Barrons

"The accompanying chart, which comes to us by grace of Trey Reik, of Clapboard Hill Partners, a New York-based investment outfit, shows one of the singular effects of Mr. Greenspan's eagerly accommodating reign at the Fed. It tells the story of credit in this fair land from 1916 through the present. Keeping in mind that Mr. G took over in 1987, you can readily see the trajectory picks up altitude abruptly from then until now.
Mr. Reik observes that for the past 100 years, the nation's credit-market debt has averaged between 140% and 160% of gross domestic product. The principal exceptions came in 1929, when the stock market went bananas, and in 1933, during the traumatized period that followed the Great Crash, when four years of the Depression (GDP shrank by an awesome 45%) hoisted the ratio to 287%, prompting a devaluation of the dollar. That was the all-time peak, never approached again until the remarkable rise that began in the 1980s and has resolutely continued ever since, lifting the ratio to today's astonishing 304%."
And the following chart from mwhodges compares the increase in debt vs. National Income. A close examination shows that America's Debt binge accelerated in the early '80s and then subsided only to skyrocket again during the last four years.
Source: http://mwhodges.home.att.net/

Much of this data comes from the Federal Reserve's Flow of Funds report. One of the key reports is the Debt Growth by Sector. As an example, mortage debt has grown from $313 Billion in 1971 to $7.3 Trillion at the end of Q3 2004. Consider this table (all nominal dollars):
Year...Mortgage Debt..% of GDP
1971...$313 Billion....28%
1980...$932 Billion... 33%
1990...$2.5 Trillion...43%
2000...$4.8 Trillion...49%
2004...$7.3 Trillion...64% (end of Q3 2004)
Although mortgage debt, as a percentage of GDP, has been increasing for years, the last four years have seen an astounding increase in debt. This increase has occured while the median real wage has hardly changed. This has lead many obervers to wonder if Americans are using their homes as ATMs. (See Paul Volcker's comments)
Meanwhile, job creation remains sluggish. Here is a graph of employment participation:
Source: Federal Reserve St. Louis

This is very concerning since usually in an economic recovery the participation rate increases. This recovery continues to see sluggish job growth and, as a direct result, restrained aggregate income.
And finally, I have to mention the National Debt. The following chart shows the dramatic increase in the debt over the last four years:
Source: Federal Reserve St. Louis

We do not know when America's rapid increase in debt load will end. We also do not know how it will end. But will do know that the current rate of debt increase is not sustainable. Eventually the debt load will be crushing. 300% of GDP? We are aleady there. 400% of GDP? No one knows, but as economist Herb Stein once observed:
"If something cannot go on forever, it will stop."
Sunday, February 20, 2005
Greenspan's Interest Rate Conundrum
by Calculated Risk on 2/20/2005 06:44:00 PM
Last week, during Greenspan's testimony to Congress, he referred to the behavior of long term rates as a "conundrum". Greenspan's testimony in italics:
"In this environment, long-term interest rates have trended lower in recent months even as the Federal Reserve has raised the level of the target federal funds rate by 150 basis points. This development contrasts with most experience, which suggests that, other things being equal, increasing short-term interest rates are normally accompanied by a rise in longer-term yields. The simple mathematics of the yield curve governs the relationship between short- and long-term interest rates. Ten-year yields, for example, can be thought of as an average of ten consecutive one-year forward rates. A rise in the first-year forward rate, which correlates closely with the federal funds rate, would increase the yield on ten-year U.S. Treasury notes even if the more-distant forward rates remain unchanged. Historically, though, even these distant forward rates have tended to rise in association with monetary policy tightening."
Mr. Greenspan is referring to the expectations theory of interest rates were long rates are the geometric average of expected future short rates plus a risk premium that would usually increase with duration of the instrument. This theory assumes that arbitrage between instruments of different durations will set the price.
It is also possible for the risk premium to change over time. As an example, changes in the perceptions of the Fed's credibility on fighting inflation will change the risk premium. For a discussion on the declining risk premium (possibly due to improving Fed credibility), see Dr. Altig's Macroblog.
"In the current episode, however, the more-distant forward rates declined at the same time that short-term rates were rising. Indeed, the tenth-year tranche, which yielded 6-1/2 percent last June, is now at about 5-1/4 percent. During the same period, comparable real forward rates derived from quotes on Treasury inflation-indexed debt fell significantly as well, suggesting that only a portion of the decline in nominal forward rates in distant tranches is attributable to a drop in long-term inflation expectations.
Some analysts have worried that the dip in forward real interest rates since last June may indicate that market participants have marked down their view of economic growth going forward, perhaps because of the rise in oil prices. But this interpretation does not mesh seamlessly with the rise in stock prices and the narrowing of credit spreads observed over the same interval."
Under the expectations theory, a decline in long rates with rising short rates would mean either: 1) the market believes the increase in the short rate is temporary (not really applicable now) or 2) the market believes that economic growth will be slower in the future. Greenspan rejects these explanations and offers the recent rise in the stock market and narrowing of credit spreads as evidence that the economy is healthy. Perhaps the most recent runup in the stock market is just more "irrational exuberance"?
Others have emphasized the subdued overall business demand for credit in the United States and the apparent eagerness of lenders, including foreign investors, to provide financing. In particular, heavy purchases of longer-term Treasury securities by foreign central banks have often been cited as a factor boosting bond prices and pulling down longer-term yields. Thirty-year fixed-rate mortgage rates have dropped to a level only a little higher than the record lows touched in 2003 and, as a consequence, the estimated average duration of outstanding mortgage-backed securities has shortened appreciably over recent months. Attempts by mortgage investors to offset this decline in duration by purchasing longer-term securities may be yet another contributor to the recent downward pressure on longer-term yields.
For an excellent analysis concerning Foreign Central Bank purchases of U.S. instruments, see Roubini and Setser's "Will the Bretton Woods 2 Regime Unravel Soon? The Risk of Hard Landing in 2005-2006." Roubini and Setser suggested that the impact on the interest rates of foreign CBs purchases could be as much as 200 bps. (see here and here) However this is a side point in their excellent analysis of the Current Account Deficit.
Please see: Do Foreign CBs distort the Treasury Yield? Greenspan discounts the impact of these purchases:
"But we should be careful in endeavoring to account for the decline in long-term interest rates by adverting to technical factors in the United States alone because yields and risk spreads have narrowed globally. The German ten-year Bund rate, for example, has declined from 4-1/4 percent last June to current levels of 3-1/2 percent. And spreads of yields on bonds issued by emerging-market nations over U.S. Treasury yields have declined to very low levels.
There is little doubt that, with the breakup of the Soviet Union and the integration of China and India into the global trading market, more of the world's productive capacity is being tapped to satisfy global demands for goods and services. Concurrently, greater integration of financial markets has meant that a larger share of the world's pool of savings is being deployed in cross-border financing of investment. The favorable inflation performance across a broad range of countries resulting from enlarged global goods, services and financial capacity has doubtless contributed to expectations of lower inflation in the years ahead and lower inflation risk premiums. But none of this is new and hence it is difficult to attribute the long-term interest rate declines of the last nine months to glacially increasing globalization. For the moment, the broadly unanticipated behavior of world bond markets remains a conundrum. Bond price movements may be a short-term aberration, but it will be some time before we are able to better judge the forces underlying recent experience."
My view: It is probably true that the risk premium has declined and contributed to lower long rates. And Foreign CB purchases might be having an impact on longer rates. But I think the PRIMARY reason for Greenspan's conundrum is that the economy is weaker than it appears. Using GDP growth and unemployment, the US economy is healthy. But the level of debt (both consumer and government), the real estate "boom" that seems based on leverage and loose credit (see Volcker's recent comments), and the poor employment situation (especially the low level of participation) indicate an unhealthy economy. I believe this recovery is being built on a marshland of debt and the bond market is reflecting this weakness.
Is "Consumer Confidence" Useless?
by Calculated Risk on 2/20/2005 03:19:00 PM
A new study by Dr. Dean Croushore of University of Richmond "says they're essentially useless for forecasting Americans' spending patterns."
Here is the February AP-Ipsos consumer confidence index.
Here is a PDF version of the report "DO CONSUMER CONFIDENCE INDEXES HELP FORECAST CONSUMER SPENDING IN REAL TIME?".
Dr. Dean Croushore said:
"... consumer confidence just reflects the past. You lose your job, your confidence falls. There's not really anything new there. What we really want are indicators that look forward."However, the response from the leading Consumer confidence Indexes:
Richard T. Curtin, director of the Michigan surveys, said it's more telling to look at consumers' responses to his survey's specific questions rather than the index itself. That's because over the decades, Americans' spending decisions have come to be based on an increasing number of factors, including expectations about interest rates and asset values, he said.
"So the details are much more important than the overall number," Curtin said
Robert H. McGuckin, economic research director for the Conference Board, said in an e-mail he hasn't had the chance to closely examine Croushore's study. But he said the group's researchers have used similar real-time forecasting tests in evaluating their Leading Economic Index, which includes consumer expectations.
"We find the (Leading Economic Index) provides timely and accurate ex-ante information for predicting not only the business cycle turning points but also monthly changes in the economy," he wrote.
McGuckin added that the group's consumer confidence survey "is not designed narrowly to focus just on forecasts of consumer expenditures."
Wednesday, February 16, 2005
Volcker: Circumstances "dangerous and intractable"
by Calculated Risk on 2/16/2005 11:26:00 PM
Former Fed chief Paul Volcker spoke last week at the second annual summit of the Stanford Institute for Economic Policy Research. In his keynote speech he warned that the nation is facing 'huge imbalances and risks'.
Here is a video of the speech.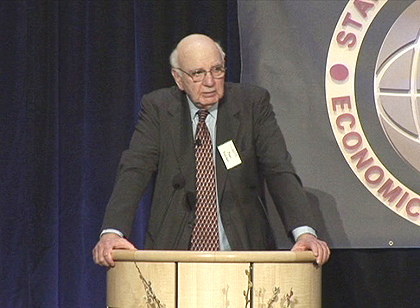
Paul Volcker, Stanford, Feb 11, 2005 
A few selected excerpts:
"Altogether, the circumstances seem as dangerous and intractable as I can remember."
"Boomers are spending like there is no tomorrow."
"Homeownership has become a vehicle for borrowing and leveraging as much as a source of financial security."
"I come now to the heart of the problem, as a Nation we are consuming and investing, that is spending, about 6% more than we are producing. What holds it all together? - High consumption - high leverage - government deficits - What holds it all together is a really massive and growing flow of capital from abroad. A flow of capital that today runs to more than $2 Billion per day."
"What I'm really talking about boils down to the oldest lesson of financial policy in Central Banking: A strong sense of monetary and fiscal discipline."
The Impact of a RE Slowdown on Employment
by Calculated Risk on 2/16/2005 01:35:00 AM
Earlier I posted a bullish analysis on housing from the NAR and a cautionary report from the FDIC that expressed concerns about credit quality and excessive leverage for many homebuyers.
NAR President Al Mansell claims that "the population is growing faster than the supply of homes". However this is somewhat contradicted (in the short term) by the Housing Vacancies and Homeownership data from the Census Bureau. This data shows that an extra 800K rental units are available nationwide (above the normal percentage for the last 20 years). This increase has happened during the last 3 years. For other reasons, another 700K housing units are sitting vacant above the normal percentages. These are included in "bought but not occupied yet" and "other vacant" categories. Could this be speculation? Regardless of the reason, this suggests overcapacity in the housing market in the short term.
What about jobs?
If we have a RE slowdown, it will probably have a significant impact on employment and aggregate income. From the following chart, we see that we have added 200K jobs in the mortgage industry alone in under 4 years. The mean salary (according to the BLS in 2001) was $45,380 for the mortgage industry. If we lost those jobs (returning to pre-2001 employment levels), we would lose $8 to $9 billion in aggregate annual income ... just from layoffs in the mortgage industry.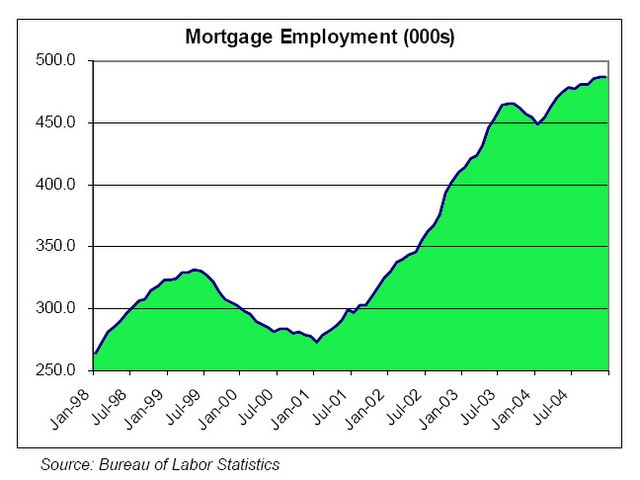
Thanks to ild and Elroy for the chart.
For RE agents, California alone has added 99,281 licensed RE agents since July 2000. Many of these agents only work part-time, but that is still a substantial loss of income if RE volumes drop 30 to 40% - like a typical RE slowdown.
And then there is the residential construction industry. Many of these jobs are reasonably high paying - and we have added over 300k construction jobs since 2000. And that figure doesn't include the impact of illegal immigrants working in the construction trade. When these immigrants lose their jobs, their lost income will also ripple through the economy.
We could add other potential lost jobs to this list: like service jobs in escrow, title, home inspection, and many other jobs on the periphery of RE. These are just the jobs directly impacted by a slowdown.
There are also the secondary effects (the vendors for the above businesses) and the tertiary impacts (restaurants, retailers, etc.) that suffer as aggregate income falls.
The bottomline: a significant RE slowdown would have a serious impact on employment and the economy.
Tuesday, February 15, 2005
Housing: Don't Worry, Be Happy
by Calculated Risk on 2/15/2005 05:53:00 PM
Yesterday I posted a cautionary report from the FDIC. Today, we have the National Association of Realtors with a bullish report on housing. The NAR reports that Record No. of Metros Show Double-Digit Home-Price Gains.
David Lereah, NAR's chief economist, says it's a simple matter of supply and demand. "We ended 2004 with a record low supply of homes on the market," he says. "With more buyers than sellers nationally, what we're seeing is a natural pressure on home prices as buyers compete to bid on available properties. Fortunately, the historically low cost of debt service on a home purchase means that we have a comfortable buffer in most of the country because the typical family can afford to buy a home well above the median price."
And Lereah went on to say that analysts looking for bad news will be disappointed.
"In the handful of areas with price declines, none had previously experienced rapid price growth," he says. "In fact, they were all lower-cost areas experiencing one or both of the conditions necessary for temporary price softness—local economic weakness, mainly in jobs, or a large supply of homes available in the local market."
And more bullish comments from NAR President Al Mansell:
"Although temporary price declines are always possible under the right conditions, people who were scared off by faulty predictions have missed out on the strongest housing market in U.S. history," he says. "Considering rents on comparable properties generally are higher than mortgage payments, and housing returns generally are multiples of a downpayment, a little perspective may help. The population is growing faster than the supply of homes, the cost of construction rarely declines and the long-term prospects are positive—one of the largest generations in U.S. history, who believe housing is a good investment, is just entering the years in which people typically buy their first home."
Don't Worry, Be Happy.
Monday, February 14, 2005
U.S. Home Prices: Does Bust Always Follow Boom?
by Calculated Risk on 2/14/2005 11:26:00 PM
The FDIC has released a new report titled "U.S. Home Prices: Does Bust Always Follow Boom?" Their analysis is based on the OFHEO House Price Index database.
Their conclusions:
1) Most booms did NOT lead to a bust.
2) Most booms ended with "stagnation in home prices".
"In these cases, nominal home prices rose by an average of 2 percent per year during the five years after the boom ended. The equivalent figure for real home prices was a modest 2 percent per year decline."
3) Busts followed booms when a local severe economic shock occurred.
"... severe economic shocks—often including a net outflow of population—appear to be a key factor in pushing nominal home prices sharply lower. Home price declines do not occur simply because home prices have boomed, and they do not occur independently of local economic conditions."
4) However, there are additional reasons for concern with the current situation:
a) Boom is almost Nationwide:
"Our count of 33 boom markets in 2003 is the highest witnessed at one time during the past 25 years—1988 ranks second, with 24 booms. Moreover, the 2003 boom markets account for roughly 40 percent of the nation's population base, contributing to the impression that this is a nationwide phenomenon."
b) Financing is in uncharted territory:
"A major financial development in the 1990s was the emergence and rapid growth of subprime mortgage lending. Subprime mortgage loan originations surged by a whopping 25 percent per year between 1994 and 2003, resulting in a nearly ten-fold increase in the volume of these loans in just nine years.12 Subprime mortgages currently account for just over 10 percent of all mortgage debt outstanding."
c) And more and more buyers are taking on high debt to equity ratio:
"Home buyers are also increasingly availing themselves of higher-leverage mortgage products. In 2003, loans exceeding 80 percent of the home purchase price accounted for 30 percent of all purchase mortgages underwritten. In a few cities, this share exceeded 50 percent.14 In addition, more borrowers are taking on second mortgages at closing. One method of doing so involves "piggyback" loans, which combine a first mortgage, usually for 80 percent of the value of the home, with a "piggyback" second mortgage amounting to 10 to 15 percent or more of the value of the home. The effect of this structure is to raise the total loan amount to a level very near the value of the home, which may make borrowers more likely to default in the event of a housing market downturn. An increased incidence of default and foreclosure could, in turn, contribute to downward pressure on home prices as distressed properties are liquidated by lenders."
I am not optimistic that we can avoid a bust ...
Do Foreign CBs distort the Treasury Yield?
by Calculated Risk on 2/14/2005 11:49:00 AM
Several economists have recently suggested that Foreign Central Bank purchases of treasuries have distorted bond yields by anywhere from 40 to 200 bps. As an example, from the Feb 3rd The Economist:
"By some estimates, Asian purchases of American bonds have reduced yields by between half and one percentage-point."
And from the Federal Reserve's Bernanke and Reinhart writing with Macroeconomic Advisers' Brian Sack "Monetary policy alternatives at the zero bound: an empirical assessment":
"The results ... indicate that both five-year and ten-year Treasury yields remained below the model’s predictions by an average of 50 to 100 basis points over this period. This suggests that some force not captured in the model was exerting downward pressure on yields over this period. But while the evidence is suggestive of effe[c]ts from MOF purchases, it is not conclusive."
And Roubini and Setser in "Will the Bretton Woods 2 Regime Unravel Soon? The Risk of Hard Landing in 2005-2006" reviewed recent estimates of the impact of Foreign CB purchases:
"Goldman Sachs (2004) has presented an analysis suggesting that central banks intervention is narrowing Treasury yields by only 40bps; Sack (2004) provides a similar estimate. Truman (2005) notes that sustained intervention from central banks is similar to a sustained reduction in the fiscal deficit: his ballpark estimate suggests a $300 billion in central bank intervention might have a 75 bp impact. Research from Federal Reserve suggests a 50 to 100 bps impact (see Bernanke, Reinhart and Sack (2004)); PIMCO’s Bill Gross puts it at closer to 100 bps, and Morgan Stanley’s Stephen Roach puts it at between 100 and 150 bps."
Roubini and Setser concluded that these estimates are too low:
"While estimating the effect of central banks intervention on US long rates is difficult, there is good reason to suspect that the impact of central bank purchases much larger than the 40bps static effect estimated in some studies. ... Consequently, the 40bp Goldman estimate seriously understates the effects of the Asian intervention on the market. Considering the size of recent central bank purchases, the indirect impact of central bank intervention on private demand for Treasuries, the interaction between central bank reserve accumulation and Treasury debt management policy and the effects of Asian reserve accumulation on inflation and growth (general equilibrium effects), we would bet the overall impact would be closer to 200bps." emphasis Added
Over the weekend, the IHT had an article (by Daniel Altman) titled: "U.S. debt: Watch out for the domino effect". Although the article didn't mention lowering of American bond yields by foreign CBs, it touched on the impacts of Foreign CBs diversifying away from dollar denominated assets.
With regards to foreign CBs distorting the treasury yield, I remain skeptical but intrigued. If Foreign CBs are depressing American bond yields, this has already boosted any RE bubble by lowering borrowing costs for homebuyers. Any unwinding of these positions could potentially lead to a slowdown in the US economy with rising interest rates. That would not be a good combination.
Friday, February 11, 2005
Consumer Confidence Plummets in February
by Calculated Risk on 2/11/2005 08:34:00 PM
The AP-Ipsos consumer confidence index sank to 79.1 in February, down sharply from 92.5 in January. February's showing was the worst since October 2003.
Consumer Confidence
"The AP-Ipsos confidence index is benchmarked to a 100 reading on January 2002, when Ipsos started the gauge.
A measure of consumers' attitudes about economic expectations over the next six months, including conditions in areas where people live or work and their own financial positions, showed a steep decline.
That "expectations" gauge fell to 58.6 in February, compared with 79.6 in January and 89.2 a year ago."
Rasmussen conducts a daily poll of consumer confidence. The Rasmussen Consumer Index dropped two points on Friday to 115.5. Surprisingly, thirty-five percent (35%) of Americans say the U. S. is still in a recession.
Thursday, February 10, 2005
Housing: Quotes of the Day
by Calculated Risk on 2/10/2005 04:51:00 PM
Here are a couple of quotes from this article:
"There is going to be a problem in the housing market, and there is going to be a recession."
James Davis, the chairman of the Bank of Alameda.
"If you are in a region where job growth is not a problem, then you really don't have anything to worry about as far as the price of your house going down," That seems unlikely in his area, he added, because "people who live in Marin are not the type of people who get laid off first."
Rob Bensch, a house and apartment investor from Novato.
Housing Update
by Calculated Risk on 2/10/2005 01:07:00 PM
Two recent updates in California show the housing market may be starting to slow. I believe housing (especially New Home Sales) will be the leading indicator of a global economic slowdown.
Morgan Stanley's Stephen Roach has been using the phrase "asset economy" to describe the current situation. If housing slows down, this could take out the main pillar of the asset economy.
Home prices dipped in the OC (Orange County, CA) last month:
"Market-watcher DataQuick said Thursday that the median sales price for all residences in January was $534,000. That's off December's record high of $551,000 but still up 18.7 percent from January 2004.
Total sales last month were 2,903, down 4.9 percent from a year ago. Especially hard-hit were builders, who sold just 197 newly constructed homes -- a 24 percent drop from a year ago. It was the slowest January for builders since 1993."
And in Northern California:
"... real estate market has lost much of its steam in terms of volume. Decreasing volume is 'normal' behavior for the Santa Clara County real estate market for the end of the year. It is the degree of the decrease that remains a concern. Volume went from 154% of the 10-year average to 132% in June. Then went from 132% to 114% from mid-November to mid-December; and finally from 114% to 98% starting January 12, 2005. SCC only experienced 44% of the offers seen during the peak summer. This is a lower percentage than any of the 10-years that we have data for."
Wednesday, February 09, 2005
What Does Price Indexing mean for Social Security Benefits?
by Calculated Risk on 2/09/2005 02:32:00 PM
A report from The Center for Retirement Research at Boston College analyzes the impact of the Bush Administration's proposed Price Indexing on Social Security. Their conclusion:
"The conclusion that emerges from this review of price indexing is that it creates a potentially unstable system. Price indexing does more than simply cut benefits below the amounts scheduled under current law, it cuts them more each year. Eventually benefits will become trivial relative to workers’ earnings. If the goal is to restore balance to the Social Security program by cutting benefits, an across-the-board cut of 20 percent for those under age 55 or an increase in the normal retirement age to 70 would achieve the same result over the next 75 years without putting the system on a downward trajectory."
Tuesday, February 08, 2005
The Economist on the Budget: Holding the line?
by Calculated Risk on 2/08/2005 04:15:00 PM
Add the Economist's take: Holding the line? to Macroblog's summary of budget commentary.
Excerpts:
"George Bush has submitted a budget that is tough on discretionary spending for this coming year. But Iraq and Afghanistan, as well as proposed changes to Social Security and the tax code, still leave black clouds on the fiscal horizon"
And more:
"But Mr Bush’s new-found fiscal conservatism is patchy. His current deficits are primarily the result of a collapse in tax revenues, down from 20.8% of GDP in 2000 to 16.8% this year, yet he intends to make his tax cuts permanent. Security spending is also largely exempt from his tight-fistedness. Next year, defence spending will grow by 4.8% in nominal terms, to $419 billion; homeland-security outlays will go up by 1.2%, to $29 billion. And the budget does not include likely “supplementals” for ongoing military operations in Iraq and Afghanistan. Congress has already approved one such supplemental, of $25 billion for fiscal 2005, and is preparing to consider another $80-billion request from Mr Bush.
Indeed, none of these numbers is safe from Congress. Budget hawks fear so-called “Washington Monument proposals”: proposals to cut or close emotive programmes or landmarks, which the public (and their legislators) will never allow."
And on the AMT:
"Other fiscal pain has also been put off, but cannot be avoided forever. One headache is the Alternative Minimum Tax (AMT)."
The major media is looking deeper than the Bush Administration inspired headlines of “Deep Spending Cuts” and “Sweeping Budget Cuts”. That is a start.
Saturday, February 05, 2005
A Worrisome Juxtaposition?
by Calculated Risk on 2/05/2005 07:16:00 PM
WaPo 2/5/2005: As SE Asian Farms Boom, Stage Set for a Pandemic
NYTimes 2/5/2005: Bush Budget Calls for Cuts in Health Services
"... Mr. Bush would cut spending for several programs that deal with epidemics, chronic diseases and obesity. His plan would also cut the budget of the Centers for Disease Control and Prevention by 9 percent ..."
Seems like bad timing to me.
Friday, February 04, 2005
FT: BoJ's bill auction fails first time in two years
by Calculated Risk on 2/04/2005 08:48:00 PM
In yesterday's FT was this interesting article.
Excerpt:
"The Bank of Japan on Wednesday failed to attract enough offers in a bill-buying operation for the first time in nearly two and a half years, raising speculation that the central bank may struggle to meet its ultra-loose liquidity targets.
The BoJ conducts money market operations aimed at keeping the balance of current accounts deposited at the central bank between Y30,000bn and Y35,000bn. Because interest rates have long been at zero, the bank has flooded the markets with liquidity in an effort to head off systemic risk and rid the economy of deflation, which has dogged the economy since the mid-1990s.
On Wednesday, the BoJ sought to buy Y1,000bn of discount bills, but offers from financial institutions - already flush with cash - fell below Y700bn. The shortfall was even more shocking given that the BoJ was conducting a powerful "all offices" transaction in which its regional branches also participated."
Since the US has received most of the financing of its current account deficit from foreign central banks, if the BoJ struggles with its liquidity operations in Japan, would they have difficulty increasing their dollar reserves?
Brad Setser and Nouriel Roubini have been writing some excellent articles on the current account deficit and foreign dollar reserves.
Dan Froomkin on Social Security
by Calculated Risk on 2/04/2005 06:30:00 PM
Froomkin's WaPo article, "Avoiding the Tough Questions" is excellent.
An excerpt:
"... there are some serious and legitimate concerns that need to be addressed about Bush's Social Security proposals and how they are being characterized.
One overarching issue is that the White House is talking about Social Security as if it were one big underperforming 401(k) program. In other words, they're implying that workers right now get back what they put in plus interest -- and that the interest rate they're getting is not so hot.
But it's not that way, not by a long shot. Social Security is a complex social insurance program that uses payroll taxes from current workers to pay benefits to the elderly, the disabled and their families in a progressive manner that guarantees an income floor below which the least fortunate are not allowed to sink."
Ahhh ... a Safety Net?
An excellent analysis worth reading.
Tuesday, February 01, 2005
Advertising
by Calculated Risk on 2/01/2005 11:32:00 PM
Advertisements: Thank you for your interest!
Advertising space is limited and available on a fixed price per month basis.
A maximum of three banner ads will run at any one time in the upper portion of the right side bar.
A banner is 190 X 120 pixels.
If the advertiser hosts the graphic (recommended), they are welcome to change the image as often as they like.
If you'd like to place a banner ad on Calculated Risk, please contact me for pricing.
About Me and Media Requests
by Calculated Risk on 2/01/2005 11:11:00 PM
Calculated Risk: a senior executive, retired from a public company, with a background in investing, finance and economics.
Tanta: Tanta passed away in December 2008. Please see: Tanta: In Memoriam for more.
For media requests: Please feel free to quote from the blog (with a reference). I'm not looking for any personal publicity, but I'm happy to discuss economic and housing issues for background (emails or phone calls). Please feel free to email me. Please see Tanta's piece: Media Inquiries Policy.
Thank You
by Calculated Risk on 2/01/2005 10:43:00 PM
Thank you for the tip!
Your transaction has been completed, and a receipt has been emailed to you by PayPal.
Best Wishes.
Click here to return to the main page.
GAO: Long Term Fiscal Challenge
by Calculated Risk on 2/01/2005 09:53:00 PM
The GAO released a report on their recent forum addressing long term fiscal challenges. Three key points:
1) Today's fiscal policy is unsustainable.
2) Health Care Is the Largest and Perhaps Most Difficult Part of the Long-Term Fiscal Challenge.
"Health care is a bigger problem than Social Security. Participants acknowledged the need for Social Security reform but emphasized that Social Security is a relatively small part of the long-term fiscal challenge when compared to spending on health care. One participant noted that the estimated Social Security shortfall is about one-third the estimated cost of recent tax cuts if made permanent. Several participants observed that few members of the public are aware of this. Rather, the general public impression is that solving Social Security would solve most of the longterm fiscal challenge, and this is not correct. Indeed, one forum participant stated that it was only by attending this forum that he had learned that health care spending was a much more important, and potentially far more difficult, component of the long-term fiscal challenge than Social Security.
Participants expressed the view that in characterizing the long-term fiscal outlook, several key distinctions needed to be made between Social Security and the largest federal health programs, Medicare and Medicaid. Participants observed that the public was largely unaware that health spending accounted for a much larger share of the long-term fiscal problem than did Social Security."
3) We need to elevate the public discourse to address the problem. There is a serious lack of leadership, especially in the White House.
"Participants agreed that a key moral context is the impact federal budget deficits will have on future generations. Another key moral context is integrity. Some participants called for greater integrity, e.g., transparency, in the federal budget process."
And a table of fiscal exposures (billions of dollars, End of 2003):
See page 50, GAO-05-282SP CG Forum
Selected Fiscal Exposures: Sources and Examples
Explicit Liabilities
Publicly held debt ($3,913)
Military and civilian pension and post-retirement health ($2,857)
Veterans benefits payable ($955)
Environmental and disposal liabilities ($250)
Loan guarantees ($35)
Explicit Financial commitments
Undelivered orders ($596)
Long-term leases ($47)
Financial contingencies
Unadjudicated claims ($9)
Pension Benefit Guaranty Corporation ($86)
Other national insurance programs ($7)
Government corporations e.g., Ginnie Mae
Exposures implied by current policies or the public's expectations about the role of government
Debt held by government accounts ($2,859)b
Future Social Security benefit payments ($3,699)c
Future Medicare Part A benefit payments ($8,236)c
Future Medicare Part B benefit payments ($11,416)c
Future Medicare Part D benefit payments ($8,119) c
Life cycle cost including deferred and future maintenance and operating costs (amount unknown)
Government Sponsored Enterprises e.g., Fannie Mae and Freddie Mac


