 RSS Feed
 by Calculated Risk on 3/10/2005 03:02:00 PM
Thursday, March 10, 2005
The Other Trust Funds
With all of the attention on Social Security (OASI), perhaps we should also look at some of the other trust funds. As an example, the CSRS (Civil Service Retirement System) is similar to OASI program. CSRS is a defined benefit plan that uses contributions from today's employees to pay today's retirees. And like OASI, CSRS is running annual surpluses; $28 Billion in fiscal 2003. SOURCE: Monthly Treasury Statement.
But unlike OASI, CSRS is on-budget and is included in the President's budget report. In fact, with the exception of OASI and the Postal Service, all of the other trust funds (150+ in all) are included on-budget. This means that the surpluses from these programs are used to directly offset any deficit spending by the Federal Government. Of course, even Fed Chairman Greenspan talks about the "unified" budget that includes the OASI surplus as part of the budget - so the distinction between on-budget and off-budget is being lost.
This graph shows the growth of both OASI and the other trust funds. SOURCE: Treasury Dept.
Trust Fund reserves in Billions.
Click on Graph for larger image.
Many of these programs will suffer similar demographic issues as OASI. So when someone like victor at the Dead Parrot questions the existence of the OASI Trust Fund, he is also speaking to our military, Federal employees, Civil Service workers and many others who are paying into similar retirement insurance plans. Thanks to pgl at Angry Bear and William Polley for reminding me of this issue.
Tuesday, March 08, 2005
Fed's Poole: Social Security Needs Small Changes
by Calculated Risk on 3/08/2005 03:31:00 PM
In a Q&A session after a speech today in West Palm Beach, Federal Reserve Bank of St. Louis President William Poole said, according to a Reuters article, that it would not take a large change in some combination of either tax increases, benefit cuts or an increase in the retirement age to put the Social Security retirement plan in "pretty good balance."
In the speech, "A Perspective on the Graying Population and Current Account Balances" Poole argued that demographic factors are being overlooked with regards to the Current Account Balance.
Housing: Excessive Leverage?
by Calculated Risk on 3/08/2005 01:46:00 AM
The article "Risky real estate moves" on CNN Money discusses the growing prevalence of no money down home purchases by first time buyers. The article presents a table showing the percentage down payment for first time homebuyers. The following table combines CNN's table (data from the National Association of Realtors in early 2005) with earlier data from NAR in early 2003.
Click on graph for larger image.
Source: NAR
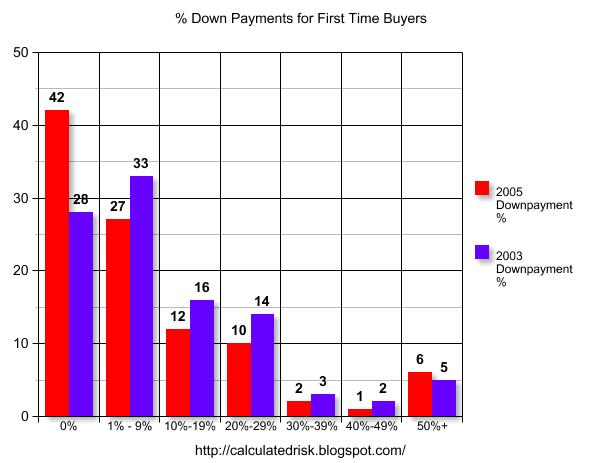

Fully 42% of first time buyers put no money down and 69% put less than 10% down. Two years ago 28% put no money down and 61% put less than 10% down. Clearly first time buyers are opting for more leveraged transactions.
The CNN article also discusses three leveraged borrowing programs. The first, "piggyback" loans, allows the homebuyer to take out a line of credit to cover the down payment resulting in 100% financing.
The second, interest only loans, allows the buyer to purchase more home by limiting their payment to the interest due. And the third program has several payment options, including a "minimum payment" that allows the buyer to pay less than the interest owed, resulting in an increasing loan balance.
All of these programs are increasing in popularity and increasing the amount of leverage for the buyer. The third program, combined with no money down, creates significant systemic risk. Who bears the risk? Not the first time buyer. Since the loan is collateralized with the house, the buyer can just walk away and only suffer the minor indignity of a foreclosure on their credit record. The real risk is borne by the lender.
Monday, March 07, 2005
Housing: Two Worrisome Signs
by Calculated Risk on 3/07/2005 03:25:00 AM
Two articles on Real Estate caught my attention tonight ...
The first is a "How to Flip" article on ABC News! (thanks to Patrick)
Sensible Shopper: Real Estate 'Flipping'Oh my! Of course I've been telling people that it is rational to speculate in Real Estate as long as very little of their own money is at risk. I've even explained "moral hazard" to a few people.
What You Need to Know to Get in on the Trend in the Hot Real-Estate Market
The second is a monthly newsletter concerning Bay Area Real Estate (Northern California). Here is the executive summary:
"The SCC real estate market has lost much of its steam in terms of volume. Decreasing volume is 'normal' behavior for the Santa Clara County real estate market for the end of the year. It is the degree of the decrease that remains a concern. Volume went from 154% of the 10-year average to 132% in June. Then went from 132% to 114% from mid-November to mid-December; and finally from 114% to 98% starting January 12, 2005. SCC only experienced 44% of the offers seen during the peak summer. This is a lower percentage than any of the 10-years that we have data for."Blame it on the rain?
Sunday, March 06, 2005
China and the Price of Gas
by Calculated Risk on 3/06/2005 08:51:00 PM
Last Friday, the USA Today reported that "Gas prices might increase 24 cents". Then at the annual meeting of the National People's Congress, Chinese Foreign Minister Li Zhaoxing told reporters that China 'should not be held responsible for the world's rising oil prices'.
Is China responsible for the increase in oil prices, and consequently, gas prices?
Li was quoted as saying: "Although China's energy import has increased a little bit over the past two years, its import only accounts for approximately six per cent of the world's total traded oil."
From the article:
It's true that China's energy demand has increased to certain extent as the country's economy has been growing rapidly in recent years, but the demand is mainly to be met domestically, he said.
Besides, he said, there is a big potential of saving energy and improving the use of energy efficiency in China's domestic energy supply.
Therefore, the Western media criticism saying that China is a major impact on the world's oil price is "groundless", he said
First, here is a chart of China's oil production and consumption since 1980 (Source: Dept of Energy)
Click on graph for larger image.
Source: Dept of Energy
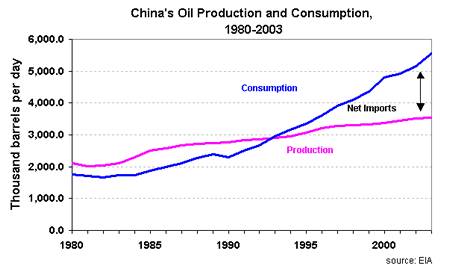
Starting in 1994 China became a net importer of oil. The graph ends in 2003 with China importing 2.1 million barrels per day (bbl/d). In 2004 China's oil imports increased another 35% to approximately 3 million bbl/d. Still, as Minister Li pointed out, that is a small percentage of the World's traded oil. Also, the United States increased oil imports in 2004 by about 0.7 million bbl/d to 12.25 m bbl/d. Although China's oil imports are growing faster than the US, both in percentage and bbl/d terms, China's oil import quantities are still only about 25% of the United States.
So why has the price of oil increased so dramatically? Here is at least part of the reason: Both the supply and demand curves for oil are very steep. We all know this intuitively. If there is little unused capacity, it takes time for more oil production to become available since this involves huge capital intensive projects. And, in the short term, demand is fairly inelastic over a wide range of prices; for the most part people stay with their routines and keep their same vehicle. With two steep curves (supply and demand) we get the following:
OIL Supply and Demand
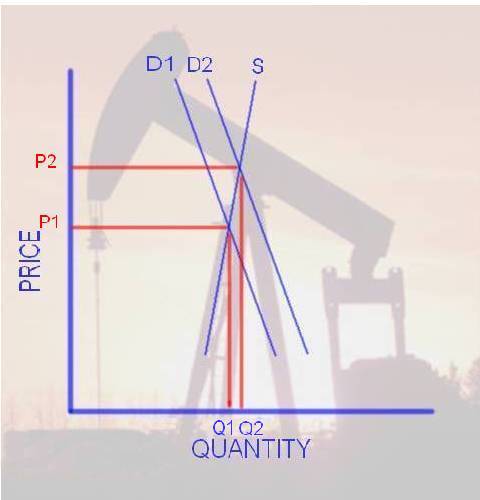
UPDATE: fixed typo on drawing. With a small increase in Demand (from D1 to D2), we see a small increase in Quantity (Q1 to Q2), but a large change in Price (from P1 to P2). Also a large price increase would occur if we had a small decrease in supply such as disruption to production, transport or refining (like hurricane Ivan in the GOM last year).
Of course the opposite is also true. A relatively small decrease in demand (or increase in supply) would cause a significant drop in price. So China's relatively small increase in demand (and the US too!) could have caused a large increase in oil prices.
Is China to blame for higher gas prices? Of course not. They have the same right to oil as any other consumer. But the increased demand in the US and China has most likely caused (without blame) the increase in prices.
The above assumes perfectly competitive markets. And oil differs from most commodities: "it is an exhaustible resource, production is controlled by national governments, and for the major oil exporters oil is the overwhelmingly dominant source of national income." (See: Krugman "The Energy Crisis Revisited") However if the world's spare capacity is exhausted, then the simple approach is probably reasonable.
There could be other factors effecting the price of oil - a terrorism premium and hedge funds speculation are often mentioned as culprits - however, I think the simple explanation is probably the most accurate: fast growth in China coupled with strong growth in the U.S. has utilized most of the world's spare capacity. Since supply is almost inelastic (in the short term), price fluctuates significantly with small changes in demand.
But what happens in the intermediate term? In the longer term the situation becomes more complicated. Since oil is an exhaustible resource, we may be getting close to "peak production" - where the maximum annual oil production is reached and then we will start a long decline in production. There is no way of knowing how close the world is to peak production since many of the key reserves are held by national governments (like Saudi Arabia) and they are not forthcoming with hard data. This lack of transparency has caused concern and might be leading to some of the rumored hedge fund speculation. After oil production starts to decline, the world will need to find a substitute for the loss of oil supply. In that regards, I believe high prices will be the wellspring of innovation.
More certain is that if the prices hold, we will see both more production (assuming we are not at Peak Oil), substitution and a moderation in demand. The following chart shows US oil consumption for the last 50 years.
Source: Dept of Energy

The two oil shocks (1973 and 1979) were followed by periods of slackening demand. The industrial sector has never returned to the 1979 consumption levels (due to a combination of efficiencies and substitutes) and "other uses", like electricity generation using oil, has also declined significantly. This leaves motor fuel and "other transportation" as the growth sectors for oil consumption. For demand to decrease, people will probably have to park their Hummers and buy a Prius!
Final comments: There are other reasons than just price to decrease our dependence on oil.
First, burning oil products is a major contributor to global warming. This is a serious problem and, as Professor Tim Barnett of the Scripps Institution of Oceanography said in February: "The debate over whether there is a global warming signal is over now at least for rational people."
And the second is an ethical question: Since oil is an exhaustible resource, do we, the 21st Century cohorts, have a right to burn all of it? Or do we have a responsibility to future generations to use it more discerningly?
Saturday, March 05, 2005
Greenspan's March to Infamy
by Calculated Risk on 3/05/2005 02:22:00 AM
On two March 2nds, exactly four years apart, Fed Chairman Alan Greenspan testified before the House Committee on the Budget, not in his role as Chairman of the Federal Reserve, but speaking for "himself".
In his 2001 testimony, Mr Greenspan, with his usual caution and caveats, talked of surpluses for the foreseeable future. Greenspan was effusive (well, effusive for Greenspan) offering projections of "an on-budget surplus of almost $500 billion ... in fiscal year 2010". The National Debt would soon be retired and the Boomer's retirements secure. Greenspan offered a projection of "an implicit on-budget surplus under baseline assumptions well past 2030 despite the budgetary pressures from the aging of the baby-boom generation, especially on the major health programs."
Just four years later, again on March 2nd, Greenspan offered a starkly different view to the same committee. This year Greenspan talked of large "unified" deficits and commented that "our budget position is unlikely to improve substantially in the coming years unless major deficit-reducing actions are taken." He targeted Social Security and Medicare for cuts, saying "we may have already committed more physical resources to the baby-boom generation in its retirement years than our economy has the capacity to deliver."
I will leave the interpretation of Greenspan's motivations to others (like Paul Krugman's Op-Ed piece "Deficits and Deceit" in the NYTimes). But for this review, I would like to point out three significant misleading comments in Greenspan's speeches.
First, in both speeches Greenspan praised the fiscal discipline of Congress in the '90s and suggested that Congress' discipline, along with strong productivity gains, brought the deficits of the '80s under control. Greenspan is only half right. Look at this graph (with the 1990s enlarged) from this previous post.
NOTE: Click on graphs for larger image.
Source: U.S Treasury

Not only did Government Outlay as a % of GDP decline in the '90s, but Greenspan seems to have forgotten that Government Income increased as a % of GDP; the tax side of the equation! In fact there were 5 major General Fund tax increases between 1982 and 1993 that contributed to bringing the budget into balance. They were:
Tax Equity and Fiscal Responsibility Act of 1982 - ReaganFor an analysis of Major Tax Bills since 1940 see OTA Working Paper 81, U.S. Treasury Office of Tax Analysis by Jerry Tempalski.
Deficit Reduction Act of 1984 - Reagan
Omnibus Budget Reconciliation Act of 1987 - Reagan
Omnibus Budget Reconciliation Act of 1990 - G HW Bush
Omnibus Budget Reconciliation Act of 1993 - Clinton
Second, Mr. Greenspan erroneously suggests that only budget cuts, not tax increases, will bring the budget back into balance. He said "... tax increases ... arguably pose significant risks to economic growth and the revenue base." Further, Greenspan said "... if at all possible ... close the fiscal gap primarily, if not wholly, from the outlay side." That argument ignores the cause of the budget deficit that the following graph illustrates (same as above without '90s enlarged):
The annual deficit is the difference between the red and blue lines. Although spending increased after 2000, most of the deficit came from the substantial tax cuts of the last four years. These are historically low tax rates (as a % of GDP) and to suggest that raising the rates would jeopardize the recovery has no foundation in economic theory. It also contradicts recent history (that Mr. Greenspan seems to have forgotten).
Source: U.S. Treasury

And third, in his 2005 speech, Mr. Greenspan referred to the "unified budget" saying that "the unified budget is running deficits equal to about 3-1/2 percent of gross domestic product". In his 2001 speech, Mr. Greenspan more correctly spoke of on-budget and off-budget surpluses. Now that we are running large deficits, he only talks about the "unified budget". This is very misleading.
The problem with the "unified budget" is that it adds the Social Security surplus (and other off-budget surpluses) to the General Fund and masks the actually budget problem. One would think that the annual budget deficit would equal the annual increase in the National Debt. This is true if you use the General Fund deficit, but not the "unified deficit". The real fiscal issue is the General Fund deficit; the General Fund is running annual deficits of almost 6% of GDP!
Of course, if the Social Insurance payroll tax is just another General Fund tax then Mr. Greenspan is correct. But let me remind Mr. Greenspan (who chaired the 1983 Social Security "Greenspan Commission"):
1) IF the entire Social Insurance payroll tax is used for social insurance (retirement insurance, survivors insurance, health insurance) then the tax is NOT regressive.
2) IF the Social Insurance surplus is used as a General Fund tax (as using the "unified budget" suggests), then that portion of the payroll tax is highly regressive.
A regressive tax is redistributive of wealth from lower income workers to the wealthy. Not a desired consequence of tax policy.
These are three major misleading comments. Mr. Greenspan may have been speaking for himself, but his words carry the power and authority of the World's leading banker. I believe he should be more careful and far more accurate.
Wednesday, March 02, 2005
Will an Adjustment in the Current Account Deficit Lead to a Recession?
by Calculated Risk on 3/02/2005 07:05:00 PM
Here is a new paper that does an historical review of previous CAD adjustments , "Financial Market Developments and Economic Activity during Current Account Adjustments in Industrial Economies" by Croke, Kamin and Leduc.
The consequences of an adjustment in the current account deficit is being widely discussed. Some observers believe that an orderly adjustment is probable. Others, like Roubini and Setser, argue that a disorderly adjustment is very possible and "could result in a sharp economic slowdown in the US." This new paper looks at historical occurrences of Current Account Adjustments and Croke, Kamin and Leduc conclude:
"a significant subset of the adjustment episodes we studied were associated with substantial declines in GDP growth ... Thus, the fear that current account adjustment might be associated with recession is not entirely without basis."
BUT ...
"[O]ur second main finding is that the shortfall in growth experienced in the contraction episodes appears to reflect the playing out of standard cyclical developments rather than a response to current account adjustment."My interpretation of their conclusion is that a CAD adjustment doesn't necessarily cause a recession, but a recession cures a CAD problem. Is that good news or bad?
NOTE: DeLong reviews another recent paper "The U.S. Current Account and the Dollar" by Oliver Blanchard, Francesco Giavazzi, Filipa Sa". I also recommend Macroblog and New Economist.
UPDATE: Both Macroblog and New Economist have posts reviewing this new paper.
The Worsening General Fund Deficit
by Calculated Risk on 3/02/2005 03:06:00 PM
Here is the current Year over Year deficit number (March 1, 2004 to March 1, 2005). As of March 1, 2005 our National Debt is:
$7,701,629,503,518.55 (that is over $7.7 Trillion)
As of March 1, 2004, our National Debt was:
$7,065,724,603,168.71
So the General Fund has run a deficit of $635.9 Billion and change over the last 12 months. SOURCE: US Treasury
Source: U.S. Treasury

For comparison:
For Fiscal 2004 (End Sept 30, 2004): $596 Billion
For Jan 1, 2004 to Jan 1, 2005: $609.8 Billion
For Feb 1, 2004 to Feb 1, 2005: $618.6 Billion
It just keeps getting worse.
NOTE: I use the increase in National Debt as a substitute for the General Fund deficit. For technical reasons this is not exact, but it is close. Besides I think this is a solid measure of our indebtedness; it is how much we owe!
Update: New Home Sales as Leading Indicator
by Calculated Risk on 3/02/2005 02:53:00 AM
In my earlier post, I suggested that the volume of New Home Sales might be a leading indicator for a consumer led economic slowdown. One of the questions I was asked was how many times did housing decline and the economy not slide into recession (a false positive)? Another reasonable question would be how many recessions does the signal miss (a false negative)?
We only have 42 years of data from the Census Bureau that includes 6 recessions. This is a very small sample. A housing slowdown did not immediately precede either the 1969 or 2001 recessions (the 2001 recession was mostly business related). The following graph shows the annual volume of New Home Sales since 1963 (the earliest data from the Census Bureau).
NOTE: The annual data loses resolution and does not show all of the information contained in the previous post's graphs.
The shaded lines on the graph are approximate and represent U.S. economic recessions.
Click on the graph for a larger image.
Source: Census Bureau

Here is a graph from the earlier post showing housing and the early '80s recession. Compare that to the double dip recession in the previous graph. In this graph we can see the monthly detail and that the declining volume of New Home Sales were a reasonable leading indicator for both economic recessions.
Source: Census Bureau
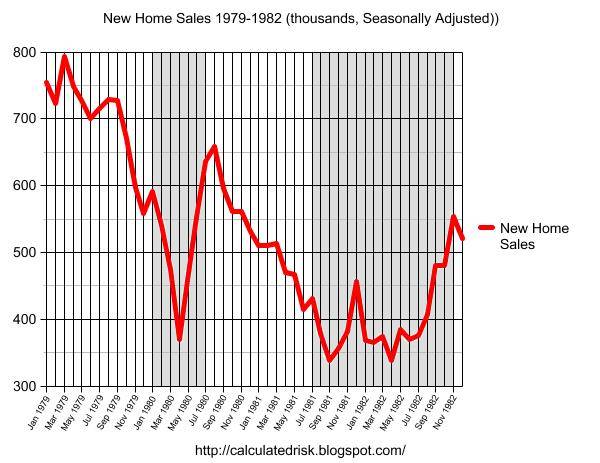
K Harris pointed out some potential anomalies in the Census Bureau data. It is very possible that the January numbers were impacted by weather or other factors. I was NOT suggesting that the January drop in housing was indicative of a slowdown, only that if housing volumes continue to decrease that that might be a strong leading indicator. For this indicator to suggest an economic slowdown, the volume of New Home Sales would have to continue to decline over the next few months.
Predicting recessions is very difficult. The only reliable indicator is a flattening (or inverted) yield curve - and the running joke is that the yield curve has predicted 11 of the last 7 recessions! Also there is a strong incentive for most economists to always be bullish on the economy. Nobody will blame you if you miss a turning point, but to cry wolf is a disaster for your reputation. Here are a couple of examples from the Fed Chairman Alan Greenspan:
"It is very rare that you can be unqualifiedly bullish as you can be now."
Alan Greenspan, Jan 1973 (about 6 months before the economy went into recession).
"But such imbalances and dislocations as we see in the economy today probably do not suggest anything more than a temporary hesitation in the continuing expansion of the economy."
Alan Greenspan, Jan 1990 (about 6 months before the recession)
I'm not picking on Mr. Greenspan, just using him as an example. Here is another example: The WSJ conducted a survey of 40 economists in July 1990, and only one predicted a recession. The Journal went so far as to ridicule the one economist predicting a recession, suggesting that he "now has predicted four of the past zero recessions." With hindsight we now know that in July 1990 the economy was ALREADY in recession!
For an excellent analysis of recession prediction, I suggest the following paper by the IMF's Prakash Loungani "The Arcane Art of Predicting Recessions".
Tuesday, March 01, 2005
More Evidence of Housing Speculation
by Calculated Risk on 3/01/2005 01:26:00 PM
The National Association of Realtors released a new report today. Here are a few key findings:
"... 23 percent of all homes purchased in 2004 were for investment, while another 13 percent were vacation homes. In addition, there was a record of 2.82 million second home sales in 2004, up 16.3 percent from 2.42 million 2003. The investment-home component rose 14.4 percent to 1.80 million sales in 2004 from 1.57 million in 2003, while vacation-home sales rose 19.8 percent to 1.02 million in 2004 from 850,000 in 2003."
And in the NYTimes today, "Speculators Seeing Gold in a Boom in the Prices for Homes", the story starts with this anecdote:
'Within six months last year, Carlos and Betti Lidsky bought and sold two condominiums. Then they bought and sold two houses. They say they will clear a half-million dollars in profit, and none of the homes have even been built.
Now Mr. Lidsky, a lawyer, and his wife, a charity fund-raiser, have put down a deposit on a fifth property, a $1.3 million condo in a high-rise under construction, and are planning to sell before the deal closes, without even taking out a mortgage.
"It is much better than the stock market," Mr. Lidsky said. "This is an extraordinary, phenomenally good result." '
And this on speculation:
'According to LoanPerformance Inc., a San Francisco mortgage data firm, about 8.5 percent of mortgages nationwide in the first 11 months of last year were taken out by people who did not plan to live in the houses themselves, up from 5.8 percent in 2000. In some markets, that proportion is much higher: in Phoenix, more than 12 percent of mortgages were taken out by investors; in Miami, the figure is 11 percent.
The National Association of Realtors, a trade organization that represents real estate brokers, said in a study being released on Tuesday that the percentage of homes bought for investment might be as high as one-quarter of the 7.7 million sold last year.
"Americans are treating real estate as a viable alternative to stocks and bonds," said David Lereah, chief economist at the Realtors association. And some are buying at least two properties at a time.'
Excessive speculation, poor credit quality, excessive leverage, oversupply of housing units ... all indicators of a bubble.
"Homeownership has become a vehicle for borrowing and leveraging as much as a source of financial security."
Former Fed Chairman Paul Volcker, Feb 11, 2005 (See Volcker's speech)


