 RSS Feed
 by Calculated Risk on 4/01/2024 07:31:00 PM
Monday, April 01, 2024
Tuesday: Job Openings, Vehicle Sales
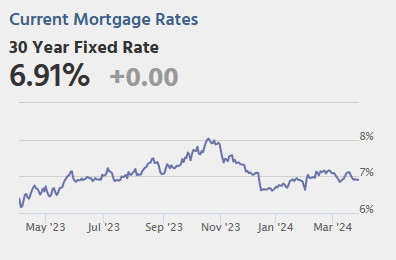
 From Matthew Graham at Mortgage News Daily: Mortgage Rates Sharply Higher to Start The Month
March ended with a streak of some of the flattest day-over-day changes in mortgage rates on record. It was all but certain that the new week/month would bring a change to that sideways trend, but the reality [w]as immediate and abrupt. [30 year fixed 7.05%]Tuesday:
emphasis added
• At 8:00 AM ET, Corelogic House Price index for February.
• At 10:00 AM, Job Openings and Labor Turnover Survey for February from the BLS.
• All Day Light vehicle sales for March. The consensus is for light vehicle sales to be 15.9 million SAAR in March, up from 15.8 million in February (Seasonally Adjusted Annual Rate).
ICE Mortgage Monitor: The Impact of "Golden-Handcuffs" on Mortgage Payments
by Calculated Risk on 4/01/2024 12:21:00 PM
Today, in the Real Estate Newsletter: ICE Mortgage Monitor: The Impact of "Golden-Handcuffs" on Mortgage Payments
Brief excerpt:
Press Release: ICE Mortgage Monitor: Trading Up to a 25% More Expensive Home Would More Than Double the Average Mortgage Holder’s PaymentThere is much more in the article.• From 2000 to 2022, upgrading to a 25% more expensive home would have required the average homeowner to increase their principal and interest payment by roughly 40%, or about $400 per month“Early-payment delinquencies remain elevated”
• Today, that same trade-up buyer’s payment would increase by an average of $1,384 per month, a 103% jump that highlights the real-world pressures keeping current mortgage holders “locked in” to their homes
• Simply giving up their current rate to move across the street to an equivalently priced home in today’s market would result in a nearly 40% increase in P&I – roughly as much as the historical trade-up cost
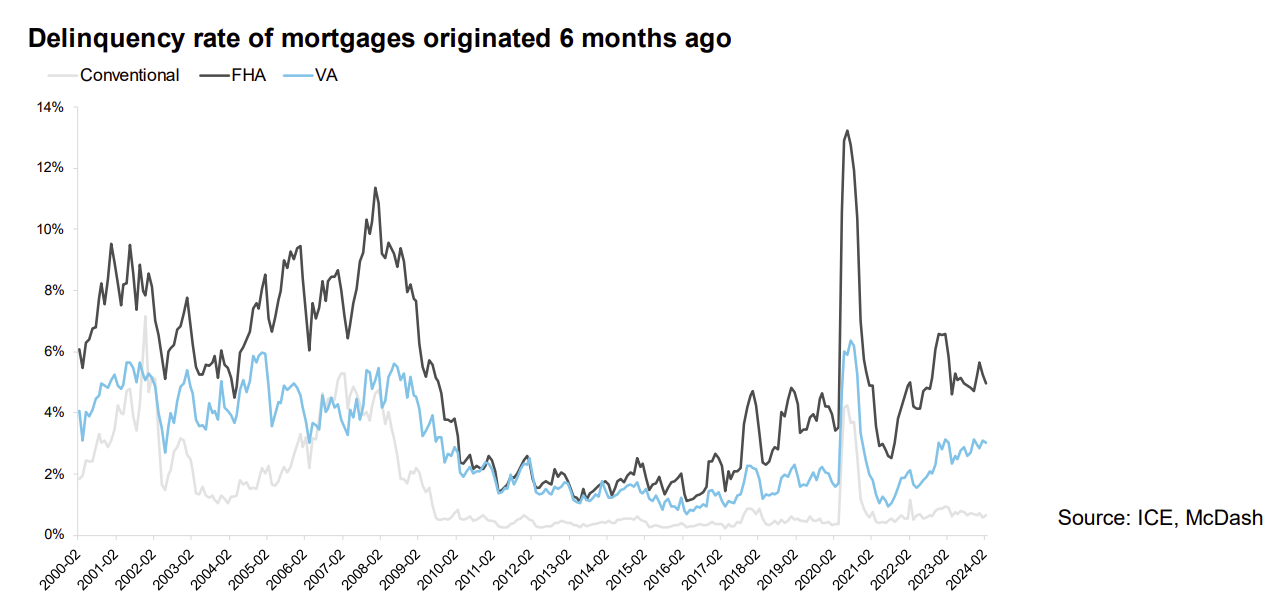
Here is a graph of the early delinquency rates for Conventional, FHA and VA loans. Conventional loans continue to perform well, but there is concern about FHA and VA loans.
•Early-payment delinquencies remain elevated among recent originations, particularly FHA and VA loan products
• Such delinquencies have edged upward in recent years but remain well below pre-Great Financial Crisis levels, while FHA and conventional mortgages have both improved modestly year over year, with VA loans holding roughly flat
• Though early-payment delinquencies on conventional mortgages remain low, performance of late-2023 FHA and VA loans, originated when rates neared 8% and debt-to-income ratios reached series highs, remain worth watching
Construction Spending Decreased 0.3% in February
by Calculated Risk on 4/01/2024 10:19:00 AM
From the Census Bureau reported that overall construction spending increased:
Construction spending during February 2024 was estimated at a seasonally adjusted annual rate of $2,091.5 billion, 0.3 percent below the revised January estimate of $2,096.9 billion. The February figure is 10.7 percent above the February 2023 estimate of $1,889.6 billionPrivate spending was unchanged and public spending decreased:
emphasis added
Spending on private construction was at a seasonally adjusted annual rate of $1,617.1 billion, virtually unchanged from the revised January estimate of $1,616.8 billion. ...
In February, the estimated seasonally adjusted annual rate of public construction spending was $474.4 billion, 1.2 percent below the revised January estimate of $480.1 billion.
 Click on graph for larger image.
This graph shows private residential and nonresidential construction spending, and public spending, since 1993. Note: nominal dollars, not inflation adjusted.
Residential (red) spending is 7.1% below the recent peak in 2022.
Non-residential (blue) spending is 1.1% below the peak two months ago.
Public construction spending is 1.9% below the peak two months ago.
 The second graph shows the year-over-year change in construction spending.
On a year-over-year basis, private residential construction spending is up 6.3%. Non-residential spending is up 12.6% year-over-year. Public spending is up 16.8% year-over-year.
This was below consensus expectations for 0.5% increase in spending, and total construction spending for the previous two months was revised down. This is probably just the start of weakness for private non-residential construction.
ISM® Manufacturing index Increased to 50.3% in March
by Calculated Risk on 4/01/2024 10:00:00 AM
(Posted with permission). The ISM manufacturing index indicated expansion. The PMI® was at 50.3% in March, up from 47.8% in February. The employment index was at 47.4%, up from 45.9% the previous month, and the new orders index was at 51.4%, up from 49.2%.
From ISM: Manufacturing PMI® at 50.3% March 2024 Manufacturing ISM® Report On Business®
Economic activity in the manufacturing sector expanded in March after contracting for 16 consecutive months, say the nation's supply executives in the latest Manufacturing ISM® Report On Business®.This suggests manufacturing expanded slightly in March. This was above the consensus forecast.
The report was issued today by Timothy R. Fiore, CPSM, C.P.M., Chair of the Institute for Supply Management® (ISM®) Manufacturing Business Survey Committee:
“The Manufacturing PMI® registered 50.3 percent in March, up 2.5 percentage points from the 47.8 percent recorded in February. The overall economy continued in expansion for the 47th month after one month of contraction in April 2020. (A Manufacturing PMI® above 42.5 percent, over a period of time, generally indicates an expansion of the overall economy.) The New Orders Index moved back into expansion territory at 51.4 percent, 2.2 percentage points higher than the 49.2 percent recorded in February. The March reading of the Production Index (54.6 percent) is 6.2 percentage points higher than February’s figure of 48.4 percent. The Prices Index registered 55.8 percent, up 3.3 percentage points compared to the reading of 52.5 percent in February. The Backlog of Orders Index registered 46.3 percent, the same reading as in February. The Employment Index registered 47.4 percent, up 1.5 percentage points from February’s figure of 45.9 percent.
emphasis added
Housing April 1st Weekly Update: Inventory Up 0.9% Week-over-week, Up 26.0% Year-over-year
by Calculated Risk on 4/01/2024 08:21:00 AM
Altos reports that active single-family inventory was up 0.9% week-over-week. Inventory bottomed in mid-February this year, as opposed to mid-April in 2023, and inventory is now up 4.7% from the February bottom.
 Click on graph for larger image.
This inventory graph is courtesy of Altos Research.
As of March 29th, inventory was at 517 thousand (7-day average), compared to 513 thousand the prior week.
Inventory is still far below pre-pandemic levels.

The red line is for 2024. The black line is for 2019. Note that inventory is up more than double from the record low for the same week in 2022, but still well below normal levels.
Inventory was up 26.0% compared to the same week in 2023 (last week it was up 23.9%), and down 37.9% compared to the same week in 2019 (last week it was down 38.2%).
Back in June 2023, inventory was down almost 54% compared to 2019, so the gap to more normal inventory levels is slowly closing.
Mike Simonsen discusses this data regularly on Youtube.
Sunday, March 31, 2024
Monday: ISM Mfg, Construction Spending
by Calculated Risk on 3/31/2024 06:11:00 PM
Weekend:
• Schedule for Week of March 31, 2024
Monday:
• At 10:00 AM ET, ISM Manufacturing Index for March. The consensus is for the ISM to be at 48.5, up from 47.8 in February.
• Also at 10:00 AM, Construction Spending for February. The consensus is for 0.5% increase in construction spending.
From CNBC: Pre-Market Data and Bloomberg futures S&P 500 are up 8 and DOW futures are up 67 (fair value).
Oil prices were up over the last week with WTI futures at $83.17 per barrel and Brent at $87.00 per barrel. A year ago, WTI was at $76, and Brent was at $79 - so WTI oil prices are up about 10% year-over-year.
Here is a graph from Gasbuddy.com for nationwide gasoline prices. Nationally prices are at $3.51 per gallon. A year ago, prices were at $3.49 per gallon, so gasoline prices are up $0.02 year-over-year.
Las Vegas February 2024: Visitor Traffic Up 9.5% YoY; Convention Traffic Up 15%
by Calculated Risk on 3/31/2024 08:21:00 AM
From the Las Vegas Visitor Authority: February 2024 Las Vegas Visitor Statistics
With an extra day from the leap year, a notable YoY increase in available rooms, a strong group segment and of course, a Super Bowl, the destination saw a robust YoY increase in visitors and record‐breaking room rates. Visitation for the month saw a 9.5% increase to reach 3.37M visitors, or roughly 300,000 more visitors than last February.
With the recurring NAHB Int'l Builders' Show and Kitchen & Bath Industry Show, along with the rotational returns of National Auto Dealers Association (24k attendees) and Int’l Roofing Expo (13k attendees) and several mid‐sized shows at properties across the destination, estimated convention attendance reached nearly 765k, +15.3% vs. last Feb.
Despite the larger room inventory vs. last year, overall hotel occupancy for the month surpassed last February by 1.7 pts to reach 83.9% as Weekend occupancy reached 90.3%, up 1.0 pts YoY, and Midweek occupancy came in at 81%, up 2.2 pts YoY.
Driven by dramatically strong rates during Super Bowl, ADR for the month exceeded $248 while RevPAR hit a record $208, +43.5% YoY
emphasis added
 Click on graph for larger image.
 The first graph shows visitor traffic for 2019 (Black), 2020 (dark blue), 2021 (light blue), 2022 (light orange), 2023 (dark orange) and 2024 (red).
Visitor traffic was up 9.5% compared to last February. Visitor traffic was up 5.8% compared to the same month in 2019.
The second graph shows convention traffic.
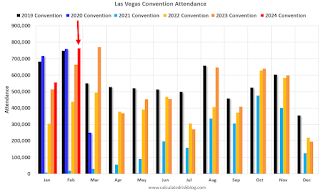
Convention traffic was up 15.3% compared to February 2023, and up 2.2% compared to February 2019. 
Note: There was almost no convention traffic from April 2020 through May 2021.
Leap year and the Super Bowl boosted traffic in February.
Saturday, March 30, 2024
Real Estate Newsletter Articles this Week: House Price Index Up 6.0% year-over-year
by Calculated Risk on 3/30/2024 02:11:00 PM
At the Calculated Risk Real Estate Newsletter this week:
• Case-Shiller: National House Price Index Up 6.0% year-over-year in January
• New Home Sales at 662,000 Annual Rate in February
• Inflation Adjusted House Prices 2.4% Below Peak
• FHFA’s National Mortgage Database: Outstanding Mortgage Rates, LTV and Credit Scores
• Fannie and Freddie: Single Family Serious Delinquency Rate Decreased, Multi-family Decreased in February
• Final Look at Local Housing Markets in February
This is usually published 4 to 6 times a week and provides more in-depth analysis of the housing market.
Schedule for Week of March 31, 2024
by Calculated Risk on 3/30/2024 08:11:00 AM
The key report scheduled for this week is the March employment report on Friday.
Other key reports include the February Trade Deficit and March Auto Sales.
For manufacturing, the March ISM Manufacturing survey will be released.
10:00 AM: ISM Manufacturing Index for March. The consensus is for the ISM to be at 48.5, up from 47.8 in February.
10:00 AM: Construction Spending for February. The consensus is for 0.5% increase in construction spending.
8:00 AM: Corelogic House Price index for February.
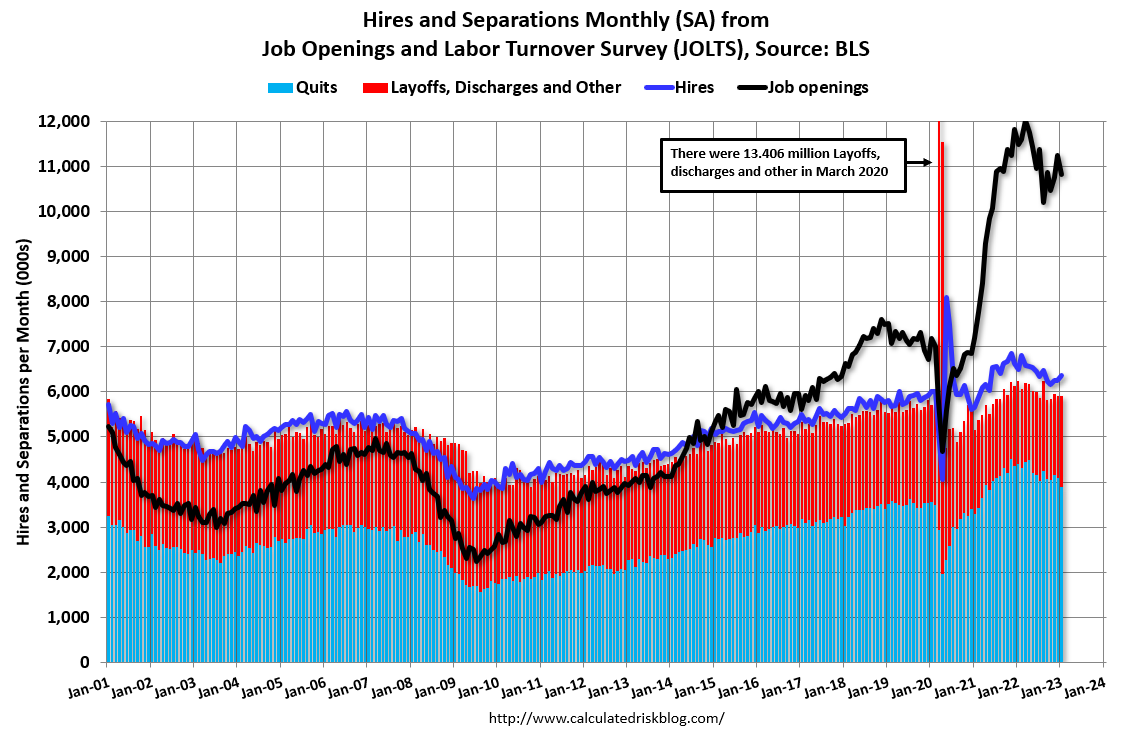 10:00 AM ET: Job Openings and Labor Turnover Survey for February from the BLS.
 This graph shows job openings (black line), hires (dark blue), Layoff, Discharges and other (red column), and Quits (light blue column) from the JOLTS.
Jobs openings decreased slightly in January to 8.86 million from 8.89 million in December.
The number of job openings (black) were down 15% year-over-year. Quits were down 13% year-over-year.
 All Day: Light vehicle sales for March. The consensus is for light vehicle sales to be 15.9 million SAAR in March, up from 15.8 million in February (Seasonally Adjusted Annual Rate).
This graph shows light vehicle sales since the BEA started keeping data in 1967. The dashed line is the February sales rate.
7:00 AM ET: The Mortgage Bankers Association (MBA) will release the results for the mortgage purchase applications index.
8:15 AM: The ADP Employment Report for March. This report is for private payrolls only (no government). The consensus is for 155,000 payroll jobs added in March, up from 140,000 added in February.
10:00 AM: the ISM Services Index for March.
8:30 AM: The initial weekly unemployment claims report will be released. The consensus is for 208 thousand initial claims, down from 210 thousand last week.
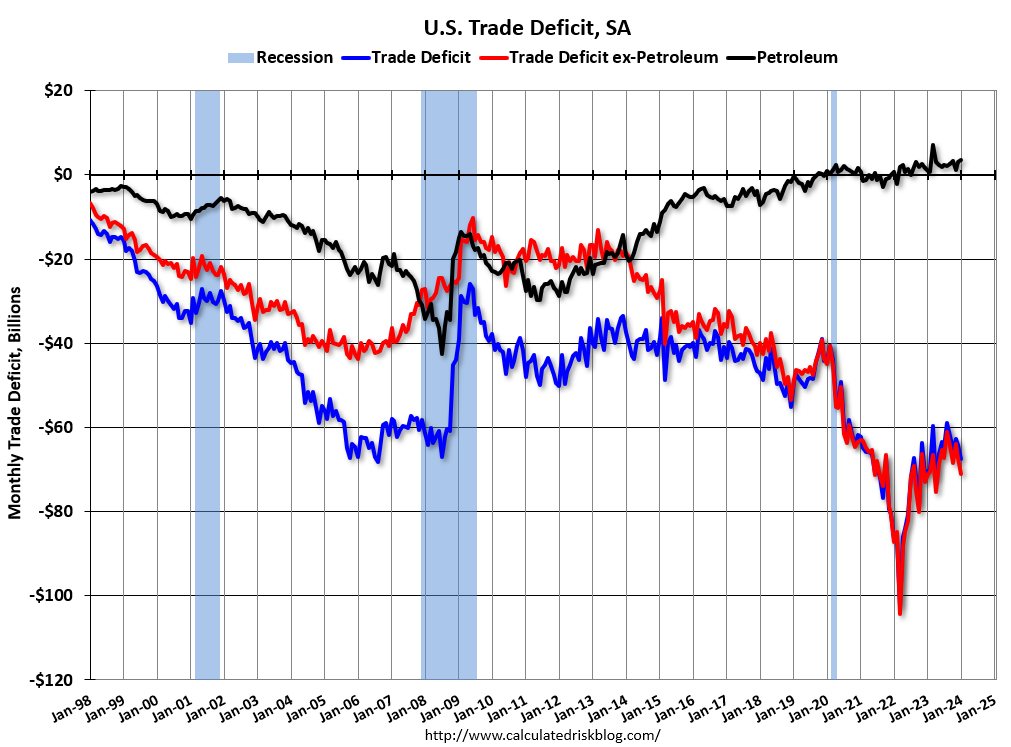 8:30 AM: Trade Balance report for February from the Census Bureau.
 This graph shows the U.S. trade deficit, with and without petroleum, through the most recent report. The blue line is the total deficit, and the black line is the petroleum deficit, and the red line is the trade deficit ex-petroleum products.
The consensus is the trade deficit to be $66.5 billion. The U.S. trade deficit was at $67.4 billion in January.
 8:30 AM: Employment Report for March. The consensus is for 200,000 jobs added, and for the unemployment rate to be unchanged at 3.9%.
There were 275,000 jobs added in February, and the unemployment rate was at 3.9%.
This graph shows the jobs added per month since January 2021.
Friday, March 29, 2024
March 29th COVID Update: Weekly Deaths Decreased
by Calculated Risk on 3/29/2024 07:17:00 PM
 Note: Mortgage rates are from MortgageNewsDaily.com and are for top tier scenarios.
Due to changes at the CDC, weekly cases are no longer updated.
For deaths, I'm currently using 4 weeks ago for "now", since the most recent three weeks will be revised significantly.
Hospitalizations have declined significantly from the winter high of 30,025 but are still above the low of 5,380 last year.
| COVID Metrics | ||||
|---|---|---|---|---|
| Now | Week Ago | Goal | ||
| Hospitalized2 | 8,584 | 10,326 | ≤3,0001 | |
| Deaths per Week2 | 1,164 | 1,234 | ≤3501 | |
| 1my goals to stop weekly posts, 2Weekly for Currently Hospitalized, and Deaths 🚩 Increasing number weekly for Hospitalized and Deaths ✅ Goal met. | ||||
 Click on graph for larger image.
This graph shows the weekly (columns) number of deaths reported.
Weekly deaths have declined sharply from the recent peak of 2,547 but are still more than double the low of 490 last July.
 This appears to be a leading indicator for COVID hospitalizations and deaths.
Nationally, COVID in wastewater is now off more than 85% from the holiday peak at the end of December, and that suggests weekly hospitalizations and deaths will continue to decline.


