 RSS Feed
 by Calculated Risk on 3/31/2024 08:21:00 AM
Sunday, March 31, 2024
Las Vegas February 2024: Visitor Traffic Up 9.5% YoY; Convention Traffic Up 15%
From the Las Vegas Visitor Authority: February 2024 Las Vegas Visitor Statistics
With an extra day from the leap year, a notable YoY increase in available rooms, a strong group segment and of course, a Super Bowl, the destination saw a robust YoY increase in visitors and record‐breaking room rates. Visitation for the month saw a 9.5% increase to reach 3.37M visitors, or roughly 300,000 more visitors than last February.
With the recurring NAHB Int'l Builders' Show and Kitchen & Bath Industry Show, along with the rotational returns of National Auto Dealers Association (24k attendees) and Int’l Roofing Expo (13k attendees) and several mid‐sized shows at properties across the destination, estimated convention attendance reached nearly 765k, +15.3% vs. last Feb.
Despite the larger room inventory vs. last year, overall hotel occupancy for the month surpassed last February by 1.7 pts to reach 83.9% as Weekend occupancy reached 90.3%, up 1.0 pts YoY, and Midweek occupancy came in at 81%, up 2.2 pts YoY.
Driven by dramatically strong rates during Super Bowl, ADR for the month exceeded $248 while RevPAR hit a record $208, +43.5% YoY
emphasis added
 Click on graph for larger image.
 The first graph shows visitor traffic for 2019 (Black), 2020 (dark blue), 2021 (light blue), 2022 (light orange), 2023 (dark orange) and 2024 (red).
Visitor traffic was up 9.5% compared to last February. Visitor traffic was up 5.8% compared to the same month in 2019.
The second graph shows convention traffic.
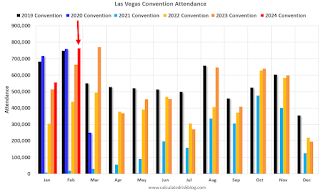
Convention traffic was up 15.3% compared to February 2023, and up 2.2% compared to February 2019. 
Note: There was almost no convention traffic from April 2020 through May 2021.
Leap year and the Super Bowl boosted traffic in February.


