 RSS Feed
 by Calculated Risk on 3/29/2024 07:17:00 PM
Friday, March 29, 2024
March 29th COVID Update: Weekly Deaths Decreased
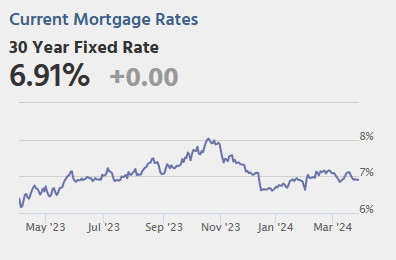 Note: Mortgage rates are from MortgageNewsDaily.com and are for top tier scenarios.
Due to changes at the CDC, weekly cases are no longer updated.
For deaths, I'm currently using 4 weeks ago for "now", since the most recent three weeks will be revised significantly.
Hospitalizations have declined significantly from the winter high of 30,025 but are still above the low of 5,380 last year.
| COVID Metrics | ||||
|---|---|---|---|---|
| Now | Week Ago | Goal | ||
| Hospitalized2 | 8,584 | 10,326 | ≤3,0001 | |
| Deaths per Week2 | 1,164 | 1,234 | ≤3501 | |
| 1my goals to stop weekly posts, 2Weekly for Currently Hospitalized, and Deaths 🚩 Increasing number weekly for Hospitalized and Deaths ✅ Goal met. | ||||
 Click on graph for larger image.
This graph shows the weekly (columns) number of deaths reported.
Weekly deaths have declined sharply from the recent peak of 2,547 but are still more than double the low of 490 last July.
 This appears to be a leading indicator for COVID hospitalizations and deaths.
Nationally, COVID in wastewater is now off more than 85% from the holiday peak at the end of December, and that suggests weekly hospitalizations and deaths will continue to decline.


