 RSS Feed
 by Calculated Risk on 5/23/2023 10:06:00 AM
Tuesday, May 23, 2023
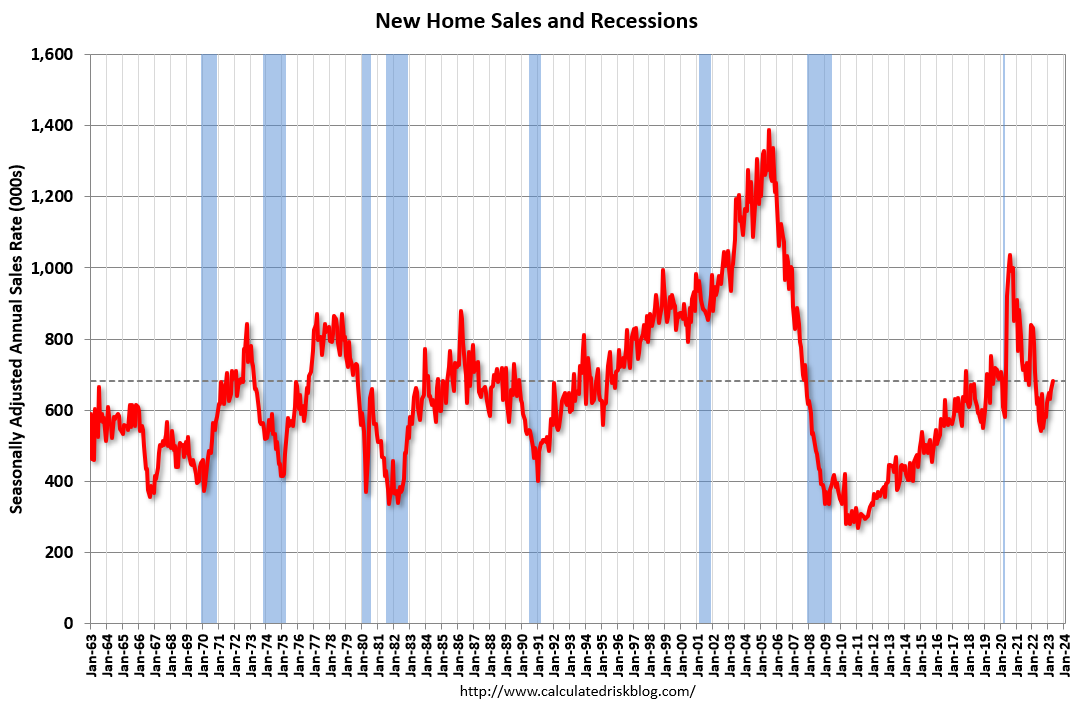
New Home Sales at 683,000 Annual Rate in April
The Census Bureau reports New Home Sales in April were at a seasonally adjusted annual rate (SAAR) of 683 thousand.
The previous three months were revised down, combined.
Sales of new single‐family houses in April 2023 were at a seasonally adjusted annual rate of 683,000, according to estimates released jointly today by the U.S. Census Bureau and the Department of Housing and Urban Development. This is 4.1 percent above the revised March rate of 656,000 and is 11.8 percent above the April 2022 estimate of 611,000.
emphasis added
 Click on graph for larger image.
The first graph shows New Home Sales vs. recessions since 1963. The dashed line is the current sales rate.
New home sales are close to pre-pandemic levels.
The second graph shows New Home Months of Supply.
 The months of supply decreased in April to 7.6 months from 7.9 months in March.
 The all-time record high was 12.2 months of supply in January 2009. The all-time record low was 3.3 months in August 2020.
This is well above the top of the normal range (about 4 to 6 months of supply is normal).
"The seasonally‐adjusted estimate of new houses for sale at the end of April was 433,000. This represents a supply of 7.6 months at the current sales rate."Sales were above expectations of 660 thousand SAAR, however, sales in the three previous months were revised down, combined. I'll have more later today.
Monday, May 22, 2023
Tuesday: New Home Sales
by Calculated Risk on 5/22/2023 08:18:00 PM
 From Matthew Graham at Mortgage News Daily: Mortgage Rates Approaching 7% Again
[M]ost of the past week saw the average top tier rate at 6.625% or higher for the average lender. And as of today, we're painfully close to 7.0% again. To be fair, we were already close to 7.0% on Friday. Most lenders didn't move much higher since then, and many lenders were already there. ... What's behind the spike? In general, the market is coming to terms with the possibility that the Federal Reserve may not have been that off-base over the past few months as it has maintained the need to keep rates "higher for longer." [30 year fixed 6.67%]Tuesday:
emphasis added
• At 10:00 AM ET, New Home Sales for April from the Census Bureau. The consensus is for 660 thousand SAAR, down from 683 thousand SAAR in March.
• Also at 10:00 AM, Richmond Fed Survey of Manufacturing Activity for May.
Final Look at Local Housing Markets in April
by Calculated Risk on 5/22/2023 11:56:00 AM
Today, in the Calculated Risk Real Estate Newsletter: Final Look at Local Housing Markets in April
A brief excerpt:
California Home Sales Down 36.1% YoY in April, Median Prices Decline 7.8% YoYThere is much more in the article. You can subscribe at https://calculatedrisk.substack.com/
Here is the press release from the California Association of Realtors® (C.A.R.): Higher mortgage rates and low housing inventory restrain California home sales in April, C.A.R. reports• Existing, single-family home sales totaled 267,880 in April on a seasonally adjusted annualized rate, down 4.7 percent from March and down 36.1 percent from April 2022.And a table of April sales.
• April’s statewide median home price was $815,340, up 3.0 percent from March and down 7.8 percent from April 2022. ...
In April, sales in these markets were down 26.1%. In March, these same markets were down 20.5% YoY Not Seasonally Adjusted (NSA).
This was a larger YoY decline NSA in April than in March for these markets, however there was one less selling day in April this year.
...
My early expectation is we will see a somewhat similar level of sales in May as in April. 30-year mortgage rates averaged about 6.4% in February and March (for closed sales in April), and 30-year rates averaged 6.44% in March and April (about the same).
...
More local data coming in June for activity in May!

What Happened to "Paying off the National Debt"?
by Calculated Risk on 5/22/2023 10:31:00 AM
At the turn of the millenium, the concern was that the US was paying off the debt too quickly!
Here are a few excerpts from a speech by then Fed Chair Alan Greenspan in April 2001: The paydown of federal debt
"Today I want to address a subject in which your group and the Federal Reserve share a keen interest--the paydown of the federal debt and its implications for the economy and financial markets. While the magnitudes of future federal unified budget surpluses are uncertain, they are highly likely to remain sizable for some time. ...What went wrong over the last 20+ years?
[C]urrent forecasts suggest that under a reasonably wide variety of possible tax and spending policies, the resulting surpluses will allow the Treasury debt held by the public to be paid off. Moreover, well before the debt is eliminated--indeed, possibly within a relatively few years--it may become difficult to further reduce outstanding debt to the public because the remaining obligations will mostly consist of savings bonds, well-entrenched holdings of long-term marketable debt, and perhaps other types of debt that could prove difficult to reduce."
Here is a list of events and policy choices that significantly increased the debt after 2000:
1) The 2000 projections were overly optimistic.
2) The 2001 recession.
3) The 2001 and 2003 Bush Tax Cuts.
4) 9/11, Homeland Security Spending and the War in Afghanistan
5) The War in Iraq
6) The Finacial Crisis and Great Recession
7) The Trump Tax Cuts
8) The Pandemic.
Here is a brief discussion ... (books have been written on each of these topics):
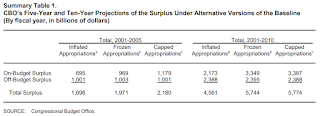
1) Overly Optimistic Projections: Here are the CBO projections from July 2000: The Budget and Economic Outlook: An Update
 Click on graph for larger image.
The CBO projections showed an almost $6 Trillion in debt reduction in the 2001 through 2010 period.
I argued in 2000 that these projections ignored possible negative events such as an investment led recession due to the bursting of stock bubble. These projections were clearly overly optimistic.
2) The 2001 Recession: Although Greenspan mentioned "the current slowdown in economic activity" in his April 2001 speech, he didn't realize the economy was already in a recession. From the May 2000 FOMC minutes:
3) Bush Tax Cuts: These tax cuts were sold as slowing the growth of the surpluses (using Greenspan's speech for cover)! Instead, the tax cuts (mostly for the wealthy) turned the surpluses into deficits and reduced revenue by $1.5 trillion or more over the 2001 - 2010 period.
 There were various Inspector General reports that the Fed and FDIC field examiners were expressing significant concerns in 2003 and 2004, but Greenspan was blocking all efforts to tighten standards - and the Bush Administratio was loosening bank regulations!
This photo shows John Reich (then Vice Chairman of the FDIC and later at the OTS) and James Gilleran of the Office of Thrift Supervision (with the chainsaw) and representatives of three banker trade associations: James McLaughlin of the American Bankers Association, Harry Doherty of America's Community Bankers, and Ken Guenther of the Independent Community Bankers of America.
1) Overly Optimistic Projections: Here are the CBO projections from July 2000: The Budget and Economic Outlook: An Update
 Click on graph for larger image.
The CBO projections showed an almost $6 Trillion in debt reduction in the 2001 through 2010 period.
I argued in 2000 that these projections ignored possible negative events such as an investment led recession due to the bursting of stock bubble. These projections were clearly overly optimistic.
2) The 2001 Recession: Although Greenspan mentioned "the current slowdown in economic activity" in his April 2001 speech, he didn't realize the economy was already in a recession. From the May 2000 FOMC minutes:
"The information reviewed at this meeting suggested that economic growth had remained rapid through early spring.."The economy was already in a recession!
3) Bush Tax Cuts: These tax cuts were sold as slowing the growth of the surpluses (using Greenspan's speech for cover)! Instead, the tax cuts (mostly for the wealthy) turned the surpluses into deficits and reduced revenue by $1.5 trillion or more over the 2001 - 2010 period.
4) 9/11, Homeland Security Spending and the War in Afghanistan: The 9/11/2001 attacks led to a sharp increase in homeland security spending and the War in Afghanistan.
5) The War in Iraq: The Bush administration argued the war would cost around $80 billion. VP Dick Cheney said on Meet the Press: "every analysis said this war itself would cost about $80 billion". Instead, the war cost well over $1 trillion (and countless lives were lost). Note: I've mentioned on this blog that "I opposed the Iraq war, and was shouted down and called names like "Saddam lover" for questioning the veracity of the information."
6) The Financial Crisis and Great Recession. This was the worst US recession since the Great Depression. This led to the first $1 trillion annual budget deficit in US history and dramatically increased the national debt. The causes of the bubble were rapid changes in the mortgage lending industry, rating agencies that didn't account for those changes, combined with a lack of regulatory oversight. I was talking with field regulators in 2005 and 2006, and they were all terrified. I was told the appointees at the top of the agencies were blocking any effort to tighten standards.
 There were various Inspector General reports that the Fed and FDIC field examiners were expressing significant concerns in 2003 and 2004, but Greenspan was blocking all efforts to tighten standards - and the Bush Administratio was loosening bank regulations!
This photo shows John Reich (then Vice Chairman of the FDIC and later at the OTS) and James Gilleran of the Office of Thrift Supervision (with the chainsaw) and representatives of three banker trade associations: James McLaughlin of the American Bankers Association, Harry Doherty of America's Community Bankers, and Ken Guenther of the Independent Community Bankers of America.
7) The Trump Tax Cuts: These tax cuts - mostly for the wealthy - were sold with several promises - all failed. See: The Failed Promises of the 2017 Tax Cuts and Jobs Act (TCJA). A couple of quote:
8) The Pandemic: Deficit spending increased sharply due to the pandemic.
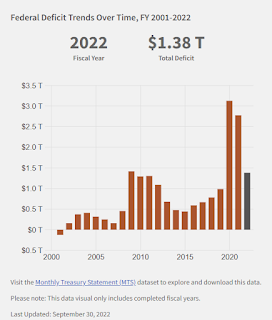 Here is a graph of the actual annual deficits since 2000.
Note: This is not adjusted for the growth of the economy. Later I'll post a graph showing the annual deficit as a percent of GDP.
So, what happened to "paying off the debt"? A series of adverse events (9/11, pandemic), and poor policy choices.
Note that all the "poor policy choices" were by Republicans including tax cuts, the Iraq War, and failure to properly regulate.
“Not only will this tax plan pay for itself, but it will pay down debt,” Treasury Secretary Steve Mnuchin, Sept 2017Complete nonsense.
“I think this tax bill is going to reduce the size of our deficits going forward,” Sen. Pat Toomey (R-PA), November 2017
8) The Pandemic: Deficit spending increased sharply due to the pandemic.
 Here is a graph of the actual annual deficits since 2000.
Note: This is not adjusted for the growth of the economy. Later I'll post a graph showing the annual deficit as a percent of GDP.
So, what happened to "paying off the debt"? A series of adverse events (9/11, pandemic), and poor policy choices.
Note that all the "poor policy choices" were by Republicans including tax cuts, the Iraq War, and failure to properly regulate.
We cannot always avoid adverse events, but I opposed each of these poor policy choices as they happened - so these are clearly avoidable.
In Joys of Yiddish, Leo Rosten gives the classic definition of "Chutzpah":
“Chutzpah is that quality enshrined in a man who, having killed his mother and father, throws himself on the mercy of the court because he is an orphan.”As far as the budget, the GOP has made a series of poor policy choices and now they want to cut the programs for the poor and middle class. Talk about Chutzpah!
Housing May 22nd Weekly Update: Inventory Increased 0.9% Week-over-week
by Calculated Risk on 5/22/2023 08:30:00 AM
Altos reports that active single-family inventory was up 0.9% week-over-week.
 Click on graph for larger image.
This inventory graph is courtesy of Altos Research.
As of May 19th, inventory was at 424 thousand (7-day average), compared to 420 thousand the prior week.
Year-to-date, inventory is down 13.6%. And inventory is up 4.6% from the seasonal bottom five weeks ago.

The red line is for 2023. The black line is for 2019. Note that inventory is up from the previous two years (the record low was in 2022), but still well below normal levels.
Inventory was up 25.4% compared to the same week in 2022 (last week it was up 34.4%), and down 53.3% compared to the same week in 2019 (last week down 53.1%).
It appears likely inventory will be down year-over-year in June of July.
Mike Simonsen discusses this data regularly on Youtube.
Sunday, May 21, 2023
Sunday Night Futures
by Calculated Risk on 5/21/2023 07:10:00 PM
Weekend:
• Schedule for Week of May 21, 2023
Monday:
• No major economic releases scheduled.
From CNBC: Pre-Market Data and Bloomberg futures S&P 500 are down 8 and DOW futures are down 58 (fair value).
Oil prices were up over the last week with WTI futures at $71.55 per barrel and Brent at $75.58 per barrel. A year ago, WTI was at $113, and Brent was at $114 - so WTI oil prices are down about 37% year-over-year.
Here is a graph from Gasbuddy.com for nationwide gasoline prices. Nationally prices are at $3.52 per gallon. A year ago, prices were at $4.58 per gallon, so gasoline prices are down $1.06 per gallon year-over-year.
The Changing Mix of Light Vehicle Sales
by Calculated Risk on 5/21/2023 09:54:00 AM
The first graph below shows the mix of sales since 1976 (Blue is cars, Red is light trucks and SUVs) through April 2023.

Click on graph for larger image.
The mix has changed significantly. Back in 1976, most light vehicles were passenger cars - however passenger car sales have trended down over time.
Note that the big dips in sales are related to economic recessions (early '80s, early '90s, the Great Recession of 2007 through mid-2009 and the pandemic in 2020).
The second graph shows the percent of light vehicle sales between passenger cars and trucks / SUVs.
 Over time the mix has changed toward more and more light trucks and SUVs. Only when oil prices are high, does the trend slow or reverse.
Currently about 80% of light vehicle sales are light trucks or SUVs.
It is possible EVs will have an impact on the mix.
Saturday, May 20, 2023
Real Estate Newsletter Articles this Week: "Near Record Multi-Family Under Construction"
by Calculated Risk on 5/20/2023 02:11:00 PM
At the Calculated Risk Real Estate Newsletter this week:
• April Housing Starts: Near Record Multi-Family Under Construction
• NAR: Existing-Home Sales Decreased to 4.28 million SAAR in April; Median Prices Declined 1.7% YoY
• Similar Number of Housing Units started in Q1 as 'Built-for-Rent' as 'Built-for-Sale'
• 4th Look at Local Markets in April
• Lawler: Early Read on Existing Home Sales in April
This is usually published 4 to 6 times a week and provides more in-depth analysis of the housing market.
You can subscribe at https://calculatedrisk.substack.com/
Most content is available for free (and no Ads), but please subscribe!
Schedule for Week of May 21, 2023
by Calculated Risk on 5/20/2023 08:11:00 AM
The key reports this week are the second estimate of Q1 GDP, April New Home Sales, and Personal Income and Outlays for April.
For manufacturing, the May Richmond and Kansas City Fed manufacturing surveys will be released.
No major economic releases scheduled.
 10:00 AM: New Home Sales for April from the Census Bureau.
 This graph shows New Home Sales since 1963. The dashed line is the sales rate for last month.
The consensus is for 660 thousand SAAR, down from 683 thousand SAAR in March.
10:00 AM: Richmond Fed Survey of Manufacturing Activity for May.
7:00 AM ET: The Mortgage Bankers Association (MBA) will release the results for the mortgage purchase applications index.
During the day: The AIA's Architecture Billings Index for April (a leading indicator for commercial real estate).
2:00 PM: FOMC Minutes, Minutes Meeting of May 2-3, 2023
8:30 AM: The initial weekly unemployment claims report will be released. The consensus is for 250 thousand initial claims, up from 242 thousand last week.
8:30 AM: Gross Domestic Product, 1st quarter 2023 (Second estimate). The consensus is that real GDP increased 1.1% annualized in Q1, unchanged from the advance estimate of 1.1%.
8:30 AM ET: Chicago Fed National Activity Index for April. This is a composite index of other data.
10:00 AM: Pending Home Sales Index for April. The consensus is for a 0.5% increase in the index.
11:00 AM: the Kansas City Fed manufacturing survey for May.
8:30 AM ET: Personal Income and Outlays, April 2023. The consensus is for a 0.4% increase in personal income, and for a 0.4% increase in personal spending. And for the Core PCE price index to increase 0.3%. PCE prices are expected to be up 4.3% YoY, and core PCE prices up 4.6% YoY.
8:30 AM: Durable Goods Orders for April from the Census Bureau. The consensus is for a 1.1% decrease in durable goods orders.
10:00 AM: University of Michigan's Consumer sentiment index (Final for May). The consensus is for a reading of 57.7.
Friday, May 19, 2023
May 19th COVID Update: New Pandemic Lows for Deaths and Hospitalizations
by Calculated Risk on 5/19/2023 09:01:00 PM
 Note: Mortgage rates are from MortgageNewsDaily.com and are for top tier scenarios.
Due to changes at the CDC, weekly cases are no longer updated.
After the first few weeks, the pandemic low for weekly deaths had been the week of July 7, 2021, at 1,690 deaths (until recently).
For COVID hospitalizations, the previous low was 9,821 (until three weeks ago).
| COVID Metrics | ||||
|---|---|---|---|---|
| Now | Week Ago | Goal | ||
| Hospitalized2 | 8,159 | 8,859 | ≤3,0001 | |
| Deaths per Week2 | 865 | 1,079 | ≤3501 | |
| 1my goals to stop weekly posts, 2Weekly for Cases, Currently Hospitalized, and Deaths 🚩 Increasing number weekly for Hospitalized and Deaths ✅ Goal met. | ||||
 Click on graph for larger image.
This graph shows the weekly (columns) number of deaths reported.
For deaths, I'm currently using 3 weeks ago for "now", since the most recent two weeks will be revised significantly.


