 RSS Feed
 by Calculated Risk on 5/19/2023 03:03:00 PM
Friday, May 19, 2023
LA Port Inbound Traffic Down Sharply YoY in April
Notes: The expansion to the Panama Canal was completed in 2016 (As I noted several years ago), and some of the traffic that used the ports of Los Angeles and Long Beach is probably going through the canal. This might be impacting TEUs on the West Coast.
Container traffic gives us an idea about the volume of goods being exported and imported - and usually some hints about the trade report since LA area ports handle about 40% of the nation's container port traffic.
The following graphs are for inbound and outbound traffic at the ports of Los Angeles and Long Beach in TEUs (TEUs: 20-foot equivalent units or 20-foot-long cargo container).
To remove the strong seasonal component for inbound traffic, the first graph shows the rolling 12-month average.
 Click on graph for larger image.
On a rolling 12-month basis, inbound traffic decreased 2.4% in April compared to the rolling 12 months ending in March. Outbound traffic decreased 0.4% compared to the rolling 12 months ending the previous month.
The 2nd graph is the monthly data (with a strong seasonal pattern for imports).
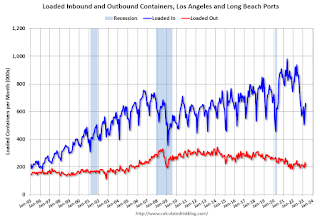 Usually imports peak in the July to October period as retailers import goods for the Christmas holiday, and then decline sharply and bottom in February or March depending on the timing of the Chinese New Year.
 Usually imports peak in the July to October period as retailers import goods for the Christmas holiday, and then decline sharply and bottom in February or March depending on the timing of the Chinese New Year.
Imports were down 23% YoY in April, and exports were down 5% YoY. The volume of containers unloaded last year was much stronger because of all the ships waiting to unload.
It is possible that exports have bottomed after declining for several years (even prior to the pandemic).
Similar Number of Housing Units started in Q1 as 'Built-for-Rent' as 'Built-for-Sale'
by Calculated Risk on 5/19/2023 12:03:00 PM
Today, in the Calculated Risk Real Estate Newsletter: Similar Number of Housing Units started in Q1 as 'Built-for-Rent' as 'Built-for-Sale'
A brief excerpt:
Along with the monthly housing starts report for January last week, the Census Bureau released Housing Units Started by Purpose and Design through Q1 2023.There is much more in the article. You can subscribe at https://calculatedrisk.substack.com/
This graph shows the NSA quarterly intent for four start categories since 1975: single family built for sale, owner built (includes contractor built for owner), starts built for rent, and multi-family built for sale.Single family starts ‘built for sale (red) were down 33% in Q1 2023 compared to Q1 2022. And owner built starts (orange) were down 22% year-over-year. Multi-family ‘built for sale’ decreased and are still low.
The 'units built for rent' (blue) and were up 8% in Q1 2023 compared to Q1 2022. The number of ‘built-for-rent’ units in Q1 was almost the same number as ‘built-for-sale’. Last quarter, Q4 2022, was the first time since this series started in 1974, that there were more units built-for-rent started than single family units built-for-sale started.

Q2 GDP Tracking: Around 2%
by Calculated Risk on 5/19/2023 08:41:00 AM
From BofA:
Overall, this week’s data pushed up our 1Q US GDP tracking estimate up from 0.9% q/q saar to 1.1% q/q saar and kicked off our 2Q GDP tracking estimate at 1.2% q/q saar [May 19th estimate]From Goldman:
emphasis added
We left our Q2 GDP tracking estimate unchanged at +2.0% (qoq ar) and our past-quarter GDP tracking estimate for Q1 unchanged at +1.4%. Our Q2 domestic final sales growth forecast stands at +1.9%. [May 17th estimate]And from the Altanta Fed: GDPNow
The GDPNow model estimate for real GDP growth (seasonally adjusted annual rate) in the second quarter of 2023 is 2.9 percent on May 17, up from 2.6 percent on May 16. After this morning's housing starts report from the US Census Bureau, the nowcast of second-quarter real residential investment growth increased from -6.3 percent to 0.6 percent. [May 17th estimate]
Thursday, May 18, 2023
Friday: Discussion, Fed Chair Jerome Powell and Ben Bernanke
by Calculated Risk on 5/18/2023 08:35:00 PM
 Note: Mortgage rates are from MortgageNewsDaily.com and are for top tier scenarios.
Friday:
• At 10:00 AM ET, State Employment and Unemployment (Monthly) for April 2023
• At 11:00 AM, Discussion, Conversation with Chair Jerome Powell and Ben Bernanke, former Chair of the Board of Governors of the Federal Reserve System
At the Thomas Laubach Research Conference, Washington, D.C.
Hotels: Occupancy Rate Down 2.0% Year-over-year
by Calculated Risk on 5/18/2023 04:01:00 PM
U.S. weekly hotel performance produced mixed year-over-year comparisons, according to STR‘s latest data through 13 May.The following graph shows the seasonal pattern for the hotel occupancy rate using the four-week average.
U.S. weekly hotel performance produced mixed year-over-year comparisons, according to STR‘s latest data through 13 May.
• Occupancy: 65.1% (-2.0%)
• Average daily rate (ADR): US$154.90 (+3.4%)
• Revenue per available room (RevPAR): US$100.81 (+1.3%)
Worsened comparisons than the week prior were expected and normal given seasonal slowing and the negative side of the Mother’s Day calendar shift.
emphasis added
 Click on graph for larger image.
The red line is for 2023, black is 2020, blue is the median, and dashed light blue is for 2022. Dashed purple is for 2018, the record year for hotel occupancy.
The 4-week average of the occupancy rate is slightly above the median rate for the period 2000 through 2020 (Blue).
Note: Y-axis doesn't start at zero to better show the seasonal change.
The 4-week average of the occupancy rate will move mostly sideways until the summer travel season.
Realtor.com Reports Weekly Active Inventory Up 23% YoY; New Listings Down 25% YoY
by Calculated Risk on 5/18/2023 02:09:00 PM
Realtor.com has monthly and weekly data on the existing home market. Here is their weekly report from chief economist Danielle Hale: Weekly Housing Trends View — Data Week Ending May 13, 2023
• Active inventory was up at a slower pace, with for-sale homes up just 23% above one year ago. The number of homes for sale continues to grow, but at a slower pace compared to one year ago.
...
• New listings–a measure of sellers putting homes up for sale–were down again this week, by 25% from one year ago. The number of newly listed homes has been lower than the same time the previous year for the past 45 weeks.
 Here is a graph of the year-over-year change in inventory according to realtor.com.
 Inventory is still up year-over-year - from record lows - however, the YoY increase has slowed sharply recently.
This was the smallest YoY increase since June 2022.
The recent trend suggests active inventory could be down YoY in June or July!
NAR: Existing-Home Sales Decreased to 4.28 million SAAR in April; Median Prices Declined 1.7% YoY
by Calculated Risk on 5/18/2023 10:47:00 AM
Today, in the CalculatedRisk Real Estate Newsletter: NAR: Existing-Home Sales Decreased to 4.28 million SAAR in April; Median Prices Declined 1.7% YoY
Excerpt:
The second graph shows existing home sales by month for 2022 and 2023.There is much more in the article. You can subscribe at https://calculatedrisk.substack.com/ Please subscribe!
Sales declined 23.2% year-over-year compared to April 2022. This was the twentieth consecutive month with sales down year-over-year.

NAR: Existing-Home Sales Decreased to 4.28 million SAAR in April
by Calculated Risk on 5/18/2023 10:13:00 AM
From the NAR: Existing-Home Sales Faded 3.4% in April
Existing-home sales decreased in April, according to the National Association of REALTORS®. All four major U.S. regions registered month-over-month and year-over-year sales declines.
Total existing-home sales – completed transactions that include single-family homes, townhomes, condominiums and co-ops – slid 3.4% from March to a seasonally adjusted annual rate of 4.28 million in April. Year-over-year, sales slumped 23.2% (down from 5.57 million in April 2022).
...
Total housing inventory registered at the end of April was 1.04 million units, up 7.2% from March and 1.0% from one year ago (1.03 million). Unsold inventory sits at a 2.9-month supply at the current sales pace, up from 2.6 months in March and 2.2 months in April 2022.
emphasis added
 Click on graph for larger image.
This graph shows existing home sales, on a Seasonally Adjusted Annual Rate (SAAR) basis since 1994.
Sales in April (4.28 million SAAR) were down 3.4% from the previous month and were 23.2% below the April 2022 sales rate.
The second graph shows nationwide inventory for existing homes.
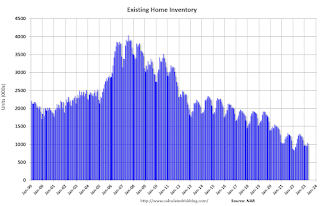 According to the NAR, inventory increased to 1.04 million in April from 0.97 million in March.
 According to the NAR, inventory increased to 1.04 million in April from 0.97 million in March.
Headline inventory is not seasonally adjusted, and inventory usually decreases to the seasonal lows in December and January, and peaks in mid-to-late summer.
The last graph shows the year-over-year (YoY) change in reported existing home inventory and months-of-supply. Since inventory is not seasonally adjusted, it really helps to look at the YoY change. Note: Months-of-supply is based on the seasonally adjusted sales and not seasonally adjusted inventory.
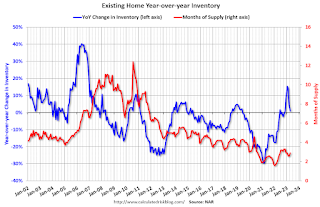 Inventory was up 1.0% year-over-year (blue) in April compared to April 2022.
Months of supply (red) increased to 2.9 months in April from 2.6 months in March.
This was slightly below the consensus forecast. I'll have more later.
The last graph shows the year-over-year (YoY) change in reported existing home inventory and months-of-supply. Since inventory is not seasonally adjusted, it really helps to look at the YoY change. Note: Months-of-supply is based on the seasonally adjusted sales and not seasonally adjusted inventory.
 Inventory was up 1.0% year-over-year (blue) in April compared to April 2022.
 Months of supply (red) increased to 2.9 months in April from 2.6 months in March.
This was slightly below the consensus forecast. I'll have more later.
Weekly Initial Unemployment Claims decrease to 242,000
by Calculated Risk on 5/18/2023 08:33:00 AM
The DOL reported:
In the week ending May 13, the advance figure for seasonally adjusted initial claims was 242,000, a decrease of 22,000 from the previous week's unrevised level of 264,000. The 4-week moving average was 244,250, a decrease of 1,000 from the previous week's unrevised average of 245,250.The following graph shows the 4-week moving average of weekly claims since 1971.
emphasis added
 Click on graph for larger image.
The dashed line on the graph is the current 4-week average. The four-week average of weekly unemployment claims decreased to 244,250.
The previous week was unrevised.
Weekly claims were below the consensus forecast.
Wednesday, May 17, 2023
Thursday: Existing Home Sales, Unemployment Claims, Philly Fed Mfg
by Calculated Risk on 5/17/2023 08:52:00 PM
 Note: Mortgage rates are from MortgageNewsDaily.com and are for top tier scenarios.
Thursday:
• At 8:30 AM ET, The initial weekly unemployment claims report will be released. The consensus is for 253 thousand initial claims, down from 264 thousand last week.
• Aslo at 8:30 AM, the Philly Fed manufacturing survey for May. The consensus is for a reading of -21.1, up from -31.3.
• At 10:00 AM, Existing Home Sales for April from the National Association of Realtors (NAR). The consensus is for 4.30 million SAAR, down from 4.44 million.


