 RSS Feed
 by Calculated Risk on 5/22/2023 08:30:00 AM
Monday, May 22, 2023
Housing May 22nd Weekly Update: Inventory Increased 0.9% Week-over-week
Altos reports that active single-family inventory was up 0.9% week-over-week.
 Click on graph for larger image.
This inventory graph is courtesy of Altos Research.
As of May 19th, inventory was at 424 thousand (7-day average), compared to 420 thousand the prior week.
Year-to-date, inventory is down 13.6%. And inventory is up 4.6% from the seasonal bottom five weeks ago.

The red line is for 2023. The black line is for 2019. Note that inventory is up from the previous two years (the record low was in 2022), but still well below normal levels.
Inventory was up 25.4% compared to the same week in 2022 (last week it was up 34.4%), and down 53.3% compared to the same week in 2019 (last week down 53.1%).
It appears likely inventory will be down year-over-year in June of July.
Mike Simonsen discusses this data regularly on Youtube.
Sunday, May 21, 2023
Sunday Night Futures
by Calculated Risk on 5/21/2023 07:10:00 PM
Weekend:
• Schedule for Week of May 21, 2023
Monday:
• No major economic releases scheduled.
From CNBC: Pre-Market Data and Bloomberg futures S&P 500 are down 8 and DOW futures are down 58 (fair value).
Oil prices were up over the last week with WTI futures at $71.55 per barrel and Brent at $75.58 per barrel. A year ago, WTI was at $113, and Brent was at $114 - so WTI oil prices are down about 37% year-over-year.
Here is a graph from Gasbuddy.com for nationwide gasoline prices. Nationally prices are at $3.52 per gallon. A year ago, prices were at $4.58 per gallon, so gasoline prices are down $1.06 per gallon year-over-year.
The Changing Mix of Light Vehicle Sales
by Calculated Risk on 5/21/2023 09:54:00 AM
The first graph below shows the mix of sales since 1976 (Blue is cars, Red is light trucks and SUVs) through April 2023.

Click on graph for larger image.
The mix has changed significantly. Back in 1976, most light vehicles were passenger cars - however passenger car sales have trended down over time.
Note that the big dips in sales are related to economic recessions (early '80s, early '90s, the Great Recession of 2007 through mid-2009 and the pandemic in 2020).
The second graph shows the percent of light vehicle sales between passenger cars and trucks / SUVs.
 Over time the mix has changed toward more and more light trucks and SUVs. Only when oil prices are high, does the trend slow or reverse.
Currently about 80% of light vehicle sales are light trucks or SUVs.
It is possible EVs will have an impact on the mix.
Saturday, May 20, 2023
Real Estate Newsletter Articles this Week: "Near Record Multi-Family Under Construction"
by Calculated Risk on 5/20/2023 02:11:00 PM
At the Calculated Risk Real Estate Newsletter this week:
• April Housing Starts: Near Record Multi-Family Under Construction
• NAR: Existing-Home Sales Decreased to 4.28 million SAAR in April; Median Prices Declined 1.7% YoY
• Similar Number of Housing Units started in Q1 as 'Built-for-Rent' as 'Built-for-Sale'
• 4th Look at Local Markets in April
• Lawler: Early Read on Existing Home Sales in April
This is usually published 4 to 6 times a week and provides more in-depth analysis of the housing market.
You can subscribe at https://calculatedrisk.substack.com/
Most content is available for free (and no Ads), but please subscribe!
Schedule for Week of May 21, 2023
by Calculated Risk on 5/20/2023 08:11:00 AM
The key reports this week are the second estimate of Q1 GDP, April New Home Sales, and Personal Income and Outlays for April.
For manufacturing, the May Richmond and Kansas City Fed manufacturing surveys will be released.
No major economic releases scheduled.
 10:00 AM: New Home Sales for April from the Census Bureau.
 This graph shows New Home Sales since 1963. The dashed line is the sales rate for last month.
The consensus is for 660 thousand SAAR, down from 683 thousand SAAR in March.
10:00 AM: Richmond Fed Survey of Manufacturing Activity for May.
7:00 AM ET: The Mortgage Bankers Association (MBA) will release the results for the mortgage purchase applications index.
During the day: The AIA's Architecture Billings Index for April (a leading indicator for commercial real estate).
2:00 PM: FOMC Minutes, Minutes Meeting of May 2-3, 2023
8:30 AM: The initial weekly unemployment claims report will be released. The consensus is for 250 thousand initial claims, up from 242 thousand last week.
8:30 AM: Gross Domestic Product, 1st quarter 2023 (Second estimate). The consensus is that real GDP increased 1.1% annualized in Q1, unchanged from the advance estimate of 1.1%.
8:30 AM ET: Chicago Fed National Activity Index for April. This is a composite index of other data.
10:00 AM: Pending Home Sales Index for April. The consensus is for a 0.5% increase in the index.
11:00 AM: the Kansas City Fed manufacturing survey for May.
8:30 AM ET: Personal Income and Outlays, April 2023. The consensus is for a 0.4% increase in personal income, and for a 0.4% increase in personal spending. And for the Core PCE price index to increase 0.3%. PCE prices are expected to be up 4.3% YoY, and core PCE prices up 4.6% YoY.
8:30 AM: Durable Goods Orders for April from the Census Bureau. The consensus is for a 1.1% decrease in durable goods orders.
10:00 AM: University of Michigan's Consumer sentiment index (Final for May). The consensus is for a reading of 57.7.
Friday, May 19, 2023
May 19th COVID Update: New Pandemic Lows for Deaths and Hospitalizations
by Calculated Risk on 5/19/2023 09:01:00 PM
 Note: Mortgage rates are from MortgageNewsDaily.com and are for top tier scenarios.
Due to changes at the CDC, weekly cases are no longer updated.
After the first few weeks, the pandemic low for weekly deaths had been the week of July 7, 2021, at 1,690 deaths (until recently).
For COVID hospitalizations, the previous low was 9,821 (until three weeks ago).
| COVID Metrics | ||||
|---|---|---|---|---|
| Now | Week Ago | Goal | ||
| Hospitalized2 | 8,159 | 8,859 | ≤3,0001 | |
| Deaths per Week2 | 865 | 1,079 | ≤3501 | |
| 1my goals to stop weekly posts, 2Weekly for Cases, Currently Hospitalized, and Deaths 🚩 Increasing number weekly for Hospitalized and Deaths ✅ Goal met. | ||||
 Click on graph for larger image.
This graph shows the weekly (columns) number of deaths reported.
For deaths, I'm currently using 3 weeks ago for "now", since the most recent two weeks will be revised significantly.
LA Port Inbound Traffic Down Sharply YoY in April
by Calculated Risk on 5/19/2023 03:03:00 PM
Notes: The expansion to the Panama Canal was completed in 2016 (As I noted several years ago), and some of the traffic that used the ports of Los Angeles and Long Beach is probably going through the canal. This might be impacting TEUs on the West Coast.
Container traffic gives us an idea about the volume of goods being exported and imported - and usually some hints about the trade report since LA area ports handle about 40% of the nation's container port traffic.
The following graphs are for inbound and outbound traffic at the ports of Los Angeles and Long Beach in TEUs (TEUs: 20-foot equivalent units or 20-foot-long cargo container).
To remove the strong seasonal component for inbound traffic, the first graph shows the rolling 12-month average.
 Click on graph for larger image.
On a rolling 12-month basis, inbound traffic decreased 2.4% in April compared to the rolling 12 months ending in March. Outbound traffic decreased 0.4% compared to the rolling 12 months ending the previous month.
The 2nd graph is the monthly data (with a strong seasonal pattern for imports).
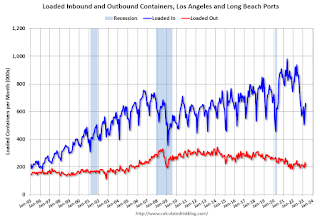 Usually imports peak in the July to October period as retailers import goods for the Christmas holiday, and then decline sharply and bottom in February or March depending on the timing of the Chinese New Year.
 Usually imports peak in the July to October period as retailers import goods for the Christmas holiday, and then decline sharply and bottom in February or March depending on the timing of the Chinese New Year.
Imports were down 23% YoY in April, and exports were down 5% YoY. The volume of containers unloaded last year was much stronger because of all the ships waiting to unload.
It is possible that exports have bottomed after declining for several years (even prior to the pandemic).
Similar Number of Housing Units started in Q1 as 'Built-for-Rent' as 'Built-for-Sale'
by Calculated Risk on 5/19/2023 12:03:00 PM
Today, in the Calculated Risk Real Estate Newsletter: Similar Number of Housing Units started in Q1 as 'Built-for-Rent' as 'Built-for-Sale'
A brief excerpt:
Along with the monthly housing starts report for January last week, the Census Bureau released Housing Units Started by Purpose and Design through Q1 2023.There is much more in the article. You can subscribe at https://calculatedrisk.substack.com/
This graph shows the NSA quarterly intent for four start categories since 1975: single family built for sale, owner built (includes contractor built for owner), starts built for rent, and multi-family built for sale.Single family starts ‘built for sale (red) were down 33% in Q1 2023 compared to Q1 2022. And owner built starts (orange) were down 22% year-over-year. Multi-family ‘built for sale’ decreased and are still low.
The 'units built for rent' (blue) and were up 8% in Q1 2023 compared to Q1 2022. The number of ‘built-for-rent’ units in Q1 was almost the same number as ‘built-for-sale’. Last quarter, Q4 2022, was the first time since this series started in 1974, that there were more units built-for-rent started than single family units built-for-sale started.

Q2 GDP Tracking: Around 2%
by Calculated Risk on 5/19/2023 08:41:00 AM
From BofA:
Overall, this week’s data pushed up our 1Q US GDP tracking estimate up from 0.9% q/q saar to 1.1% q/q saar and kicked off our 2Q GDP tracking estimate at 1.2% q/q saar [May 19th estimate]From Goldman:
emphasis added
We left our Q2 GDP tracking estimate unchanged at +2.0% (qoq ar) and our past-quarter GDP tracking estimate for Q1 unchanged at +1.4%. Our Q2 domestic final sales growth forecast stands at +1.9%. [May 17th estimate]And from the Altanta Fed: GDPNow
The GDPNow model estimate for real GDP growth (seasonally adjusted annual rate) in the second quarter of 2023 is 2.9 percent on May 17, up from 2.6 percent on May 16. After this morning's housing starts report from the US Census Bureau, the nowcast of second-quarter real residential investment growth increased from -6.3 percent to 0.6 percent. [May 17th estimate]
Thursday, May 18, 2023
Friday: Discussion, Fed Chair Jerome Powell and Ben Bernanke
by Calculated Risk on 5/18/2023 08:35:00 PM
 Note: Mortgage rates are from MortgageNewsDaily.com and are for top tier scenarios.
Friday:
• At 10:00 AM ET, State Employment and Unemployment (Monthly) for April 2023
• At 11:00 AM, Discussion, Conversation with Chair Jerome Powell and Ben Bernanke, former Chair of the Board of Governors of the Federal Reserve System
At the Thomas Laubach Research Conference, Washington, D.C.


