 RSS Feed
 by Calculated Risk on 3/26/2023 10:52:00 AM
Sunday, March 26, 2023
Fed: Q4 2022 Household Debt Service Ratio Still Low
The Fed's Household Debt Service ratio through Q4 2022 was released last week: Household Debt Service and Financial Obligations Ratios. I used to track this quarterly back in 2005 and 2006 to point out that households were taking on excessive financial obligations.
These ratios show the percent of disposable personal income (DPI) dedicated to debt service (DSR) and financial obligations (FOR) for households. Note: The Fed changed the release in Q3 2013.
The household Debt Service Ratio (DSR) is the ratio of total required household debt payments to total disposable income.This data has limited value in terms of absolute numbers, but is useful in looking at trends. Here is a discussion from the Fed:
The DSR is divided into two parts. The Mortgage DSR is total quarterly required mortgage payments divided by total quarterly disposable personal income. The Consumer DSR is total quarterly scheduled consumer debt payments divided by total quarterly disposable personal income. The Mortgage DSR and the Consumer DSR sum to the DSR.
The limitations of current sources of data make the calculation of the ratio especially difficult. The ideal data set for such a calculation would have the required payments on every loan held by every household in the United States. Such a data set is not available, and thus the calculated series is only an approximation of the debt service ratio faced by households. Nonetheless, this approximation is useful to the extent that, by using the same method and data series over time, it generates a time series that captures the important changes in the household debt service burden.
 Click on graph for larger image.
The graph shows the Total Debt Service Ratio (DSR), and the DSR for mortgages (blue) and consumer debt (yellow).
The Household debt service ratio was at 13.2% in 2007 and has fallen to under 10% now, and the DSR for mortgages (blue) are near the lowest level for the last 35 years.
This data suggests aggregate household cash flow is in a solid position.
Saturday, March 25, 2023
Real Estate Newsletter Articles this Week: "Median Existing Home Prices Declined YoY"
by Calculated Risk on 3/25/2023 02:11:00 PM
At the Calculated Risk Real Estate Newsletter this week:
• NAR: Existing-Home Sales Increased to 4.58 million SAAR in February; Median Prices Declined YoY
• New Home Sales at 640,000 Annual Rate in February
• Final Look at Local Housing Markets in February
• House Prices: Rust or Bust?
• More Good News for Homebuilders
This is usually published 4 to 6 times a week and provides more in-depth analysis of the housing market.
You can subscribe at https://calculatedrisk.substack.com/
Most content is available for free (and no Ads), but please subscribe!
Schedule for Week of March 26, 2023
by Calculated Risk on 3/25/2023 08:11:00 AM
The key reports scheduled for this week include the 3rd estimate of Q4 GDP, February Personal Income & Outlays, and January Case-Shiller house prices.
For manufacturing, the March Dallas and Richmond Fed surveys will be released.
10:30 AM: Dallas Fed Survey of Manufacturing Activity for March.
 9:00 AM: S&P/Case-Shiller House Price Index for January.
This graph shows the year-over-year change for the Case-Shiller National, Composite 10 and Composite 20 indexes, through the most recent report (the Composite 20 was started in January 2000).
The consensus is for a 2.5% year-over-year increase in the Comp 20 index for January, down from 4.6% YoY in December.
9:00 AM: FHFA House Price Index for January 2021. This was originally a GSE only repeat sales, however there is also an expanded index.
10:00 AM: Richmond Fed Survey of Manufacturing Activity for March. This is the last of the regional surveys for March.
7:00 AM ET: The Mortgage Bankers Association (MBA) will release the results for the mortgage purchase applications index.
10:00 AM: Pending Home Sales Index for February. The consensus is for a 3.0% decrease in the index.
8:30 AM, Gross Domestic Product, 4th Quarter and Year 2022 (Third Estimate), GDP by Industry, and Corporate Profits. The consensus is that real GDP increased 2.7% annualized in Q4, unchanged from the second estimate.
8:30 AM: The initial weekly unemployment claims report will be released. The consensus is for 196 thousand initial claims, up from 191 thousand last week.
8:30 AM ET: Personal Income and Outlays for February. The consensus is for a 0.3% increase in personal income, and for a 0.3% increase in personal spending. And for the Core PCE price index to increase 0.4%. PCE prices are expected to be up 5.1% YoY, and core PCE prices up 4.7% YoY.
9:45 AM: Chicago Purchasing Managers Index for March. The consensus is for a reading of 43.6, unchanged from 43.6 in February.
10:00 AM: University of Michigan's Consumer sentiment index (Final for March). The consensus is for a reading of 63.4.
Friday, March 24, 2023
COVID Mar 24, 2023: Update on Cases, Hospitalizations and Deaths
by Calculated Risk on 3/24/2023 09:21:00 PM
 Note: Mortgage rates are from MortgageNewsDaily.com and are for top tier scenarios.
On COVID (focus on hospitalizations and deaths). Data is now weekly.
| COVID Metrics | ||||
|---|---|---|---|---|
| Now | Week Ago | Goal | ||
| New Cases per Week2 | 133,521 | 153,183 | ≤35,0001 | |
| Hospitalized2 | 15,705 | 17,594 | ≤3,0001 | |
| Deaths per Week2🚩 | 2,060 | 1,753 | ≤3501 | |
| 1my goals to stop weekly posts, 2Weekly for Cases, Currently Hospitalized, and Deaths 🚩 Increasing number weekly for Cases, Hospitalized, and Deaths ✅ Goal met. | ||||
 Click on graph for larger image.
This graph shows the weekly (columns) number of deaths reported.
After the first few weeks, the pandemic low for weekly deaths was the week of July 7, 2021, at 1,690 deaths. For cases, the low was 82,186.
For hospitalizations, the low was 9,821.
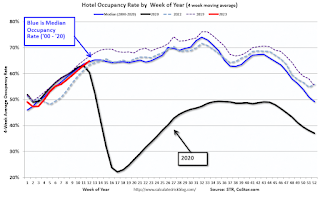
Hotels: Occupancy Rate Down 2.5% Compared to Same Week in 2019
by Calculated Risk on 3/24/2023 03:01:00 PM
Helped by spring break travel, U.S. hotel performance increased from the previous week, according to STR‘s latest data through 18 March.The following graph shows the seasonal pattern for the hotel occupancy rate using the four-week average.
March 12-18, 2023 (percentage change from comparable weeks in 2022, 2019):
• Occupancy: 67.6% (+1.3%, -2.5%)
• Average daily rate (ADR): $167.04 (+8.9%, +23.9%)
• Revenue per available room (RevPAR): $112.89 (+10.4%, +20.8%)
emphasis added
NOTE: Last year, the occupancy rate was close to normal after the first quarter (depressed due to a surge in COVID), so STR will only be comparing to 2022 after Q1.
 Click on graph for larger image.
The red line is for 2023, black is 2020, blue is the median, and dashed light blue is for 2022. Dashed purple is 2019 (STR is comparing to a strong year for hotels).
 Click on graph for larger image.
The red line is for 2023, black is 2020, blue is the median, and dashed light blue is for 2022. Dashed purple is 2019 (STR is comparing to a strong year for hotels).
The 4-week average of the occupancy rate is close to the median rate for the previous 20 years (Blue).
Note: Y-axis doesn't start at zero to better show the seasonal change.
The 4-week average of the occupancy rate will move more sideways until the Summer.
Q1 GDP Tracking: Wide Range
by Calculated Risk on 3/24/2023 01:24:00 PM
Note: The FOMC is projecting Q4-over-Q4 GDP growth of 0.0% to 0.8%. Here is a table of the low, middle and high FOMC projections for Q2 through Q4 based on the GDP tracking estimates below for Q1.
| Estimated FOMC Projection Q2 - Q4 | ||||
|---|---|---|---|---|
| Q1 | Low 0.0% | Middle 0.4% | High 0.8% | |
| BofA | 0.8% | -0.3% | 0.3% | 0.8% |
| Goldman | 2.4% | -0.8% | -0.3% | 0.3% |
| GDPNow | 3.2% | -1.0% | -0.5% | 0.0% |
Based on the GDP tracking estimates, the FOMC's GDP projection for Q4-over-Q4 and the FOMC unemployment projections, many analysts pointed out that the FOMC is essentially projecting a recession in the 2nd half of 2023.
From BofA:
Core capital orders and shipments in February came in lower than expected at 0.2% m/m and 0.0% m/m, respectively. This modestly reduced our tracking estimate for equipment spending in 1Q. Inventories for nondurable goods also came in lower in February, thereby reducing our inventory tracking estimate. On net, this decreased our 1Q US GDP tracking estimate from 1.0% q/q saar to 0.8% q/q saar. [Mar 24th estimate]From Goldman:
emphasis added
Durable goods orders declined against consensus expectations for a small increase, while core capital goods orders edged higher. The report covers February activity and therefore predates the recent banking stresses. The capex shipments details of the durable goods report were weaker than our previous assumptions. We lowered our Q1 GDP tracking estimate by two tenths to +2.4% (qoq ar) and our domestic final sales growth estimate by 0.1pp to +2.9%. [Mar 24th estimate]And from the Altanta Fed: GDPNow
The GDPNow model estimate for real GDP growth (seasonally adjusted annual rate) in the first quarter of 2023 is 3.2 percent on March 24, unchanged from March 16 after rounding. An increase in the nowcast of GDP growth from 3.2 percent to 3.5 percent following the March 21 existing-home sales release from the National Association of Realtors was reversed after this morning’s advance manufacturing report from the US Census Bureau. [Mar 24th estimate]
Final Look at Local Housing Markets in February
by Calculated Risk on 3/24/2023 10:10:00 AM
Today, in the Calculated Risk Real Estate Newsletter: Final Look at Local Housing Markets in February
A brief excerpt:
The big story for February existing home sales was the sharp year-over-year (YoY) decline in sales, and also the rebound from the low level of sales in December and January. Also, active inventory increased sharply YoY, but is still historically low - and new listings are down YoY.There is much more in the article. You can subscribe at https://calculatedrisk.substack.com/
This is the final look at local markets in February. I’m tracking about 40 local housing markets in the US. Some of the 40 markets are states, and some are metropolitan areas. I update these tables throughout each month as additional data is released.
First, here is a table comparing the year-over-year Not Seasonally Adjusted (NSA) declines in sales this year from the National Association of Realtors® (NAR) with the local markets I track. So far, these measures have tracked closely. The NAR reported sales were down 23.0% NSA YoY in February.
...
Note: Even if existing home sales activity bottomed in December (4.03 million SA) and January (4.00 million SA), there are usually two bottoms for housing - the first for activity and the second for prices. See Has Housing "Bottomed"?
My early expectation is we will see a similar YoY sales decline in March as in February, since mortgage rates for contracts signed in January and February were about the same level as contracts that closed in February.
More local data coming in April for activity in March!

Realtor.com Reports Weekly Active Inventory Up 59% YoY; New Listings Down 20% YoY
by Calculated Risk on 3/24/2023 08:33:00 AM
Realtor.com has monthly and weekly data on the existing home market. Here is their weekly report released yesterday from Sabrina Speianu: Weekly Housing Trends View — Data Week Ending Mar 18, 2023
• Active inventory growth continued to climb with for-sale homes up 59% above one year ago. Inventories of for-sale homes rose, but at a slightly slower pace than last week’s gain, as new sellers on the market held back more. With a lack of newly listed homes compared to the same time last year, growth in the number of homes for sale is driven by longer time on market. However, it is important to note that this time last year, time on market was near all-time lows.
...
• New listings–a measure of sellers putting homes up for sale–were again down, this week by 20% from one year ago. For 37 weeks, fewer homeowners put their homes on the market for sale than at the same time a year prior. This week’s gap was larger than last week’s, and the lack of new sellers continues to be a drag on existing home sales, which declined by 22.8% compared to February of last year, according to the National Association of Realtors..
 Here is a graph of the year-over-year change in inventory according to realtor.com.
 Inventory is still up sharply year-over-year - from record lows - however, the YoY increase has slowed recently.
Thursday, March 23, 2023
Friday: Durable Goods
by Calculated Risk on 3/23/2023 09:04:00 PM
 Note: Mortgage rates are from MortgageNewsDaily.com and are for top tier scenarios.
Friday:
• At 8:30 AM ET, Durable Goods Orders for February from the Census Bureau. The consensus is for a 1.2% increase in durable goods orders.
• At 10:00 AM, State Employment and Unemployment (Monthly), February 2023
Vehicle Sales Forecast: Vehicle Sales to be up Year-over-year in March
by Calculated Risk on 3/23/2023 04:02:00 PM
From WardsAuto: March U.S. Light-Vehicle Sales, Inventory Pegged for Solid Gains; First-Quarter Deliveries to Rise 7% (pay content). Brief excerpt:
Though gradually improving, inventory remains the story behind why sales remain low by historical standards. There are underlying crosscurrents related to the economy, rising interest rates and geopolitics, among others, that are helping stanch demand, but lack of inventory is the main reason growth is not significantly stronger (and even largely why prices are stuck at elevated levels - though that headwind is lessening as inventory rises).
emphasis added
 Click on graph for larger image.
This graph shows actual sales from the BEA (Blue), and Wards forecast for March (Red).
The Wards forecast of 14.4 million SAAR, would be down 3% from last month, and up 6.2% from a year ago.
Vehicle sales are usually a transmission mechanism for Federal Open Market Committee (FOMC) policy, although far behind housing. This time vehicle sales have been more suppressed by supply chain issues but have picked up recently.


