 RSS Feed
 by Calculated Risk on 3/22/2023 09:05:00 PM
Wednesday, March 22, 2023
Thursday: New Home Sales, Unemployment Claims
 Note: Mortgage rates are from MortgageNewsDaily.com and are for top tier scenarios.
Thursday:
• At 8:30 AM ET, The initial weekly unemployment claims report will be released. The consensus is for 190 thousand initial claims, down from 192 thousand last week.
• At 8:30 AM, Chicago Fed National Activity Index for February. This is a composite index of other data.
• At 10:00 AM, New Home Sales for February from the Census Bureau. The consensus is for 650 thousand SAAR, down from 670 thousand in January.
• At 11:00 AM, the Kansas City Fed manufacturing survey for March.
FOMC Projections and Press Conference
by Calculated Risk on 3/22/2023 02:09:00 PM
Statement here.
Fed Chair Powell press conference video here or on YouTube here, starting at 2:30 PM ET.
Here are the projections. In December, the FOMC participants’ midpoint of the target level for the federal funds rate was 5.125%. The FOMC participants’ midpoint of the target range is now somewhat above 5.125%.
Current Wall Street GDP tracking estimates show decent growth in Q1 (although there is a wide range of estimates). GDP projections for 2023 were revised down, contrary to recent data.
| GDP projections of Federal Reserve Governors and Reserve Bank presidents, Change in Real GDP1 | ||||
|---|---|---|---|---|
| Projection Date | 2023 | 2024 | 2025 | |
| Mar 2023 | 0.0 to 0.8 | 1.0 to 1.5 | 1.7 to 2.1 | |
| Dec 2022 | 0.4 to 1.0 | 1.3 to 2.0 | 1.6 to 2.0 | |
The unemployment rate was at 3.6% in February, just above the 50-year low. The FOMC revised down slightly their projected unemployment rate for Q4 2023.
| Unemployment projections of Federal Reserve Governors and Reserve Bank presidents, Unemployment Rate2 | ||||
|---|---|---|---|---|
| Projection Date | 2023 | 2024 | 2025 | |
| Mar 2023 | 4.0 to 4.7 | 4.3 to 4.9 | 4.3 to 4.8 | |
| Dec 2022 | 4.4 to 4.7 | 4.3 to 4.8 | 4.0 to 4.7 | |
As of January 2023, PCE inflation was up 5.4% year-over-year from January 2022, and, in general, inflation has been close to expectations. However, after accounting for the unusual dynamics related to the pandemic, inflation is likely lower than expected. The FOMC revised up their PCE inflation projections.
| Inflation projections of Federal Reserve Governors and Reserve Bank presidents, PCE Inflation1 | ||||
|---|---|---|---|---|
| Projection Date | 2023 | 2024 | 2025 | |
| Mar 2023 | 3.0 to 3.8 | 2.2 to 2.8 | 2.0 to 2.2 | |
| Dec 2022 | 2.9 to 3.5 | 2.3 to 2.7 | 2.0 to 2.2 | |
PCE core inflation was up 4.7% in January year-over-year. The FOMC revised up their core PCE projections.
| Core Inflation projections of Federal Reserve Governors and Reserve Bank presidents, Core Inflation1 | ||||
|---|---|---|---|---|
| Projection Date | 2023 | 2024 | 2025 | |
| Mar 2023 | 3.5 to 3.9 | 2.3 to 2.8 | 2.0 to 2.2 | |
| Dec 2022 | 3.2 to 3.7 | 2.3 to 2.7 | 2.0 to 2.2 | |
FOMC Statement: Raise Rates 25 bp; "some additional policy firming may be appropriate"
by Calculated Risk on 3/22/2023 02:02:00 PM
Fed Chair Powell press conference video here or on YouTube here, starting at 2:30 PM ET.
FOMC Statement:
Recent indicators point to modest growth in spending and production. Job gains have picked up in recent months and are running at a robust pace; the unemployment rate has remained low. Inflation remains elevated.
The U.S. banking system is sound and resilient. Recent developments are likely to result in tighter credit conditions for households and businesses and to weigh on economic activity, hiring, and inflation. The extent of these effects is uncertain. The Committee remains highly attentive to inflation risks.
The Committee seeks to achieve maximum employment and inflation at the rate of 2 percent over the longer run. In support of these goals, the Committee decided to raise the target range for the federal funds rate to 4-3/4 to 5 percent. The Committee will closely monitor incoming information and assess the implications for monetary policy. The Committee anticipates that some additional policy firming may be appropriate in order to attain a stance of monetary policy that is sufficiently restrictive to return inflation to 2 percent over time. In determining the extent of future increases in the target range, the Committee will take into account the cumulative tightening of monetary policy, the lags with which monetary policy affects economic activity and inflation, and economic and financial developments. In addition, the Committee will continue reducing its holdings of Treasury securities and agency debt and agency mortgage-backed securities, as described in its previously announced plans. The Committee is strongly committed to returning inflation to its 2 percent objective.
In assessing the appropriate stance of monetary policy, the Committee will continue to monitor the implications of incoming information for the economic outlook. The Committee would be prepared to adjust the stance of monetary policy as appropriate if risks emerge that could impede the attainment of the Committee's goals. The Committee's assessments will take into account a wide range of information, including readings on labor market conditions, inflation pressures and inflation expectations, and financial and international developments.
Voting for the monetary policy action were Jerome H. Powell, Chair; John C. Williams, Vice Chair; Michael S. Barr; Michelle W. Bowman; Lisa D. Cook; Austan D. Goolsbee; Patrick Harker; Philip N. Jefferson; Neel Kashkari; Lorie K. Logan; and Christopher J. Waller.
emphasis added
AIA: Architecture Billings "Slowdown Continues" in February
by Calculated Risk on 3/22/2023 11:09:00 AM
Note: This index is a leading indicator primarily for new Commercial Real Estate (CRE) investment.
From the AIA: Architecture Billings Index (ABI) Slowdown Continues into February
More architecture firms reported a decline in billings in February, indicating an extension of a recent downturn in design activity according to a new report released today from The American Institute of Architects (AIA).
The combination of an unsettled economy and high interest rates is causing investors and property owners to take a closer look at their plans for construction projects,” said AIA Chief Economist, Kermit Baker, Hon. AIA, PhD. “While this is producing delays for some projects under design, architecture firms are reporting that prospects for future project work remain generally positive.”
...
• Regional averages: West (50.4); Midwest (48.8); Northeast (48.4); South (47.3)
• Sector index breakdown: mixed practice (57.0); institutional (46.9); commercial/industrial (45.8); multi-family residential (46.2)
emphasis added
 Click on graph for larger image.
This graph shows the Architecture Billings Index since 1996. The index was at 48.0 in February, down from 49.3 in January. Anything below 50 indicates contraction in demand for architects' services.
Note: This includes commercial and industrial facilities like hotels and office buildings, multi-family residential, as well as schools, hospitals and other institutions.
This index had been positive for 20 consecutive months but indicated a decline the last five months. This index usually leads CRE investment by 9 to 12 months, so this index suggests a pickup in CRE investment in early 2023, but a slowdown in CRE investment later in 2023.
Note that multi-family billing turned down in August 2022 and has been negative for seven consecutive months. This suggests we will see a downturn in multi-family starts this year.
MBA: Mortgage Purchase Applications Increased in Weekly Survey
by Calculated Risk on 3/22/2023 07:00:00 AM
From the MBA: Mortgage Applications Increase in Latest MBA Weekly Survey
— Mortgage applications increased 3.0 percent from one week earlier, according to data from the Mortgage Bankers Association’s (MBA) Weekly Mortgage Applications Survey for the week ending March 17, 2023.
The Market Composite Index, a measure of mortgage loan application volume, increased 3.0 percent on a seasonally adjusted basis from one week earlier. On an unadjusted basis, the Index increased 3 percent compared with the previous week. The Refinance Index increased 5 percent from the previous week and was 68 percent lower than the same week one year ago. The seasonally adjusted Purchase Index increased 2 percent from one week earlier. The unadjusted Purchase Index increased 3 percent compared with the previous week and was 36 percent lower than the same week one year ago.
"Treasury yields declined last week, driven by uncertainty over the health of the banking sector and worries about the broader impact on the economy. Mortgage rates declined for the second week in a row, with the 30-year fixed rate dropping to 6.48 percent, the lowest level in a month,” said Joel Kan, MBA’s Vice President and Deputy Chief Economist. “However, mortgage rates have not dropped as much as Treasury rates due to increased MBS market volatility. The spread between the 30-year fixed and 10-year Treasury remained wide at around 300 basis points, compared to a more typical spread of 180 basis points.”
Added Kan, “Both purchase and refinance applications increased for the third week in a row as borrowers took the opportunity to act, even though overall application volume remains at relatively low levels.”
..
The average contract interest rate for 30-year fixed-rate mortgages with conforming loan balances ($726,200 or less) decreased to 6.48 percent from 6.71 percent, with points decreasing to 0.66 from 0.79 (including the origination fee) for 80 percent loan-to-value ratio (LTV) loans.
emphasis added
 Click on graph for larger image.
The first graph shows the refinance index since 1990.
With higher mortgage rates, the refinance index declined sharply in 2022.
The second graph shows the MBA mortgage purchase index.
 According to the MBA, purchase activity is down 36% year-over-year unadjusted.
 Red is a four-week average (blue is weekly).
Tuesday, March 21, 2023
Wednesday: FOMC Announcement
by Calculated Risk on 3/21/2023 09:01:00 PM
 Note: Mortgage rates are from MortgageNewsDaily.com and are for top tier scenarios.
Wednesday:
• At 7:00 AM ET, The Mortgage Bankers Association (MBA) will release the results for the mortgage purchase applications index.
• During the day: The AIA's Architecture Billings Index for February (a leading indicator for commercial real estate).
• At 2:00 PM, FOMC Meeting Announcement. The FOMC is expected to raise the Fed Funds rate by 25bps at this meeting, although there is some uncertainty due to the bank issues.
• At 2:00 PM, FOMC Projections. This will include the Federal Open Market Committee (FOMC) participants' projections of the appropriate target federal funds rate along with updated economic projections.
• At 2:30 PM, Fed Chair Jerome Powell holds a press briefing following the FOMC announcement.
Goldman: Seasonally Adjusted Median Prices Down 4.2% from Peak
by Calculated Risk on 3/21/2023 03:56:00 PM
Earlier, in the CalculatedRisk Real Estate Newsletter on February existing home sales, NAR: Existing-Home Sales Increased to 4.58 million SAAR in February; Median Prices Declined YoY, I mentioned that the median price was up 0.5% Not Seasonally Adjusted (NSA) from January 2023.
Goldman Sachs economists estimated the seasonally adjusted (SA) month-over-month change was down 0.5%, and that median prices were down 4.2% SA from the peak:
"The median sales price of all existing homes declined 0.5% month-over-month (sa by GS), corresponding to a year-over-year rate of -0.2%, and are now cumulatively down 4.2% from the May 2022 peak."Below is a table of the seasonal changes from annual peak to the following February over the last several years (all prices Not Seasonally Adjusted, NSA).
Seasonally prices typically peak in June (closed sales for contracts signed mostly in April and May).
| 2018 | 2019 | 2020 | 2021 | 2022 | |
|---|---|---|---|---|---|
| Peak Month | June | June | Oct | June | June |
| To following Feb | -8.7% | -5.3% | -0.8% | -0.9% | -12.3% |
In 2020, prices increased late into the year and only declined slightly seasonally (the start of the pandemic buying boom), and in 2021, median prices only declined slightly from June to the following February.
But the decline from the 2022 peak to February 2023 of 12.3% is larger than in the pre-pandemic years. And we will probably see further price weaknesses.
Last year, median prices increased 4.3% in March, 4.3% in April and 3.3% in May, all NSA.
Median prices will likely increase less month-to-month this year - for the next 3 months - and that will push the year-over-year change further negative.
NAR: Existing-Home Sales Increased to 4.58 million SAAR in February; Median Prices Declined YoY
by Calculated Risk on 3/21/2023 10:49:00 AM
Today, in the CalculatedRisk Real Estate Newsletter: NAR: Existing-Home Sales Increased to 4.58 million SAAR in February; Median Prices Declined YoY
Excerpt:
On prices, the NAR reported:There is much more in the article. You can subscribe at https://calculatedrisk.substack.com/ Please subscribe!The median existing-home price for all housing types in January was $363,000, a decline of 0.2% from February 2022 ($363,700), as prices climbed in the Midwest and South yet waned in the Northeast and West. This ends a streak of 131 consecutive months of year-over-year increases, the longest on record.Median prices are distorted by the mix (repeat sales indexes like Case-Shiller and FHFA are probably better for measuring prices).
The YoY change in the median price peaked at 25.2% in May 2021 and prices are now down 0.2% YoY. Median house prices increased 0.5% from January to February and have declined 12.3% from the peak in June 2022 (NSA).
It is likely the Case-Shiller index will be down soon year-over-year.
Note that closed sales in February were mostly for contracts signed in December and January. Mortgage rates, according to the Freddie Mac PMMS, decreased to around 6.4% in December and 6.3% in January, and that provided a boost to closed sales in February. March sales will be for contracts signed in January and February, and mortgage rates averaged 6.3% in February too (spiking at the end of the month), so the impact from the recent increase in rates won’t happen until the April or May report.

NAR: Existing-Home Sales Increased to 4.58 million SAAR in February
by Calculated Risk on 3/21/2023 10:11:00 AM
From the NAR: Existing-Home Sales Surged 14.5% in February, Ending 12-Month Streak of Declines
Existing-home sales reversed a 12-month slide in February, registering the largest monthly percentage increase since July 2020, according to the National Association of REALTORS®. Month-over-month sales rose in all four major U.S. regions. All regions posted year-over-year declines.
Total existing-home sales, completed transactions that include single-family homes, townhomes, condominiums and co-ops – vaulted 14.5% from January to a seasonally adjusted annual rate of 4.58 million in February. Year-over-year, sales fell 22.6% (down from 5.92 million in February 2022).
...
Total housing inventory registered at the end of February was 980,000 units, identical to January and up 15.3% from one year ago (850,000). Unsold inventory sits at a 2.6-month supply at the current sales pace, down 10.3% from January but up from 1.7 months in February 2022.
emphasis added
 Click on graph for larger image.
This graph shows existing home sales, on a Seasonally Adjusted Annual Rate (SAAR) basis since 1993.
Sales in February (4.58 million SAAR) were up 14.5% from the previous month and were 22.6% below the February 2022 sales rate.
The second graph shows nationwide inventory for existing homes.
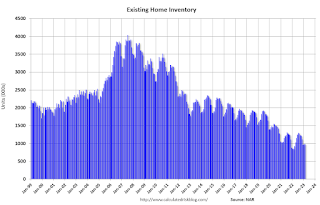 According to the NAR, inventory was unchanged at 0.98 million in February from 0.98 million in January.
 According to the NAR, inventory was unchanged at 0.98 million in February from 0.98 million in January.
Headline inventory is not seasonally adjusted, and inventory usually decreases to the seasonal lows in December and January, and peaks in mid-to-late summer.
The last graph shows the year-over-year (YoY) change in reported existing home inventory and months-of-supply. Since inventory is not seasonally adjusted, it really helps to look at the YoY change. Note: Months-of-supply is based on the seasonally adjusted sales and not seasonally adjusted inventory.
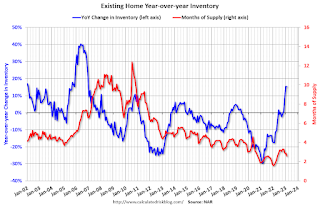 Inventory was up 15.3% year-over-year (blue) in February compared to February 2022.
Months of supply (red) declined to 2.6 months in February from 2.9 months in January.
This was well above the consensus forecast (but at Lawler's projection). I'll have more later.
The last graph shows the year-over-year (YoY) change in reported existing home inventory and months-of-supply. Since inventory is not seasonally adjusted, it really helps to look at the YoY change. Note: Months-of-supply is based on the seasonally adjusted sales and not seasonally adjusted inventory.
 Inventory was up 15.3% year-over-year (blue) in February compared to February 2022.
 Months of supply (red) declined to 2.6 months in February from 2.9 months in January.
This was well above the consensus forecast (but at Lawler's projection). I'll have more later.
Monday, March 20, 2023
Tuesday: Existing Home Sales
by Calculated Risk on 3/20/2023 09:01:00 PM
 From Matthew Graham at Mortgage News Daily: How to Make Sense of Mortgage Rate Info These Days
Shifting gears to today's MOVEMENT (since that what matters after all), rates are HIGHER today than they were on Friday. Most lenders ended up raising rates during the business day in response to bond market losses. In terms of 30yr fixed rates, the average lender ended up about an eighth of a percent (.125) higher compared to Friday morning. [30 year fixed 6.67%]Tuesday:
emphasis added
• At 10:00 AM: Existing Home Sales for February from the National Association of Realtors (NAR). The consensus is for 4.15 million SAAR, up from 4.00 million. Housing economist Tom Lawler expects the NAR to report sales of 4.51 million SAAR for February (well above consensus).


