 RSS Feed
 by Calculated Risk on 3/20/2023 05:10:00 PM
Monday, March 20, 2023
MBA Survey: "Share of Mortgage Loans in Forbearance Decreases to 0.60% in February"
From the MBA: Share of Mortgage Loans in Forbearance Decreases to 0.60% in February
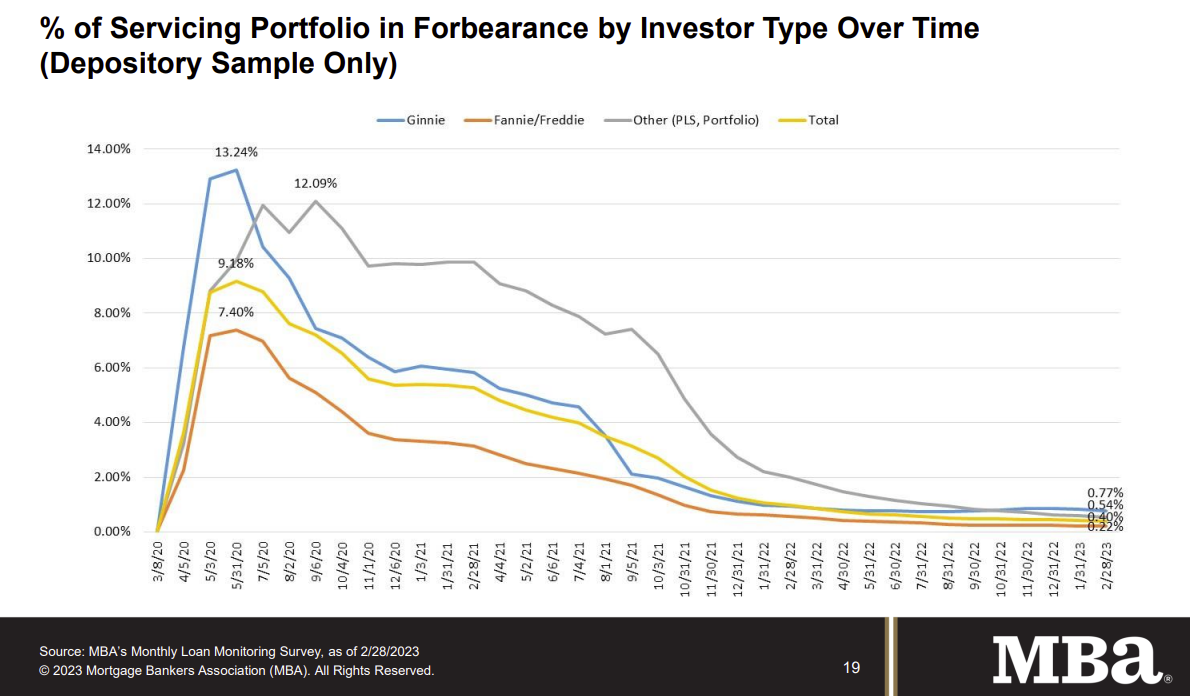
The Mortgage Bankers Association’s (MBA) monthly Loan Monitoring Survey revealed that the total number of loans now in forbearance decreased by 4 basis points from 0.64% of servicers’ portfolio volume in the prior month to 0.60% as of February 28, 2023. According to MBA’s estimate, 300,000 homeowners are in forbearance plans.
The share of Fannie Mae and Freddie Mac loans in forbearance decreased 2 basis points to 0.28%. Ginnie Mae loans in forbearance decreased 9 basis points to 1.28%, and the forbearance share for portfolio loans and private-label securities (PLS) decreased 5 basis points to 0.78%.
“The forbearance rate decreased for both independent mortgage bank and depository servicers across all investor types in February,” said Marina Walsh, CMB, MBA’s Vice President of Industry Analysis. “Even with the fewer days in the month – which often causes a drop in timely monthly payments – overall servicing portfolio performance declined only slightly to 95.8 percent, while performance of post-forbearance workouts stayed essentially flat at 76.0 percent.”
Added Walsh, “The February results on mortgage performance is welcome news, given recent increases in delinquencies for other credit types such as credit cards and auto loans. However, with the possibility of a recession this year, we may see some deterioration in performance – particularly for government loans.”
emphasis added
 Click on graph for larger image.
This graph shows the percent of portfolio in forbearance by investor type over time.
The share of forbearance plans has been decreasing, declined to 0.60% in February from 0.64% in January.
At the end of February, there were about 300,000 homeowners in forbearance plans.
First House Price Index goes Negative Year-over-year
by Calculated Risk on 3/20/2023 02:55:00 PM
This is for asking prices of a "common" home. Haus released their weekly Common Haus Price Index (CHPI) today showing a 0.2% decrease in asking house prices year-over-year.
From Common Haus Price Index (CHPI) at Haus: The weekly Common Haus Price Index
Each week, Haus releases the Common Haus Price Index (CHPI), a home price index of asking prices for the most common American home: a three-bed, two-bath, 1,500-square-foot home built in 1977 on a quarter-acre lot.As I mentioned this morning, it is possible that the NAR will report tomorrow that closing median prices were down year-over-year in February, although housing economist Tom Lawler expects the NAR to report prices up just over 1% in February.
...
Following a sharp increase in home prices during spring 2021, the cost of the most common home in America fell during June 2021, with prices holding steady into the beginning of 2022. For the week ending March 17, 2023, prices were up -0.2% year over year, and the price of the most common U.S. home was $352,497.
House Prices: Rust or Bust?
by Calculated Risk on 3/20/2023 09:41:00 AM
Today, in the Calculated Risk Real Estate Newsletter:
House Prices: Rust or Bust? It is possible the Median House Price will be Down YoY in February
A brief excerpt:
Back in 2005, a real estate agent asked me if I thought house prices would “rust or bust”. My answer in 2005 was “bust”!There is more in the article. You can subscribe at https://calculatedrisk.substack.com/
For the current situation, I’d argue this is more like the 1978 to 1982 period, and my answer now is “rust” (see: House Prices: 7 Years in Purgatory).
On Friday, I posted housing economist Tom Lawler’s early read on February existing home sales. Lawler projects that the NAR will report sales of 4.51 million on a Seasonally Adjusted Annual Rate (SAAR) basis, well above the consensus forecast of 4.15 million SAAR. The NAR reports tomorrow; take the over!
Let me add a little color on February existing home sales and prices
Goldman Expects the FOMC to Pause
by Calculated Risk on 3/20/2023 08:40:00 AM
Yesterday I wrote: FOMC Preview: Uncertainty, Likely 25bp Hike, Maybe Pause
This morning Goldman Sachs economist David Mericle wrote: March FOMC Preview: Pause
We expect the FOMC to pause at its March meeting this week because of stress in the banking system. ... This would mean taking a pause in the inflation fight, but that should not be such a problem. ...The inflation problem actually looks less urgent now than last summer because near-term inflation expectations have fallen sharply and long-term inflation expectations have remained anchored.
...
The economic projections will likely show somewhat higher GDP growth in 2023, a lower unemployment rate in 2023, and small upward revisions to the inflation numbers. ... We have left our Fed forecast unchanged beyond March and continue to expect three additional 25bp rate hikes in May, June, and July, which would raise the funds rate to a peak of 5.25-5.5%.
emphasis added
Housing March 20th Weekly Update: Inventory Increased 0.4% Week-over-week
by Calculated Risk on 3/20/2023 08:30:00 AM
Altos reports that active single-family inventory was up 0.4 week-over-week. Inventory might have bottomed the previous week.
 Click on graph for larger image.
This inventory graph is courtesy of Altos Research.
As of March 17th, inventory was at 414 thousand (7-day average), compared to 413 thousand the prior week.

The red line is for 2023. The black line is for 2019. Note that inventory is up from the previous two years (the record low was in 2022), but still well below normal levels.
Inventory was up 68.6% compared to the same week in 2022 (last week it was up 66.8%), and down 49.7% compared to the same week in 2019 (last week down 49.5%).
A key will be when inventory starts increasing in 2023 - and this might be the start of the usual summer increase in inventory.
Mike Simonsen discusses this data regularly on Youtube.
Sunday Night Futures
by Calculated Risk on 3/20/2023 12:32:00 AM
Weekend:
• Schedule for Week of March 19, 2023
Monday:
• No major economic releases scheduled.
From CNBC: Pre-Market Data and Bloomberg futures S&P 500 futures and DOW futures are unchanged (fair value).
Oil prices were down over the last week with WTI futures at $66.37 per barrel and Brent at $72.57 per barrel. A year ago, WTI was at $105, and Brent was at $114 - so WTI oil prices are DOWN 37% year-over-year.
Here is a graph from Gasbuddy.com for nationwide gasoline prices. Nationally prices are at $3.40 per gallon. A year ago, prices were at $4.23 per gallon, so gasoline prices are down $0.83 per gallon year-over-year.
Sunday, March 19, 2023
FOMC Preview: Uncertainty, Likely 25bp Hike, Maybe Pause
by Calculated Risk on 3/19/2023 11:48:00 AM
There is uncertainty regarding FOMC policy this month due to the banking issues. Just two weeks ago, the debate appeared to be between a 25bp hike and a 50 bp hike at the March meeting. On March 7th, Fed Chair Powell said:
… the latest economic data have come in stronger than expected, which suggests that the ultimate level of interest rates is likely to be higher than previously anticipated. If the totality of the data were to indicate that faster tightening is warranted, we would be prepared to increase the pace of rate hikes.However, expectations are now that the FOMC will announce a 25bp rate increase in the federal funds rate at the FOMC meeting this week, and they might even pause.
emphasis added
On the meeting this week from BofA:
1 Projections of change in real GDP and inflation are from the fourth quarter of the previous year to the fourth quarter of the year indicated.
The unemployment rate was at 3.6% in February, just above the 50-year low. The FOMC has been criticized for projecting a significant employment recession this year, and they will probably revise down their projected unemployment rate for Q4 2023.
2 Projections for the unemployment rate are for the average civilian unemployment rate in the fourth quarter of the year indicated.
As of January 2023, PCE inflation was up 5.4% year-over-year from January 2022, and, in general, inflation has been close to expectations. However, after accounting for the unusual dynamics related to the pandemic, inflation is likely lower than expected. The FOMC will likely leave their inflation projections mostly unchanged.
PCE core inflation was up 4.7% in January year-over-year.
"[W]e look for the Fed to raise its target range for the federal funds rate by 25bp to 4.75-5.0%. The recent market turbulence stemming from distress in several regional banks certainly calls for more caution ... In the absence of further events, policymakers are likely to conclude that inflation stability remains a key monetary policy priority and, given that the economic data point to real side resilience and inflation persistence, a view a 25bp rate hike is warranted. Forward guidance, however, is likely to be somewhat dovish, highlighting the emergence of downside risk to the outlook and the policy rate path."
emphasis added
Projections will be released at this meeting. For review, here are the December projections. Since the last projections were released, the economy has performed better than the FOMC expected, and inflation was close to expectations (after revisions).
The BEA reported real GDP was above the December projections for 2022. And GDP tracking estimates show decent growth in Q1 (although there is a wide range of estimates). GDP projections for 2023 will likely be revised up.
| GDP projections of Federal Reserve Governors and Reserve Bank presidents, Change in Real GDP1 | ||||
|---|---|---|---|---|
| Projection Date | 2023 | 2024 | 2025 | |
| Dec 2022 | 0.4 to 1.0 | 1.3 to 2.0 | 1.6 to 2.0 | |
The unemployment rate was at 3.6% in February, just above the 50-year low. The FOMC has been criticized for projecting a significant employment recession this year, and they will probably revise down their projected unemployment rate for Q4 2023.
| Unemployment projections of Federal Reserve Governors and Reserve Bank presidents, Unemployment Rate2 | ||||
|---|---|---|---|---|
| Projection Date | 2023 | 2024 | 2025 | |
| Dec 2022 | 4.4 to 4.7 | 4.3 to 4.8 | 4.0 to 4.7 | |
As of January 2023, PCE inflation was up 5.4% year-over-year from January 2022, and, in general, inflation has been close to expectations. However, after accounting for the unusual dynamics related to the pandemic, inflation is likely lower than expected. The FOMC will likely leave their inflation projections mostly unchanged.
| Inflation projections of Federal Reserve Governors and Reserve Bank presidents, PCE Inflation1 | ||||
|---|---|---|---|---|
| Projection Date | 2023 | 2024 | 2025 | |
| Dec 2022 | 2.9 to 3.5 | 2.3 to 2.7 | 2.0 to 2.2 | |
PCE core inflation was up 4.7% in January year-over-year.
| Core Inflation projections of Federal Reserve Governors and Reserve Bank presidents, Core Inflation1 | ||||
|---|---|---|---|---|
| Projection Date | 2023 | 2024 | 2025 | |
| Dec 2022 | 3.2 to 3.7 | 2.3 to 2.7 | 2.0 to 2.2 | |
Saturday, March 18, 2023
Real Estate Newsletter Articles this Week: "Average Length of Time from Start to Completion increased Sharply in 2022"
by Calculated Risk on 3/18/2023 02:11:00 PM
At the Calculated Risk Real Estate Newsletter this week:
• Pandemic Economics, Housing and Monetary Policy: Part 2
• Current State of the Housing Market; Overview for mid-March
• Lawler: Early Read on Existing Home Sales in February
• February Housing Starts: Average Length of Time from Start to Completion increased Sharply in 2022
• Q4 Update: Delinquencies, Foreclosures and REO
• 2nd Look at Local Housing Markets in February
This is usually published 4 to 6 times a week and provides more in-depth analysis of the housing market.
You can subscribe at https://calculatedrisk.substack.com/
Most content is available for free (and no Ads), but please subscribe!
Schedule for Week of March 19, 2023
by Calculated Risk on 3/18/2023 08:11:00 AM
The key reports this week are February New and Existing Home Sales.
The FOMC meets this week, and there is some uncertainty on rate hikes due to the recent banking issues.
No major economic releases scheduled.
 10:00 AM: Existing Home Sales for February from the National Association of Realtors (NAR). The consensus is for 4.15 million SAAR, up from 4.00 million.
The graph shows existing home sales from 1994 through the report last month.
Housing economist Tom Lawler expects the NAR to report sales of 4.51 million SAAR for February (well above consensus).
----- Wednesday, March 22nd -----
7:00 AM ET: The Mortgage Bankers Association (MBA) will release the results for the mortgage purchase applications index.
During the day: The AIA's Architecture Billings Index for February (a leading indicator for commercial real estate).
2:00 PM: FOMC Meeting Announcement. The FOMC is expected to raise the Fed Funds rate by 25bps at this meeting, although there is some uncertainty due to the bank issues.
2:00 PM: FOMC Projections. This will include the Federal Open Market Committee (FOMC) participants' projections of the appropriate target federal funds rate along with updated economic projections.
2:30 PM: Fed Chair Jerome Powell holds a press briefing following the FOMC announcement.
----- Thursday, March 23rd -----
8:30 AM: The initial weekly unemployment claims report will be released. The consensus is for 190 thousand initial claims, down from 192 thousand last week.
8:30 AM ET: Chicago Fed National Activity Index for February. This is a composite index of other data.
 10:00 AM: New Home Sales for February from the Census Bureau.
This graph shows New Home Sales since 1963. The dashed line is the sales rate for last month.
The consensus is for 650 thousand SAAR, down from 670 thousand in January.
11:00 AM: the Kansas City Fed manufacturing survey for March.
----- Friday, March 24th -----
8:30 AM: Durable Goods Orders for February from the Census Bureau. The consensus is for a 1.2% increase in durable goods orders.
10:00 AM: State Employment and Unemployment (Monthly), February 2023
7:00 AM ET: The Mortgage Bankers Association (MBA) will release the results for the mortgage purchase applications index.
During the day: The AIA's Architecture Billings Index for February (a leading indicator for commercial real estate).
2:00 PM: FOMC Meeting Announcement. The FOMC is expected to raise the Fed Funds rate by 25bps at this meeting, although there is some uncertainty due to the bank issues.
2:00 PM: FOMC Projections. This will include the Federal Open Market Committee (FOMC) participants' projections of the appropriate target federal funds rate along with updated economic projections.
2:30 PM: Fed Chair Jerome Powell holds a press briefing following the FOMC announcement.
8:30 AM: The initial weekly unemployment claims report will be released. The consensus is for 190 thousand initial claims, down from 192 thousand last week.
8:30 AM ET: Chicago Fed National Activity Index for February. This is a composite index of other data.
 10:00 AM: New Home Sales for February from the Census Bureau.
 This graph shows New Home Sales since 1963. The dashed line is the sales rate for last month.
The consensus is for 650 thousand SAAR, down from 670 thousand in January.
11:00 AM: the Kansas City Fed manufacturing survey for March.
8:30 AM: Durable Goods Orders for February from the Census Bureau. The consensus is for a 1.2% increase in durable goods orders.
10:00 AM: State Employment and Unemployment (Monthly), February 2023
Friday, March 17, 2023
COVID Mar 17, 2023: Update on Cases, Hospitalizations and Deaths
by Calculated Risk on 3/17/2023 08:45:00 PM
 Note: Mortgage rates are from MortgageNewsDaily.com and are for top tier scenarios.
On COVID (focus on hospitalizations and deaths). Data is now weekly.
| COVID Metrics | ||||
|---|---|---|---|---|
| Now | Week Ago | Goal | ||
| New Cases per Week2 | 149,955 | 186,793 | ≤35,0001 | |
| Hospitalized2 | 17,348 | 19,629 | ≤3,0001 | |
| Deaths per Week2 | 1,706 | 2,100 | ≤3501 | |
| 1my goals to stop weekly posts, 2Weekly for Cases, Currently Hospitalized, and Deaths 🚩 Increasing number weekly for Cases, Hospitalized, and Deaths ✅ Goal met. | ||||
 Click on graph for larger image.
This graph shows the weekly (columns) number of deaths reported.
After the first few weeks, the pandemic low for weekly deaths was the week of July 7, 2021, at 1,690 deaths. For cases, the low was 82,186.
For hospitalizations, the low was 9,821.


