 RSS Feed
 by Calculated Risk on 1/27/2023 09:58:00 PM
Friday, January 27, 2023
COVID Jan 27, 2023: Update on Cases, Hospitalizations and Deaths
On COVID (focus on hospitalizations and deaths). Data is now weekly.
| COVID Metrics | ||||
|---|---|---|---|---|
| Now | Week Ago | Goal | ||
| New Cases per Week2 | 295,140 | 332,606 | ≤35,0001 | |
| Hospitalized2 | 29,411 | 34,723 | ≤3,0001 | |
| Deaths per Week2 | 3,756 | 3,948 | ≤3501 | |
| 1my goals to stop weekly posts, 2Weekly for Cases, Currently Hospitalized, and Deaths 🚩 Increasing number weekly for Cases, Hospitalized, and Deaths ✅ Goal met. | ||||
 Click on graph for larger image.
This graph shows the weekly (columns) number of deaths reported.
January was the worst month for the previous two years, and this January has seen a much smaller increase in deaths.
Hotels: Occupancy Rate Down 6.2% Compared to Same Week in 2019
by Calculated Risk on 1/27/2023 04:09:00 PM
With the Martin Luther King Jr. holiday, U.S. hotel performance came in slightly lower than the previous week, according to STR‘s latest data through Jan. 21.The following graph shows the seasonal pattern for the hotel occupancy rate using the four-week average.
Jan. 15-21, 2023 (percentage change from comparable week in 2019*):
• Occupancy: 54.2% (-6.2%)
• Average daily rate (ADR): $140.16 (+11.3%)
• evenue per available room (RevPAR): $75.97 (+4.4%)
*Due to the pandemic impact, STR is measuring recovery against comparable time periods from 2019. Year-over-year comparisons will once again become standard after Q1.
emphasis added
 Click on graph for larger image.
The red line is for 2023, black is 2020, blue is the median, and dashed light blue is for 2022. Dashed purple is 2019 (STR is comparing to a strong year for hotels).
The 4-week average of the occupancy rate is below the median rate for the previous 20 years (Blue), but this is the slow season - and some of the early year weakness might be related to the timing of the report.
Note: Y-axis doesn't start at zero to better show the seasonal change.
The 4-week average of the occupancy rate will increase seasonally over the next few months.
Realtor.com Reports Weekly Active Inventory Up 69% YoY; New Listings Down 5% YoY
by Calculated Risk on 1/27/2023 03:12:00 PM
Realtor.com has monthly and weekly data on the existing home market. Here is their weekly report released today from Chief Economist Danielle Hale: Weekly Housing Trends View — Data Week Ending Jan 21, 2023. Note: They have data on list prices, new listings and more, but this focus is on inventory.
• Active inventory growth continued to climb with for-sale homes up 69% above one year ago. In January, the housing market built further on the impressive growth seen in late 2022. But there is still room for more. Even after surging more than 50% in December 2022, the number of homes on the market trailed pre-pandemic counts by nearly 40%.
...
• New listings–a measure of sellers putting homes up for sale–were again down, this week by 5% from one year ago. This marks the twenty-ninth consecutive week of year-over-year declines in homeowners listing their homes for sale, but this week’s decline was not only smaller than dip, the average decline in new listings so far this year is about half what we saw in the fourth quarter of 2022. As mortgage rates rose and the market shifted from a distinct seller’s market to one that might better be described as a nobody’s market, we saw homeowners retrench, and the number of new listings fell. Although the number of new listings is still declining, at the current pace we could see a reversal of that trend or more new listings than one year ago as soon as February.
 Here is a graph of the year-over-year change in inventory according to realtor.com.
 In early 2022, inventory was declining rapidly, so the year-over-year change is up sharply.
An interesting note this week is that new listings were only down 5% from a year ago. This is a significant change from December when new listings were down 21% year-over-year according to Realtor.com, and down 21.5% in the local markets I track. Something to watch!
Has Housing "Bottomed"?
by Calculated Risk on 1/27/2023 12:18:00 PM
Today, in the Calculated Risk Real Estate Newsletter: Has Housing "Bottomed"?
Brief excerpt:
I’ve heard some positive comments from a number of real estate agents in the last week about the existing home market.You can subscribe at https://calculatedrisk.substack.com/.
...
Activity is still down sharply year-over-year (YoY), but the YoY decline is getting smaller.
And some upbeat comments on new home sales ...
Way back in 2009, I pointed out that there are usually two bottoms for housing.There will probably be two bottoms for Residential Real Estate.The first bottom is for activity, and the second is for prices.
The first will be for new home sales, housing starts and residential investment. The second bottom will be for prices. Sometimes these bottoms can happen years apart.
NAR: Pending Home Sales Increased 2.5% in December, Year-over-year Down 33.8%
by Calculated Risk on 1/27/2023 10:03:00 AM
From the NAR: Pending Home Sales Increased 2.5% in December, Ending Six-Month Slide
Pending home sales increased in December for the first time since May 2022 — following six consecutive months of declines — according to the National Association of Realtors®. The Northeast and Midwest recorded month-over-month reductions, while the South and West posted monthly gains. All four U.S. regions saw year-over-year decreases in transactions, with the West experiencing the largest decline at 37.5%.Expectations had been for a 1.0% decline for this index. Note: Contract signings usually lead sales by about 45 to 60 days, so this would usually be for closed sales in January and February.
The Pending Home Sales Index (PHSI) — a forward-looking indicator of home sales based on contract signings — improved 2.5% to 76.9 in December. Year-over-year, pending transactions dropped by 33.8%. An index of 100 is equal to the level of contract activity in 2001.
“This recent low point in home sales activity is likely over,” said NAR Chief Economist Lawrence Yun. “Mortgage rates are the dominant factor driving home sales, and recent declines in rates are clearly helping to stabilize the market.”
...
The Northeast PHSI dropped 6.5% from last month to 64.7, a decrease of 32.5% from December 2021. The Midwest index shrank 0.3% to 77.6 in December, a decline of 30.1% from one year ago.
The South PHSI rose 6.1% to 94.1 in December, dropping 34.5% from the prior year. The West index advanced 6.4% in December to 58.6, decreasing 37.5% from December 2021.
emphasis added
Personal Income increased 0.2% in December; Spending decreased 0.2%
by Calculated Risk on 1/27/2023 08:41:00 AM
The BEA released the Personal Income and Outlays report for December:
Personal income increased $49.5 billion (0.2 percent) in December, according to estimates released today by the Bureau of Economic Analysis. Disposable personal income (DPI) increased $49.2 billion (0.3 percent) and personal consumption expenditures (PCE) decreased $41.6 billion (0.2 percent).The December PCE price index increased 5.0 percent year-over-year (YoY), down from 5.5 percent YoY in November, and down from the recent peak of 7.0 percent in June 2022.
The PCE price index increased 0.1 percent. Excluding food and energy, the PCE price index increased 0.3 percent. Real DPI increased 0.2 percent in December and Real PCE decreased 0.3 percent; goods decreased 0.9 percent and services were unchanged.
emphasis added
The PCE price index, excluding food and energy, increased 4.4 percent YoY, down from 4.7 percent in November, and down from the recent peak of 5.4 percent in February 2022.
The following graph shows real Personal Consumption Expenditures (PCE) through December 2022 (2012 dollars). Note that the y-axis doesn't start at zero to better show the change.
 Click on graph for larger image.
The dashed red lines are the quarterly levels for real PCE.
Personal income was at expectations, and the decrease in PCE was slightly below expectations.
Inflation was close to expectations.
Thursday, January 26, 2023
Friday: Personal Income and Outlays, Pending Home Sales
by Calculated Risk on 1/26/2023 08:49:00 PM
 Note: Mortgage rates are from MortgageNewsDaily.com and are for top tier scenarios.
Friday:
• At 8:30 AM ET, Personal Income and Outlays for December. The consensus is for a 0.2% increase in personal income, and for a 0.1% decrease in personal spending. And for the Core PCE price index to increase 0.3%. PCE prices are expected to be up 5.0% YoY, and core PCE prices up 4.4% YoY.
• At 10:00 AM, Pending Home Sales Index for December. The consensus is for a -1.0% decrease in the index.
• Also at 10:00 AM, University of Michigan's Consumer sentiment index (Final for January). The consensus is for a reading of 64.6.
A Few Comments on Q4 GDP and Investment
by Calculated Risk on 1/26/2023 01:47:00 PM
Note: The first two graphs - Investment Contributions and Residential Investment as a percent of GDP - are useful in predicting Fed induced recessions. RI as a percent of GDP usually turns down well in advance of a recession. This is something I'm watching.
Earlier from the BEA: Gross Domestic Product, Fourth Quarter 2022 (Advance Estimate)
Real gross domestic product (GDP) increased at an annual rate of 2.9 percent in the fourth quarter of 2022, according to the "advance" estimate released by the Bureau of Economic Analysis. In the third quarter, real GDP increased 3.2 percent. ...The advance Q4 GDP report, at 2.9% annualized, was above expectations, partly due to a positive impact from an increase in inventories.
The increase in real GDP reflected increases in private inventory investment, consumer spending, federal government spending, state and local government spending, and nonresidential fixed investment that were partly offset by decreases in residential fixed investment and exports. Imports, which are a subtraction in the calculation of GDP, decreased.
emphasis added
Personal consumption expenditures (PCE) increased at a 2.1% annualized rate in Q4.
The graph below shows the contribution to GDP from residential investment, equipment and software, and nonresidential structures (3 quarter trailing average). This is important to follow because residential investment tends to lead the economy, equipment and software is generally coincident, and nonresidential structure investment trails the economy.
In the graph, red is residential, green is equipment and software, and blue is investment in non-residential structures. So, the usual pattern - both into and out of recessions is - red, green, blue.
Of course - with the sudden economic stop due to COVID-19 - the usual pattern didn't apply.
The dashed gray line is the contribution from the change in private inventories.
 Click on graph for larger image.
Residential investment (RI) decreased at a 26.7% annual rate in Q4. Equipment investment decreased at a 3.7% annual rate, and investment in non-residential structures increased at a 0.4% annual rate.
The contribution to Q4 GDP from investment in private inventories was 1.46 percentage points.
On a 3-quarter trailing average basis, RI (red) is down, equipment (green) is up, and nonresidential structures (blue) is still down.
On a 3-quarter trailing average basis, RI (red) is down, equipment (green) is up, and nonresidential structures (blue) is still down.
I'll post more on the components of non-residential investment once the supplemental data is released.
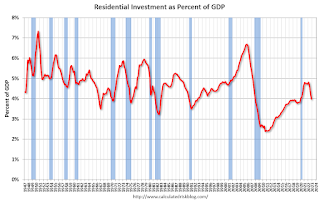 The second graph shows residential investment as a percent of GDP.
Residential Investment as a percent of GDP decreased in Q4.
I'll break down Residential Investment into components after the GDP details are released.
Note: Residential investment (RI) includes new single-family structures, multifamily structures, home improvement, broker's commissions, and a few minor categories.
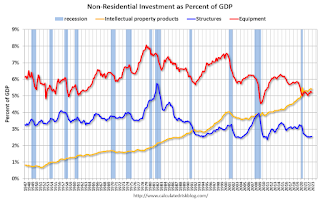 The third graph shows non-residential investment in
structures, equipment and "intellectual property products".
The third graph shows non-residential investment in
structures, equipment and "intellectual property products".
Investment in non-residential structures increased slightly in Q4 as a percent GDP.
New Home Sales at 616,000 Annual Rate in December; Previous 3 Months Revised Down Sharply
by Calculated Risk on 1/26/2023 10:47:00 AM
Today, in the Calculated Risk Real Estate Newsletter: New Home Sales at 616,000 Annual Rate in December; Previous 3 Months Revised Down Sharply
Brief excerpt:
The next graph shows the months of supply by stage of construction. “Months of supply” is inventory at each stage, divided by the sales rate.You can subscribe at https://calculatedrisk.substack.com/.
There are 1.4 months of completed supply (red line). This is close to the normal level.
The inventory of new homes under construction is at 5.7 months (blue line). This elevated level of homes under construction is due to supply chain constraints.
And about 1.9 months of potential inventory have not been started (grey line) - about double the normal level. Homebuilders are probably waiting to start some homes until they have a firmer grasp on prices and demand.
...
As previously discussed, the Census Bureau overestimates sales, and underestimates inventory when cancellation rates are rising, see: New Home Sales and Cancellations: Net vs Gross Sales. So, take the headline sales number with a large grain of salt - the actual negative impact on the homebuilders is far greater than the headline number suggests!
This will reverse when cancellation rates start declining. When a previously cancelled home is resold, the home builder counts it as a sale, but the Census Bureau does not (since it was already counted).
There are a large number of homes under construction, and this suggests we will see a further sharp increase in completed inventory over the next several months - and that will keep pressure on new home prices.

New Home Sales at 616,000 Annual Rate in December; Annual Sales down 16.4% in 2022
by Calculated Risk on 1/26/2023 10:09:00 AM
The Census Bureau reports New Home Sales in December were at a seasonally adjusted annual rate (SAAR) of 616 thousand.
The previous three months were revised down sharply.
Sales of new single‐family houses in December 2022 were at a seasonally adjusted annual rate of 616,000, according to estimates released jointly today by the U.S. Census Bureau and the Department of Housing and Urban Development. This is 2.3 percent above the revised November rate of 602,000, but is 26.6 percent below the December 2021 estimate of 839,000.
An estimated 644,000 new homes were sold in 2022. This is 16.4 percent below the 2021 figure of 771,000.
emphasis added
 Click on graph for larger image.
The first graph shows New Home Sales vs. recessions since 1963. The dashed line is the current sales rate.
New home sales are below pre-pandemic levels.
The second graph shows New Home Months of Supply.
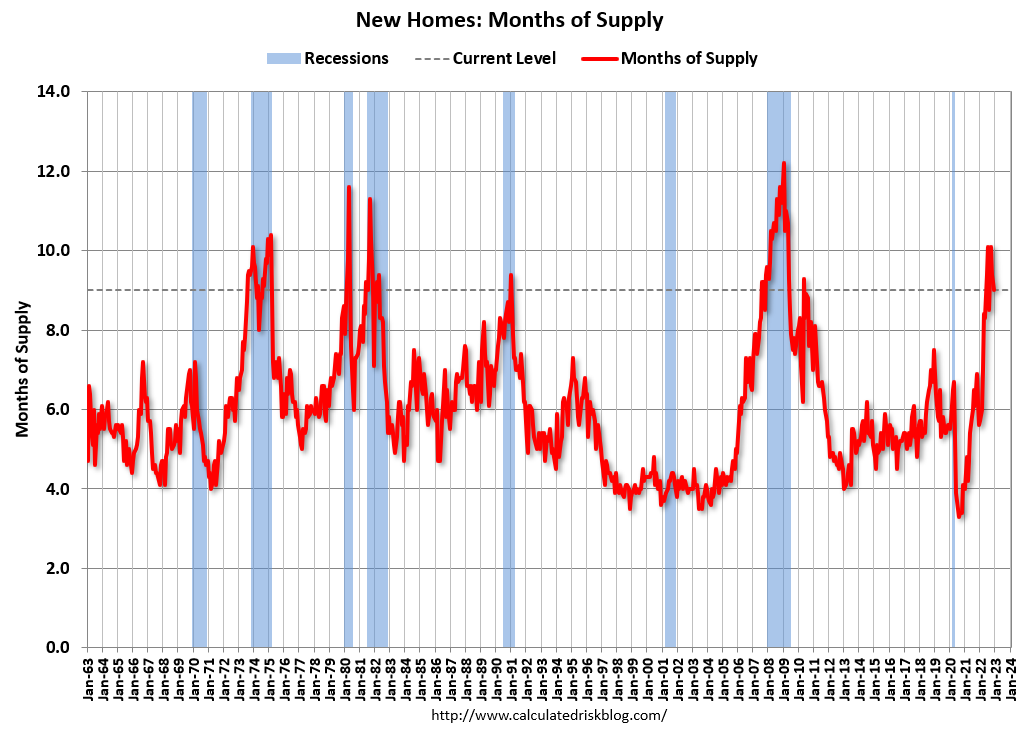 The months of supply decreased in December to 9.0 months from 9.2 months in November.
 The all-time record high was 12.1 months of supply in January 2009. The all-time record low was 3.5 months, most recently in October 2020.
This is well above the top of the normal range (about 4 to 6 months of supply is normal).
"The seasonally‐adjusted estimate of new houses for sale at the end of December was 461,000. This represents a supply of 9.0 months at the current sales rate."
 The last graph shows sales NSA (monthly sales, not seasonally adjusted annual rate).
In December 2022 (red column), 47 thousand new homes were sold (NSA). Last year, 61 thousand homes were sold in November.
The all-time high for December was 87 thousand in 2005, and the all-time low for December was 23 thousand in 2010.
This was at expectations of 614 thousand SAAR, however sales in the three previous months were revised down sharply. I'll have more later today.


