 RSS Feed
 by Calculated Risk on 1/21/2023 02:11:00 PM
Saturday, January 21, 2023
Real Estate Newsletter Articles this Week: Median House Prices Down 11.3% from Peak in June 2022; Record Number of Housing Units Under Construction
At the Calculated Risk Real Estate Newsletter this week:
• NAR: Existing-Home Sales Decreased to 4.02 million SAAR in December Median Prices Down 11.3% from Peak in June 2022
• December Housing Starts: Record Number of Housing Units Under Construction
• 4th Look at Local Housing Markets in December California Home Sales down 44% YoY in December; Prices Down 2.8% YoY
• The Housing Bubble and Mortgage Debt as a Percent of GDP
• Homebuilder Price Cuts
This is usually published 4 to 6 times a week and provides more in-depth analysis of the housing market.
You can subscribe at https://calculatedrisk.substack.com/
Most content is available for free (and no Ads), but please subscribe!
Schedule for Week of January 22, 2023
by Calculated Risk on 1/21/2023 08:11:00 AM
The key reports scheduled for this week are the advance estimate of Q4 GDP, December New Home sales and December Personal Income and Outlays.
For manufacturing, the Richmond and Kansas City Fed manufacturing surveys will be released.
No major economic releases are scheduled.
10:00 AM: Richmond Fed Survey of Manufacturing Activity for January.
10:00 AM: State Employment and Unemployment (Monthly) for December 2022
7:00 AM ET: The Mortgage Bankers Association (MBA) will release the results for the mortgage purchase applications index.
During the day: The AIA's Architecture Billings Index for December (a leading indicator for commercial real estate).
8:30 AM: Gross Domestic Product, 4th quarter and Year 2022 (Advance estimate). The consensus is that real GDP increased 2.6% annualized in Q4.
8:30 AM: The initial weekly unemployment claims report will be released. The consensus is for 205 thousand initial claims, up from 190 thousand last week.
8:30 AM: Durable Goods Orders for December. The consensus is for a 2.6% increase in durable goods.
8:30 AM ET: Chicago Fed National Activity Index for December. This is a composite index of other data.
 10:00 AM: New Home Sales for December from the Census Bureau.
 This graph shows New Home Sales since 1963.
The dashed line is the sales rate for last month.
The consensus is for 614 thousand SAAR, down from 640 thousand in November.
11:00 AM: the Kansas City Fed manufacturing survey for January.
8:30 AM ET: Personal Income and Outlays for December. The consensus is for a 0.2% increase in personal income, and for a 0.1% decrease in personal spending. And for the Core PCE price index to increase 0.3%. PCE prices are expected to be up 5.0% YoY, and core PCE prices up 4.4% YoY.
10:00 AM: Pending Home Sales Index for December. The consensus is for a -1.0% decrease in the index.
10:00 AM: University of Michigan's Consumer sentiment index (Final for January). The consensus is for a reading of 64.6.
Friday, January 20, 2023
COVID Jan 20, 2023: Update on Cases, Hospitalizations and Deaths
by Calculated Risk on 1/20/2023 09:17:00 PM
On COVID (focus on hospitalizations and deaths). Data is now weekly.
| COVID Metrics | ||||
|---|---|---|---|---|
| Now | Week Ago | Goal | ||
| New Cases per Week2 | 332,212 | 436,776 | ≤35,0001 | |
| Hospitalized2 | 33,405 | 39,413 | ≤3,0001 | |
| Deaths per Week2 | 3,953 | 4,209 | ≤3501 | |
| 1my goals to stop weekly posts, 2Weekly for Cases, Currently Hospitalized, and Deaths 🚩 Increasing number weekly for Cases, Hospitalized, and Deaths ✅ Goal met. | ||||
 Click on graph for larger image.
This graph shows the weekly (columns) number of deaths reported.
January was the worst month for the previous two years, and this has seen a much smaller increase in deaths.
Hotels: Occupancy Rate Down 5.5% Compared to Same Week in 2019
by Calculated Risk on 1/20/2023 04:16:00 PM
U.S. hotel performance rose from the previous week and showed mixed comparisons against 2019, according to STR‘s latest data through Jan. 14.The following graph shows the seasonal pattern for the hotel occupancy rate using the four-week average.
Jan. 8-14, 2023 (percentage change from comparable week in 2019*):
• Occupancy: 54.8% (-5.5%)
• Average daily rate (ADR): $144.81 (+15.7%)
• Revenue per available room (RevPAR): $79.38 (+9.3%)
*Due to the pandemic impact, STR is measuring recovery against comparable time periods from 2019. Year-over-year comparisons will once again become standard after the first quarter.
emphasis added
 Click on graph for larger image.
The red line is for 2023, black is 2020, blue is the median, and dashed light blue is for 2022. Dashed purple is 2019 (STR is comparing to a strong year for hotels).
The 4-week average of the occupancy rate is below the median rate for the previous 20 years (Blue), but this is the slow season - and some of the early year weakness might be related to the timing of the report.
Note: Y-axis doesn't start at zero to better show the seasonal change.
The 4-week average of the occupancy rate will increase seasonally over the next few months.
Q4 GDP Tracking: Mid-to-high 2s
by Calculated Risk on 1/20/2023 12:47:00 PM
The preliminary estimate for Q4 real GDP growth will be released this coming Thursday, January 26th. The consensus estimate is for QoQ annualized real GDP growth of 2.6% in Q4.
From BofA:
Overall the data left our 4Q US GDP tracking estimate unchanged at 2.8% q/q saar, as the stronger contribution to growth from net trade in the tracking estimate offset the five-tenths decline in our tracking estimate for personal consumption. [Jan 20th estimate]From Goldman:
emphasis added
We left our Q4 GDP tracking estimate unchanged at +2.6% (qoq ar). [Jan 10th estimate]And from the Altanta Fed: GDPNow
The GDPNow model estimate for real GDP growth (seasonally adjusted annual rate) in the fourth quarter of 2022 remains 3.5 percent on January 20. The nowcast was unchanged after rounding following this morning's report from the National Association of Realtors. [Jan 20th estimate]
NAR: Existing-Home Sales Decreased to 4.02 million SAAR in December; Median Prices Down 11.3% from Peak in June 2022
by Calculated Risk on 1/20/2023 10:46:00 AM
Today, in the CalculatedRisk Real Estate Newsletter: NAR: Existing-Home Sales Decreased to 4.02 million SAAR in December
Excerpt:
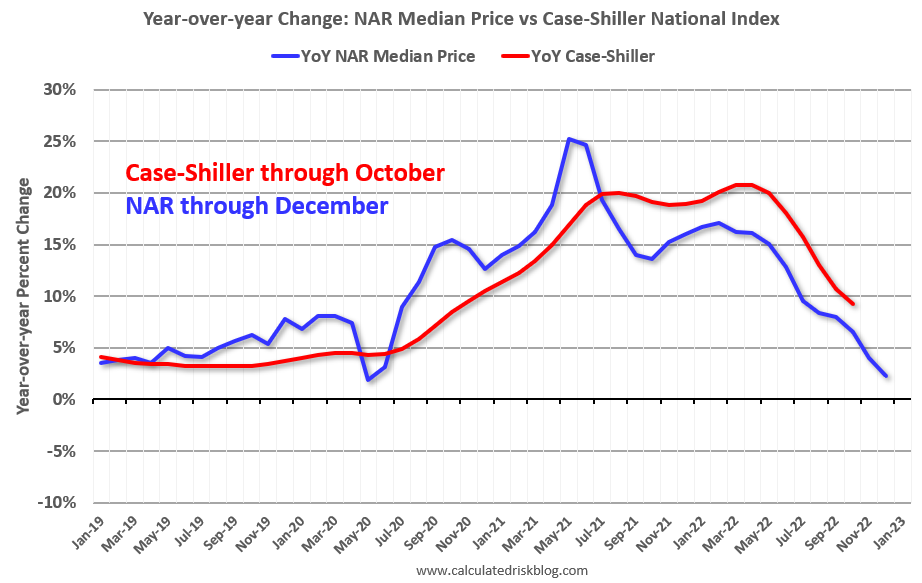
On prices, the NAR reported:There is much more in the article. You can subscribe at https://calculatedrisk.substack.com/ Please subscribe!The median existing-home price for all housing types in December was $366,900, an increase of 2.3% from December 2021 ($358,800), as prices rose in all regions. This marks 130 consecutive months of year-over-year increases, the longest-running streak on record.Median prices are distorted by the mix (repeat sales indexes like Case-Shiller and FHFA are probably better for measuring prices).
The YoY change in the median price peaked at 25.2% in May 2021 and has now slowed to 2.3%. The YoY increase in December was the lowest since May 2020. Note that the median price usually starts falling seasonally in July, so the 1.5% decline in December in the median price was partially seasonal, however the 11.3% decline in the median price over the last six months has been much larger than the usual seasonal decline.
It is likely the median price will be down year-over-year in a few months - and Case-Shiller will follow.
NAR: Existing-Home Sales Decreased to 4.02 million SAAR in December
by Calculated Risk on 1/20/2023 10:11:00 AM
From the NAR: Existing-Home Sales Receded 1.5% in December
Existing-home sales retreated for the eleventh consecutive month in December, according to the National Association of Realtors®. Three of the four major U.S. regions recorded month-over-month drops, while sales in the West were unchanged. All regions experienced year-over-year declines.
Total existing-home sales, completed transactions that include single-family homes, townhomes, condominiums and co-ops – decreased 1.5% from November to a seasonally adjusted annual rate of 4.02 million in December. Year-over-year, sales sagged 34.0% (down from 6.09 million in December 2021).
...
Total housing inventory registered at the end of December was 970,000 units, which was down 13.4% from November but up 10.2% from one year ago (880,000). Unsold inventory sits at a 2.9-month supply at the current sales pace, down from 3.3 months in November but up from 1.7 months in December 2021.
emphasis added
 Click on graph for larger image.
This graph shows existing home sales, on a Seasonally Adjusted Annual Rate (SAAR) basis since 1993.
Sales in December (4.02 million SAAR) were down 1.5% from the previous month and were 34.0% below the December 2021 sales rate.
Sales were just above the pandemic low of 4.01 million SAAR.
The second graph shows nationwide inventory for existing homes.
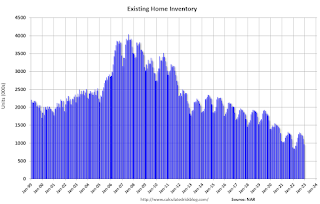 According to the NAR, inventory decreased to 0.97 million in December from 1.12 million in November.
The second graph shows nationwide inventory for existing homes.
 According to the NAR, inventory decreased to 0.97 million in December from 1.12 million in November.
Headline inventory is not seasonally adjusted, and inventory usually decreases to the seasonal lows in December and January, and peaks in mid-to-late summer.
The last graph shows the year-over-year (YoY) change in reported existing home inventory and months-of-supply. Since inventory is not seasonally adjusted, it really helps to look at the YoY change. Note: Months-of-supply is based on the seasonally adjusted sales and not seasonally adjusted inventory.
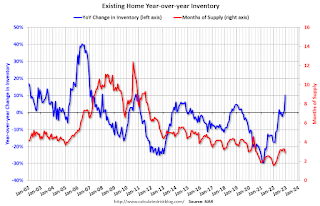 Inventory was up 10.2% year-over-year (blue) in December compared to December 2021.
Months of supply (red) decreased to 2.9 months in December from 3.3 months in November.
This was above the consensus forecast. I'll have more later.
The last graph shows the year-over-year (YoY) change in reported existing home inventory and months-of-supply. Since inventory is not seasonally adjusted, it really helps to look at the YoY change. Note: Months-of-supply is based on the seasonally adjusted sales and not seasonally adjusted inventory.
 Inventory was up 10.2% year-over-year (blue) in December compared to December 2021.
 Months of supply (red) decreased to 2.9 months in December from 3.3 months in November.
This was above the consensus forecast. I'll have more later.
Monetary Policy: The Pause that Refreshes?
by Calculated Risk on 1/20/2023 09:14:00 AM
This morning BofA economists noted a possible shift in FOMC policy:
[O]ur baseline outlook for monetary policy includes 25bp rate hikes in February, March, and May of this year.This is close to my current view: Question #6 for 2023: What will the Fed Funds rate be in December 2023?
That said, if the Fed is comfortable downshifting to 25bp in February, it may be a signal that the committee is closer to terminal than it (and we) thought as recently as December. Recent trends in inflation look more favorable – and trends in economic activity look less favorable – than the median FOMC member projected in December. Should these trends continue, it could open the door for a pause in rate hikes as early as the March FOMC meeting (at a terminal of 4.75-5.0%). FOMC participants could justify this on account of risk management – pausing to assess the lagged effects of prior tightening – or from a real policy rate perspective. The December projections suggest the median member desires a real policy rate of around 150bp; an earlier pause to hikes would prevent monetary policy from becoming “too tight” as inflation falls. Again, this is not our baseline outlook, but, if history is any guide, turning points in the economy can be abrupt, and we cannot rule out an earlier end to policy rate tightening based on the November-December data flow.
Thursday, January 19, 2023
Friday: Existing Home Sales
by Calculated Risk on 1/19/2023 08:36:00 PM
 Note: Mortgage rates are from MortgageNewsDaily.com and are for top tier scenarios.
Friday:
• At 10:00 AM ET, Existing Home Sales for December from the National Association of Realtors (NAR). The consensus is for 3.95 million SAAR, down from 4.09 million.
"Short Memories"
by Calculated Risk on 1/19/2023 04:46:00 PM
This was written in 2014, but I never published it!
A short comment on "short memories" ...
Voters have "short memories". Sometimes "short memories" are good. Albert Schweitzer once said, "Happiness is nothing more than good health and a bad memory".
Many people think having a short memory is helpful in sports (not letting previous failures bother you) and in life (forgetting bad things and / not holding a grudge / letting go).
But for the economy and policy, short memories are a negative. There will be always be another generation of financial alchemists who think they can turn radioactive waste into gold. And once again the riches will flow, until the economy suffers. The next serious bubble and crash is coming, we just don't know when.
For policy, forgetting what actually happened (with the help of political spinners) is standard practice. We'd actually have much better policy if voters had better memories, but unfortunately, they don't. Politicians take advantage of this collective forgetfulness and act up in odd years - something everyone should be aware of as we head into 2015 (edit: now 2023) (I expect some episodes of DC craziness).
As far as the "debt ceiling", the "debt ceiling" sounds virtuous, when, in reality, the vote is about whether or not to the pay the bills - and not paying the bills is reckless and irresponsible. The "debt ceiling" is redundant (once a budget or a continuing resolution is passed, then the impact on the debt is pretty much known). This is like someone not paying their credit card bill to teach themselves not to use so much credit! Irresponsible.
I prefer the term "default ceiling" because that is what it is.
best to all.


