 RSS Feed
 by Calculated Risk on 12/08/2022 09:01:00 PM
Thursday, December 08, 2022
Friday: PPI, Flow of Funds
 Note: Mortgage rates are from MortgageNewsDaily.com and are for top tier scenarios.
Friday:
• At 8:30 AM ET, The Producer Price Index for November from the BLS. The consensus is for a 0.3% increase in PPI, and a 0.2% increase in core PPI.
• At 10:00 AM, University of Michigan's Consumer sentiment index (Preliminary for December).
• At 12:00 PM, Q3 Flow of Funds Accounts of the United States from the Federal Reserve.
Realtor.com Reports Weekly Active Inventory Up 53% Year-over-year; New Listings Down 8%
by Calculated Risk on 12/08/2022 03:50:00 PM
Realtor.com has monthly and weekly data on the existing home market. Here is their weekly report released today from Chief Economist Danielle Hale: Weekly Housing Trends View — Data Week Ending Dec 3, 2022. Note: They have data on list prices, new listings and more, but this focus is on inventory.
• Active inventory growth held steady with for-sale homes up 53% above one year ago. Inventory growth steadied this week, the first time in eight weeks that we didn’t see a larger yearly growth rate compared to the prior week. This move is even more impressive as it comes against a backdrop of smaller listing declines and growing time on market.
...
• New listings–a measure of sellers putting homes up for sale–were again down, but dropped only 8% from one year ago. This marks the twenty-second consecutive week of year-over-year declines in homeowners listing their home for sale, but was the smallest decline since July.
 Here is a graph of the year-over-year change in inventory according to realtor.com.
 Note the rapid increase in the YoY change earlier this year, from down 30% at the beginning of the year, to up 29% YoY at the beginning of July.
Then the Realtor.com data was stuck at up around 26% to 30% YoY for 14 weeks in a row. This was due to the slowdown in new listings, even as sales had fallen sharply.
Then the YoY change started increasing sharply again as mortgage rates increased.
This week was a change from the previous 3 months - no increase in the year-over-year change in inventory - even with a smaller decline in new listings (inventory is falling week-to-week, but the comparison is YoY).
Hotels: Occupancy Rate Down 7.7% Compared to Same Week in 2019
by Calculated Risk on 12/08/2022 03:14:00 PM
U.S. hotel performance came in higher than the previous week but showed weakened comparisons to 2019, according to STR‘s latest data through Dec. 3.The following graph shows the seasonal pattern for the hotel occupancy rate using the four-week average.
Nov. 27 through Dec. 3, 2022 (percentage change from comparable week in 2019*):
• Occupancy: 55.4% (-7.7%)
• Average daily rate (ADR): $141.71 (+10.2%)
• Revenue per available room (RevPAR): $78.50 (+1.7%)
*Due to the pandemic impact, STR is measuring recovery against comparable time periods from 2019.
emphasis added
 Click on graph for larger image.
The red line is for 2022, black is 2020, blue is the median, and dashed light blue is for 2021. Dashed purple is 2019 (STR is comparing to a strong year for hotels).
The 4-week average of the occupancy rate is above the median rate for the previous 20 years (Blue) and close to 2019 levels.
Note: Y-axis doesn't start at zero to better show the seasonal change.
The 4-week average of the occupancy rate continue to decline into the Winter.
2023 Housing Forecasts
by Calculated Risk on 12/08/2022 10:51:00 AM
Today, in the Calculated Risk Real Estate Newsletter: 2023 Housing Forecasts
A brief excerpt:
Towards the end of each year, I collect some housing forecasts for the following year.There is much more in the article. You can subscribe at https://calculatedrisk.substack.com/
For comparison, new home sales in 2022 will probably be around 640 thousand, down from 771 thousand in 2021.
Total housing starts will be around 1.55 million in 2022, down slightly from 1.60 million in 2021.
Existing home sales will be around 5.1 million in 2022, down from 6.1 million in 2021.
As of September, Case-Shiller house prices were up 10.6% year-over-year, but the year-over-year change is slowing rapidly.
...
There is an especially wide range in the forecasts for house prices and shows the difficulties in modeling this housing cycle. My view is house prices will decline in 2023 and will fall 10% or more from peak-to-trough (see House Prices: 7 Years in Purgatory).

AAR: November Rail Carloads Down Slightly Year-over-year, Intermodal Down
by Calculated Risk on 12/08/2022 09:51:00 AM
From the Association of American Railroads (AAR) Rail Time Indicators. Graphs and excerpts reprinted with permission.
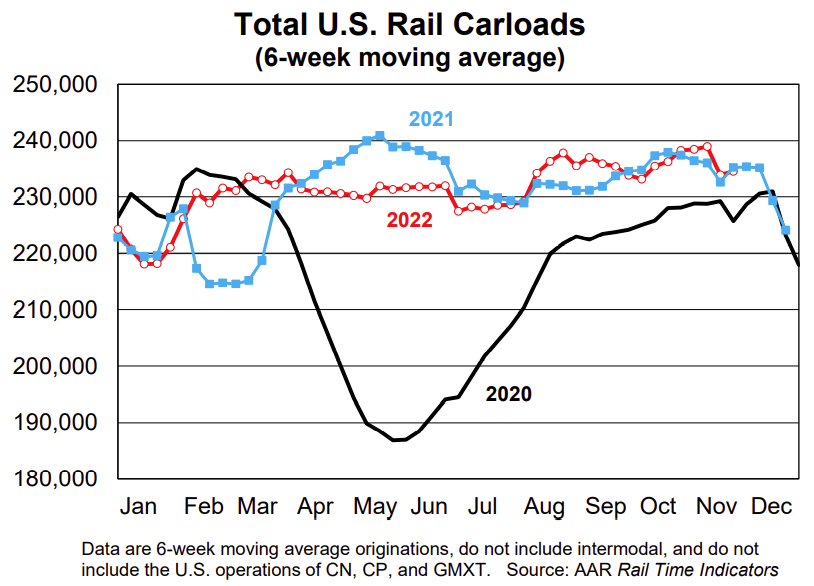
Total U.S. rail carloads in November were down 0.9% from last year, but the weekly average for the month (232,547) was slightly higher than the weekly average so far in 2022 (231,961). In November, eight of the 20 carload categories we track had gains. ... U.S. intermodal originations, which are not included in carloads, fell 5.4% in November — their ninth straight decline and 15th in the past 16 months. Year-to-date intermodal was down 4.8%.
emphasis added
 Click on graph for larger image.
This graph from the Rail Time Indicators report shows the six-week average of U.S. Carloads in 2020, 2021 and 2022:
Total originated carloads in November on U.S. railroads averaged 232,547 per week, down 0.9% from November 2021 but slightly higher than the average week so far in 2022.
 The second graph shows the six-week average (not monthly) of U.S. intermodal in 2020, 2021 and 2022: (using intermodal or shipping containers):
U.S. intermodal originations, which are not included in carloads, fell 5.4% in November 2022 from November 2021 — their ninth straight year-over-year decline and 15th in the past 16 months. In 2022 through November, intermodal volume was down 4.8% (637,473 containers and trailers) from last year but was up 1.7% (211,419 units) over 2020. Much of what railroads haul in intermodal service fills the shelves of big-box and other retailers, and retailers’ demand for items to fill their shelves depends in part on inventory levels.
Weekly Initial Unemployment Claims increase to 230,000
by Calculated Risk on 12/08/2022 08:36:00 AM
The DOL reported:
In the week ending December 3, the advance figure for seasonally adjusted initial claims was 230,000, an increase of 4,000 from the previous week's revised level. The previous week's level was revised up by 1,000 from 225,000 to 226,000. The 4-week moving average was 230,000, an increase of 1,000 from the previous week's revised average. The previous week's average was revised up by 250 from 228,750 to 229,000.The following graph shows the 4-week moving average of weekly claims since 1971.
emphasis added
 Click on graph for larger image.
The dashed line on the graph is the current 4-week average. The four-week average of weekly unemployment claims increased to 230,000.
The previous week was revised up.
Weekly claims were at the consensus forecast.
Wednesday, December 07, 2022
Thursday: Unemployment Claims
by Calculated Risk on 12/07/2022 09:37:00 PM
 Note: Mortgage rates are from MortgageNewsDaily.com and are for top tier scenarios.
Thursday:
• At 8:30 AM ET, The initial weekly unemployment claims report will be released. The consensus is for 230 thousand initial claims, up from 225 thousand last week.
Recession Watch
by Calculated Risk on 12/07/2022 02:41:00 PM
The recession callers were back in the first half of 2022, and some like ARK's Cathie Wood and Home Depot's Ken Langone claimed the US was already in a recession. I disagreed and noted I wasn't even on recession watch!
Now it seems like most forecasts are for a recession in 2023. My answer is: Maybe.
 Click on graph for larger image.
The arrows point to some of the earlier peaks and troughs for these three measures - and the most recent peak.
The purpose of this graph is to show that these three indicators generally reach peaks and troughs together. Note that Residential Investment is quarterly and single-family starts and new home sales are monthly.
New home sales and single-family starts turned down last year, but that was partly due to the huge surge in sales during the pandemic - and then rebounded somewhat. Now both new home sales and single-family starts have turned down in response to higher mortgage rates. Residential investment has also peaked.
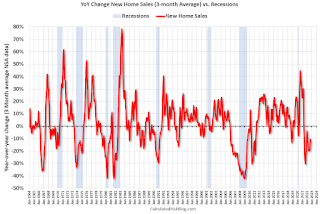 The second graph shows the YoY change in New Home Sales from the Census Bureau. Currently new home sales (based on 3-month average) are down 13% year-over-year.
Note: the New Home Sales data is smoothed using a three month centered average before calculating the YoY change. The Census Bureau data starts in 1963.
Some observations:
1) When the YoY change in New Home Sales falls about 20%, usually a recession will follow. An exception for this data series was the mid '60s when the Vietnam buildup kept the economy out of recession. Another exception was in late 2021 - we saw a significant YoY decline in new home sales related to the pandemic and the surge in new home sales in the second half of 2020. I ignored that pandemic distortion.
Way back in 2013, I wrote a post "Predicting the Next Recession. This post was in response to several recession forecasts (that were also incorrect). In that 2013 post, I wrote:
The next recession will probably be caused by one of the following (from least likely to most likely):Unfortunately, in 2020, one of those low probability events happened (pandemic), and that led to a recession in 2020.
3) An exogenous event such as a pandemic, significant military conflict, disruption of energy supplies for any reason, a major natural disaster (meteor strike, super volcano, etc), and a number of other low probability reasons. All of these events are possible, but they are unpredictable, and the probabilities are low that they will happen in the next few years or even decades.
emphasis added
2) Significant policy error. Two examples: not reaching a fiscal agreement and going off the "fiscal cliff" probably would have led to a recession, and Congress refusing to "pay the bills" would have been a policy error that would have taken the economy into recession.Refusing to "pay the bills" (not raising the debt ceiling), would be a policy error - but that seems unlikely (you never know).
1) Most of the post-WWII recessions were caused by the Fed tightening monetary policy to slow inflation. I think this is the most likely cause of the next recession. Usually, when inflation starts to become a concern, the Fed tries to engineer a "soft landing", and frequently the result is a recession.And this most common cause of a recession is the current concern. Since inflation picked up, mostly due to the pandemic (stimulus spending, supply constraints, WFH impacts on household formation) and due to the invasion of Ukraine, the Fed has embarked on a tightening cycle to slow inflation.
The Fed cannot ease pandemic related supply constraints (except by curbing demand), and the Fed cannot stop the war. So, there is a possibility that the Fed will tighten too much and that will lead to a "hard landing" (aka recession).
The key will be to watch housing. Housing is the main transmission mechanism for Fed policy. One of my favorite models for business cycle forecasting uses new home sales (also housing starts and residential investment). I also look at the yield curve, but I've found new home sales is generally more useful. (See my post in 2019: Don't Freak Out about the Yield Curve)
For the economy, what I focus on is single family starts and new home sales. For the bottoms and tops of key housing activity, here is a graph of Single-family housing starts, New Home Sales, and Residential Investment (RI) as a percent of GDP.
Note: The pandemic has distorted the economic data, and as I've noted many times, we can't be a slave to any model.
 Click on graph for larger image.
The arrows point to some of the earlier peaks and troughs for these three measures - and the most recent peak.
The purpose of this graph is to show that these three indicators generally reach peaks and troughs together. Note that Residential Investment is quarterly and single-family starts and new home sales are monthly.
New home sales and single-family starts turned down last year, but that was partly due to the huge surge in sales during the pandemic - and then rebounded somewhat. Now both new home sales and single-family starts have turned down in response to higher mortgage rates. Residential investment has also peaked.
 The second graph shows the YoY change in New Home Sales from the Census Bureau. Currently new home sales (based on 3-month average) are down 13% year-over-year.
Note: the New Home Sales data is smoothed using a three month centered average before calculating the YoY change. The Census Bureau data starts in 1963.
Some observations:
1) When the YoY change in New Home Sales falls about 20%, usually a recession will follow. An exception for this data series was the mid '60s when the Vietnam buildup kept the economy out of recession. Another exception was in late 2021 - we saw a significant YoY decline in new home sales related to the pandemic and the surge in new home sales in the second half of 2020. I ignored that pandemic distortion.
Also note that the sharp decline in 2010 was related to the housing tax credit policy in 2009 - and was just a continuation of the housing bust.
2) It is also interesting to look at the '86/'87 and the mid '90s periods. New Home sales fell in both of these periods, although not quite 20%. As I noted in earlier posts, the mid '80s saw a surge in defense spending and MEW that more than offset the decline in New Home sales. In the mid '90s, nonresidential investment remained strong.
If the Fed tightening cycle will lead to a recession, we should see housing turn down first (new home sales, single family starts, residential investment). This has happened, but this usually leads the economy by a year or more. So, we might be looking at a recession in 2023.
There are other indicators too - such as the yield curve and heavy truck sales - but mostly I'll be watching housing. And clearly housing is in a deep recession.
I'm now on recession watch for 2023 (not predicting a recession yet - so much depends on inflation and the Fed). Best to all.
1st Look at Local Housing Markets in November
by Calculated Risk on 12/07/2022 11:53:00 AM
Today, in the Calculated Risk Real Estate Newsletter:
1st Look at Local Housing Markets in November
A brief excerpt:
This is the first look at local markets in November. I’m tracking about 35 local housing markets in the US. Some of the 35 markets are states, and some are metropolitan areas. I’ll update these tables throughout the month as additional data is released.There is much more in the article. You can subscribe at https://calculatedrisk.substack.com/
Closed sales in November were mostly for contracts signed in September and October. Mortgage rates moved higher in September, and 30-year mortgage rates were over 7% for most of October (no points), and that likely impacted closed sales in November and December.
...
In November, sales were down 45.7%. In October, these same markets were down 39.1% YoY Not Seasonally Adjusted (NSA).
Note that in November 2022, there were the same number of selling days as in November 2021, so the SA decline will be similar to the NSA decline. And this suggests another step down in sales!
Many more local markets to come!

Wholesale Used Car Prices Declined Slightly in November; Prices Down 14.2% Year-over-year
by Calculated Risk on 12/07/2022 09:15:00 AM
From Manheim Consulting today: Wholesale Used-Vehicle Prices See Minimal Decline in November
Wholesale used-vehicle prices (on a mix, mileage, and seasonally adjusted basis) decreased 0.3% in November from October. The Manheim Used Vehicle Value Index (MUVVI) declined to 199.4, down 14.2% from a year ago. This is the first time the MUVVI has dropped below 200.0 since August 2021. The non-adjusted price change in November was a decline of 1.6% compared to October, moving the unadjusted average price down 12.4% year over year.
emphasis added
 Click on graph for larger image.
This index from Manheim Consulting is based on all completed sales transactions at Manheim’s U.S. auctions.
The Manheim index suggests used car prices decreased in November and were down 14.2% year-over-year (YoY).
This also suggests the consumer price index for used cars and trucks will be down again in November.
It is likely this index will be down further YoY in December.


